
Contents of this article
- Fundamental analysis ( Fundamental Analysis : FA)
- Characteristics of fundamental analysis
- Limitations of fundamental analysis
- Technical analysis ( Technical Analysis : TA)
- Characteristics of technical analysis
- Limitations of technical analysis
- FA vs TA in the stock market
- The “Stock Trading For A Living” course

What are FA and TA in the stock market?
Sooner or later, every investor asks three questions: When should I invest (when should I enter the market)? Which stocks should I invest in? And how much money should I invest? The two key methods of securities analysis, FA and TA, help you answer those questions. So what are these two methods? Let us explore them with Green Chart in this article.
Fundamental analysis (Fundamental Analysis: FA)
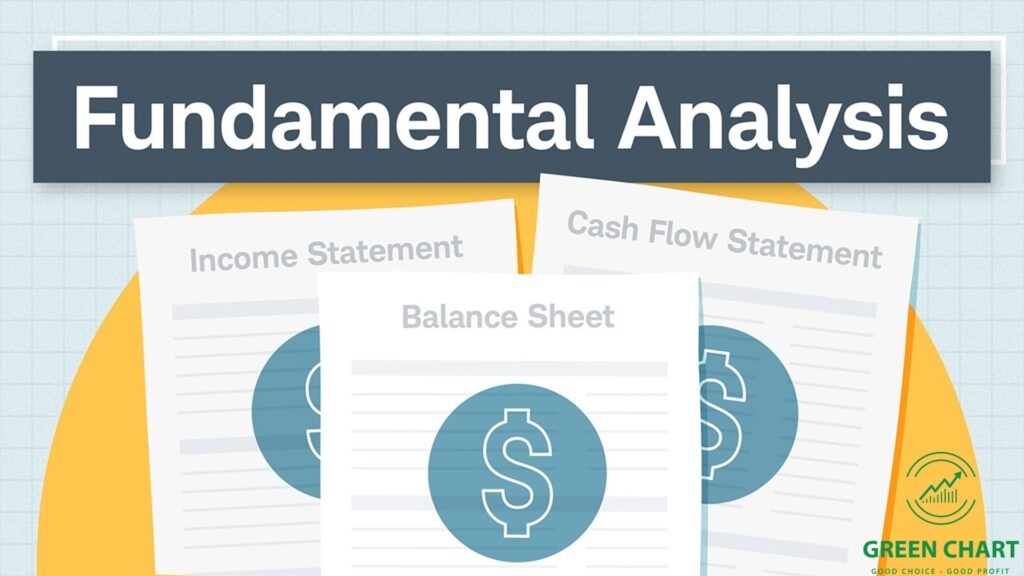
Fundamental analysis (FA)
FA is an approach investors use to determine the underlying intrinsic value (or true value) of a company or stock by studying its industry, its data and financial statements, as well as other factors such as the economic cycle and seasonality.
This method lets the analyst compare intrinsic value with the market price and so determine whether the stock is currently overvalued or undervalued. For investors who use fundamental analysis, the ideal is to invest in a company while its shares are valued below their intrinsic value.
Characteristics of fundamental analysis
Analysts usually study the overall state of the economy first, then the strength of each specific industry, and only then focus on the performance of individual companies, before arriving at a fair market value for the stock.

Characteristics of fundamental analysis
Investors use fundamental analysis to estimate a security’s intrinsic value; once valued, it is compared with the current market price to see whether the security is undervalued or overvalued. Investors then decide whether to buy or sell the stock on that basis.
For stocks, fundamental analysis uses company data such as revenue, earnings, return on equity, future growth, profit margins and other data to determine a stock’s fundamental value and future growth potential. That makes it the school of thought best suited to long-term investing.
Limitations of fundamental analysis
With fundamental analysis, investors need to gather and process a large volume of economic and financial information, with many variables to take into account, and the values of those variables are affected by subjective judgment. Its accuracy also depends on the accuracy of the information the investor uses.
When fundamental analysis looks at data from financial statements, the economic outlook and cycles, and even forecasts future growth with models, we cannot avoid making basic assumptions, such as assuming the company will grow by X% a year, or that it will win a lucrative new contract. These assumptions MAY or MAY NOT come true, and that affects the outcome of a given investment decision.
Moreover, buying undervalued stocks with high intrinsic value does not mean your investment will rise in value the next day (it may take months or even years). That is because the market is not rational and may not reflect a stock’s underlying intrinsic value. So for investment decisions based purely on fundamental analysis, you need a great deal of patience for things to work in your favour.
Technical analysis (Technical Analysis: TA)

Technical analysis (TA) is another approach that investors take, based on analysing price charts. From price charts, investors can identify important details such as a company’s price trend and price momentum. They can then judge their ideal buy and sell points.
According to Clifford Pistolese: “Technical analysis is the use of price and volume charts as the basis for investment decisions. The fundamental premise of this approach is that the price and volume information on the chart reflects everything that is happening in the buying and selling of a stock. Because stock charts summarize and reflect the actual results of completed trades, technical analysis is the only basis for investors’ decisions.”
Characteristics of technical analysis
Technical analysis is used to evaluate investments and decide when to buy or sell securities based on trends and price patterns on the chart. Whereas investors use fundamental analysis to assess a stock’s value based on the company’s history, business results and other factors, technical analysis focuses on studying price and trading volume, historical price patterns and stock trends.

Characteristics of technical analysis
The tools of technical analysis let investors assess how supply and demand affect a stock’s price. Because of this, technical analysis is often used for short-term trading.
Limitations of technical analysis
Technical analysis relies on the past, but history never repeats itself exactly. In technical analysis, if enough people use the same signals, they can cause the very move the signal predicted; in other words, it becomes a self-fulfilling prophecy.
For example, many technical traders place stop-loss orders just below a given company’s 200-day moving average (MA200). If a large number of investors do the same, a flood of sell orders will be triggered when the stock reaches that level, pushing the price down; at that point investors “confirm” for themselves that cutting losses when price breaks below the 200-day moving average was the right call. Other investors see the price falling and sell their positions too, further reinforcing the trend. Investors can see that this short-term selling pressure is self-fulfilling, but the decline is only short-lived and has very little effect on the asset’s price over the following weeks or months.
Technical analysis also has many different schools and methods, such as Japanese candlestick charting, Elliott Wave Theory, reversal and continuation patterns, Dow Theory, trendline charting, the Fibonacci series, technical indicators, pivot points, William O’Neil’s CANSLIM investing method and Wyckoff analysis. Each school and method has its own strengths and weaknesses, so when trading, investors should combine one method with another so that they complement each other.
FA vs TA in the stock market
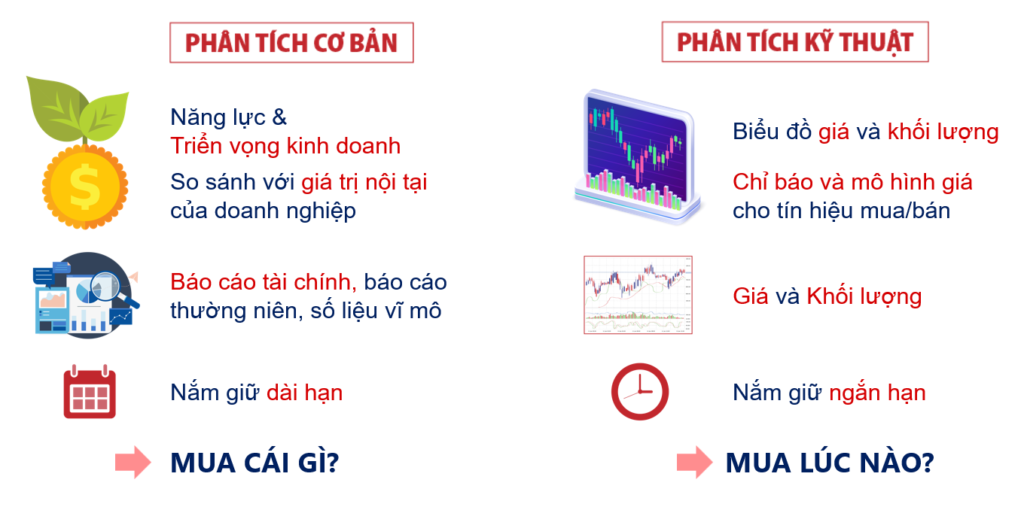
FA vs TA in the stock market
First, both methods are used to study and forecast future stock price trends and, like any investment strategy or philosophy, both have their supporters and their critics.
Fundamental analysis is a method investors use to evaluate securities by trying to measure their intrinsic value, specifically that of stocks in the market. Fundamental analysts research everything from the overall economy and industry conditions to companies’ financial health and management. Earnings, expenses, assets, liabilities and so on are all key characteristics for fundamental analysts.
Technical analysis differs from fundamental analysis in that a stock’s volume and price are its core inputs. Its most important assumption is that all known fundamentals are already reflected in the price, so there is no need to pay attention to them. Technical analysts do not try to measure a security’s intrinsic value; instead, they use charts to identify patterns and trends that suggest how the security will perform in the future.
Today, most experienced investors combine fundamental and technical analysis flexibly, because each adds value in its own way. So rather than relying on one or the other, using the two methods in a balanced and sensible way will be more effective.
Happy trading!
The “Stock Trading For A Living” course
Green Chart designed this course to give you a solid grounding in fundamental analysis & stock valuation, and to show you how to integrate it effectively into your existing trading system, especially if you already trade with technical analysis. The programme includes 5 theory sessions and 6 months of hands-on trading guidance in the live market with the lecturer.
Find out more about the course here.