
Contents of this article

Price gaps are one of the most common concepts in technical analysis, especially in the stock market. So what types of gaps are there, and how should you trade each one? Let us find out in this article.
What is a gap? What is a gap in the stock market?
A gap, or price gap, is the space between two consecutive trading sessions (or two consecutive candles). We determine whether there is a gap from the closing price of the earlier candle and the opening price of the later one. One small point: you cannot see gaps on a line chart.
A gap appears when a session opens above or below the real body of the previous session’s candle, leaving an empty space on the chart.
There are generally two types of gap:
- When the next session opens above the previous session’s close (if the previous candle was green), or above the previous session’s open (if the previous candle was red), we have a gap up.
- Conversely, when the next session opens below the previous session’s open (if the previous candle was green), or below the previous session’s close (if the previous candle was red), we have a gap down.
A gap, or price gap, is the space between two consecutive trading sessions (or two consecutive candles).
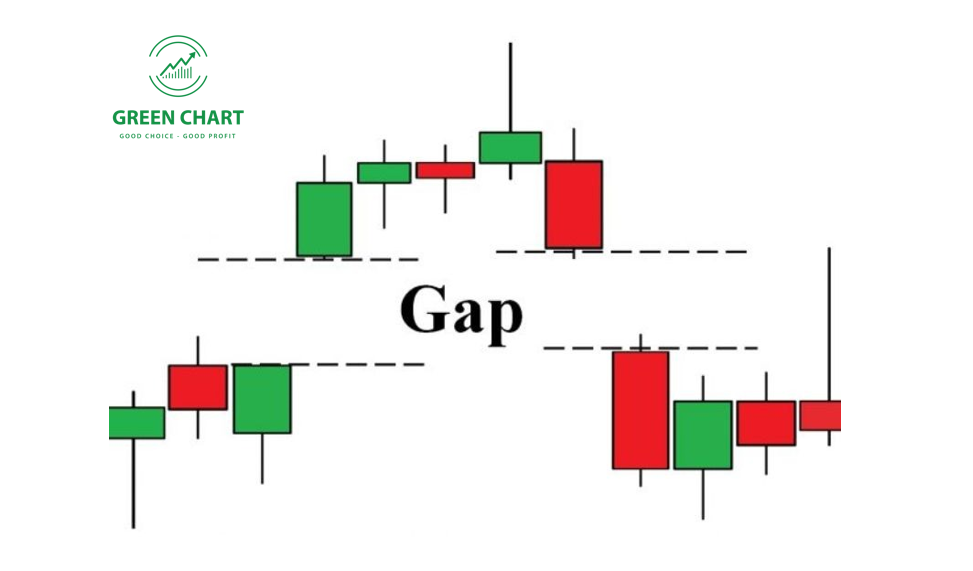
We can also classify gaps by their nature and by when they appear.
What is a common gap?
Common gaps usually appear when a stock is moving sideways within a narrow range. These gaps are fairly small and are quickly filled. They have little effect on the stock’s price action and are considered a fairly weak signal.
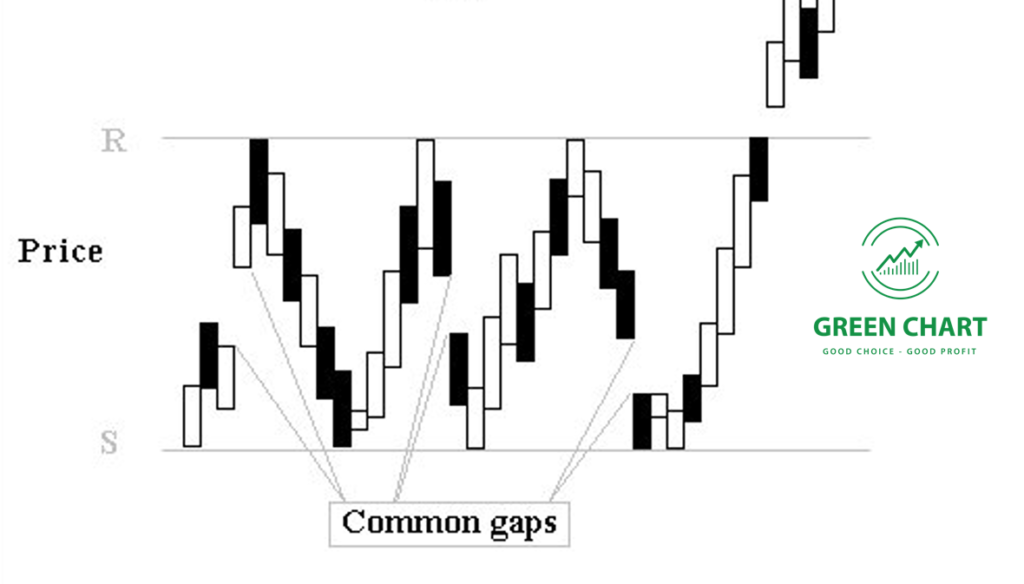
Example of a common gap
What is a breakaway gap?
A breakaway gap is a price gap that breaks a stock’s trend. It appears when unexpected news or events hit the market. When such news comes out, investor sentiment changes quickly and the price trend shifts from up to down or vice versa. Breakaway gaps are usually hard to fill; price may come back to fill them, but more often it simply keeps rising or falling. This type of gap is usually easy to spot in a trend, when price breaks out of a trading range or follows a trend reversal. It acts as strong support or resistance: a gap down acts as a resistance zone, while a gap up acts as a support zone.
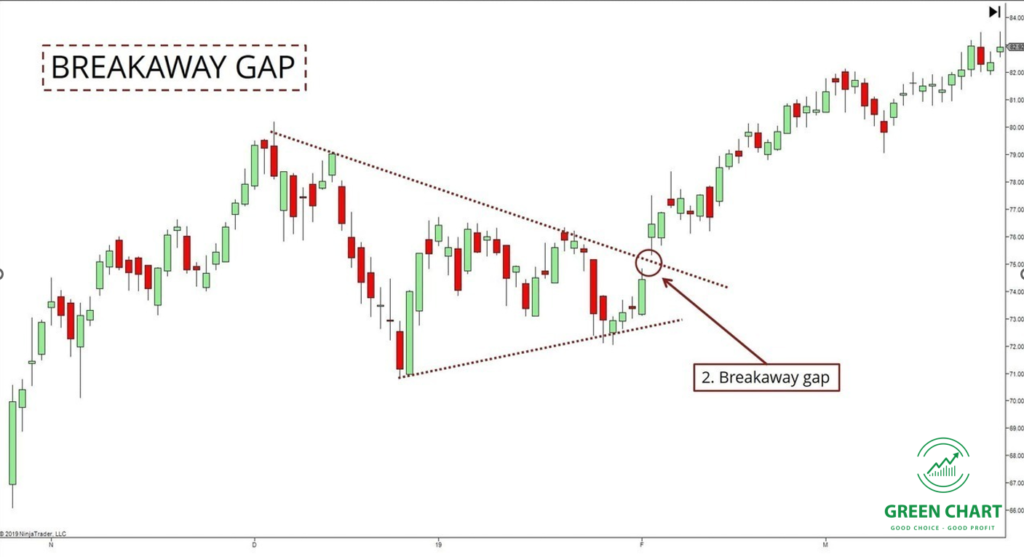
Breakaway gap
What is a runaway gap?
A runaway gap appears once a downtrend or uptrend has already formed. Runaway gaps are very easy to spot in the stock market because they are so common.
They will not be filled, because the market keeps moving in the direction of the current trend. In an uptrend, a gap up forms, reflecting investors’ fear of missing out or panic buying; they do not hesitate to buy. Conversely, a gap down forms in a downtrend: investors turn pessimistic and sell heavily, believing the chance of a price recovery is low.
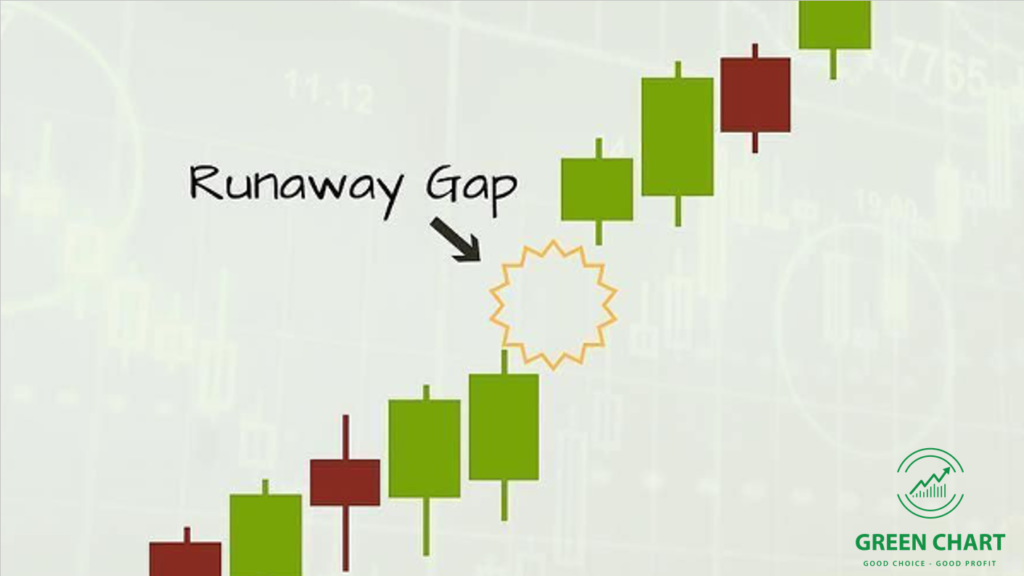
Runaway gap
What is an exhaustion gap?
Exhaustion gaps usually appear at a bottom or a top after a long downtrend or uptrend.
When this type of gap comes with heavy trading volume, it signals a high probability of a trend reversal. To be sure, though, investors still need confirmation from trendlines and other indicators. Because these gaps usually occur near the end of a trend, investors need to watch them closely to manage their trades as well as possible.
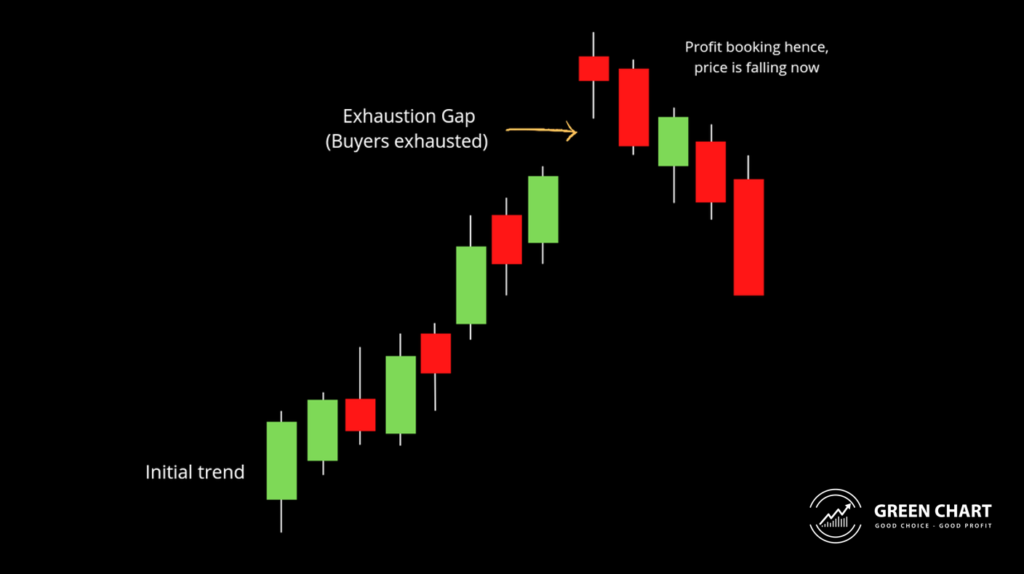
Example of an exhaustion gap
What is an island reversal?
An island reversal is a short-term pattern formed by gaps on both sides of one or more candles on a technical chart. It is a reversal pattern that appears around market tops or bottoms.
When an island reversal appears at the bottom of a downtrend, a gap forms followed by a cluster of candles trading in a narrow range. The pattern completes when a gap up appears and price then reverses. Likewise, when an island reversal appears in an uptrend, after a rally the chart forms a bullish gap, followed by a cluster of candles in a range that looks like an island far offshore. Finally, the pattern completes with a bearish gap and price moves down.
The island reversal is a reversal pattern, but it is not very reliable. Investors should therefore combine it carefully with other indicators before making investment decisions. Patterns with long shadows are better than those with short shadows, and tall, narrow patterns tend to perform better.

Example of an island reversal
Tips for trading price gaps
An opening gap is a price gap that appears right at the market open, relative to the previous session. This is when many investors trade in search of profit. However, trading as soon as the gap appears, without solid confirmation from other factors and indicators, is very risky. So when a gap appears, do not rush into a decision; watch to see whether the gap is filled during the session and work out what type of gap it is. You should also combine it with volume indicators, or wait for confirmation from the next candle, before deciding to buy or sell.

Breakaway gaps are usually confirmed by a sudden surge in volume, while low trading volume often accompanies exhaustion gaps.
Happy trading!
The “Stock Trading For A Living” course
Green Chart designed this course to give you a solid grounding in fundamental analysis & stock valuation, and to show you how to integrate it effectively into your existing trading system, especially if you already trade with technical analysis. The programme includes 5 theory sessions and 6 months of hands-on trading guidance in the live market with the lecturer.
Find out more about the course here.