Contents of this article
What is the Stochastic formula?
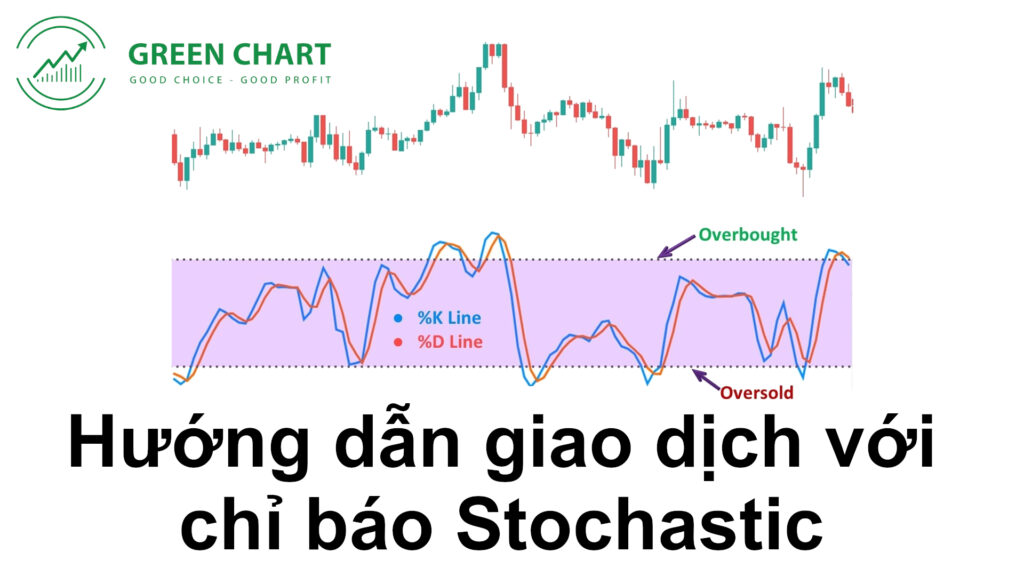
The Stochastic is a momentum indicator used in technical analysis, developed in the late 1950s by George Lane (some attribute it to Ralph Dystant). The indicator shows where price stands relative to its highest high and lowest low over a preceding period.
The indicator has two lines: a main line called %K and a secondary line called %D.
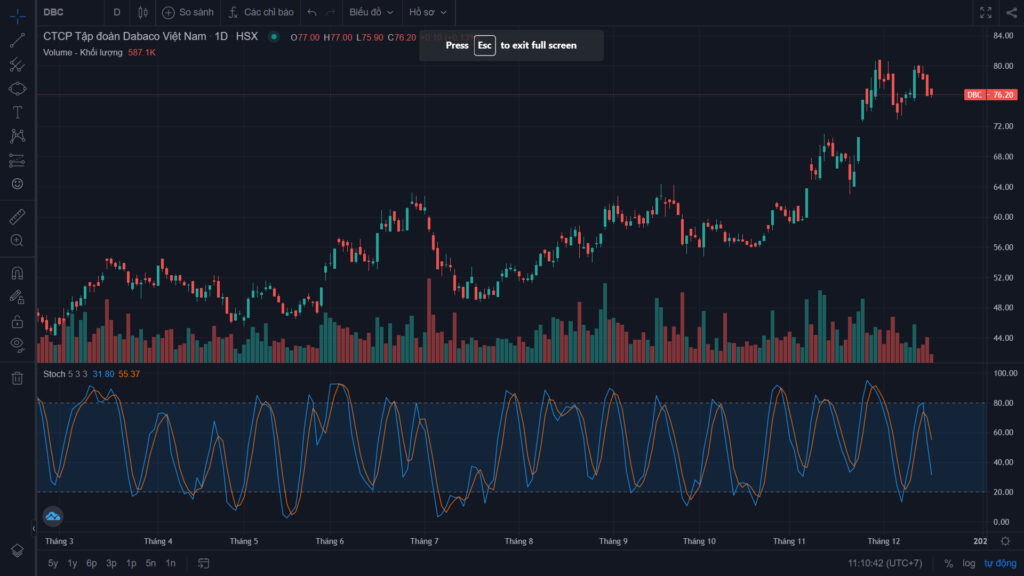
The indicator comes with three parameters (x, y, z). Remember these three parameters, because they are tied to the formulas used to build the Stochastic, which I explain below. The most commonly used settings are (14, 3, 3) and (5, 3, 3).
The formula for the %K line:
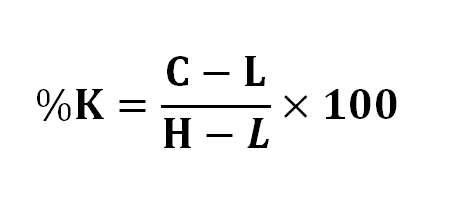
Where, over the most recent x sessions:
C is the current price,
L is the lowest price over x sessions,
H is the highest price over x sessions.
In practice, however, the raw %K calculated above is not used directly. Instead, it is “smoothed” with a moving average (MA over y sessions) of %K, because the raw %K is too sensitive to price.
The second component, the %D line, is the MA (over z sessions) of that y-session MA. In other words, %D is %K smoothed twice.
Example: Stochastic (10,3,3) calculates %K from the current, high and low prices of the last 10 sessions, smooths the result first with MA(3; %K), and then smooths it a second time with MA(3; MA(3; %K)).
Characteristics of the Stochastic
Lane held that the Stochastic does not follow price, volume or anything similar; instead, it follows the speed or momentum of price. As a rule, the momentum or speed of a stock’s price changes before the price itself changes. The indicator is therefore classed as a leading indicator, as opposed to a lagging indicator.
As a momentum indicator, the Stochastic also tells us whether price is changing quickly or slowly. This is similar to the RSI indicator we covered in an earlier article. Moreover, the indicator’s values always lie between 0 and 100, making it a useful gauge of overbought and oversold conditions. Values above 80 are usually considered overbought, while values below 20 are considered oversold. In my personal experience, however, the 30–70 thresholds are a better fit when trading stocks in the Vietnamese market.
Identifying overbought and oversold zones with the Stochastic
The Stochastic shares this property with the RSI, so you can use the same overbought/oversold strategy as with the RSI. The best buy points come when the Stochastic rises and confirms its exit from oversold territory. The best sell points come when the Stochastic falls and confirms its exit from overbought territory. This strategy works best in a sideways market.
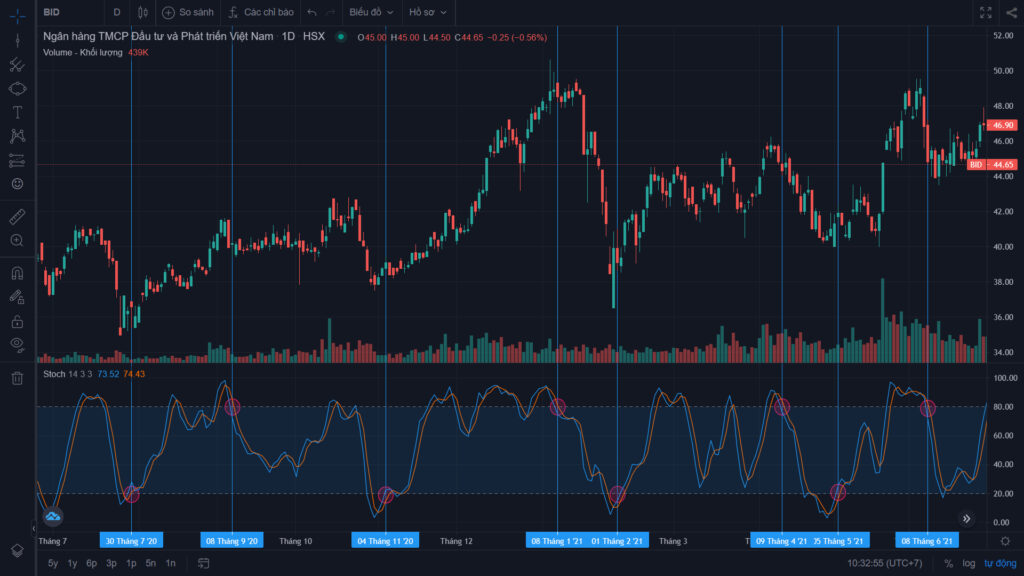
Good buy and sell points in a sideways market
In a trending market, the best thing to do is trade with the trend and not fight it. For example, when a stock is in an uptrend, you can look for buy points based on the Stochastic’s oversold zone, but you should not use overbought readings as sell points. In addition, a buy point has a higher chance of success if price is at a strong support zone.
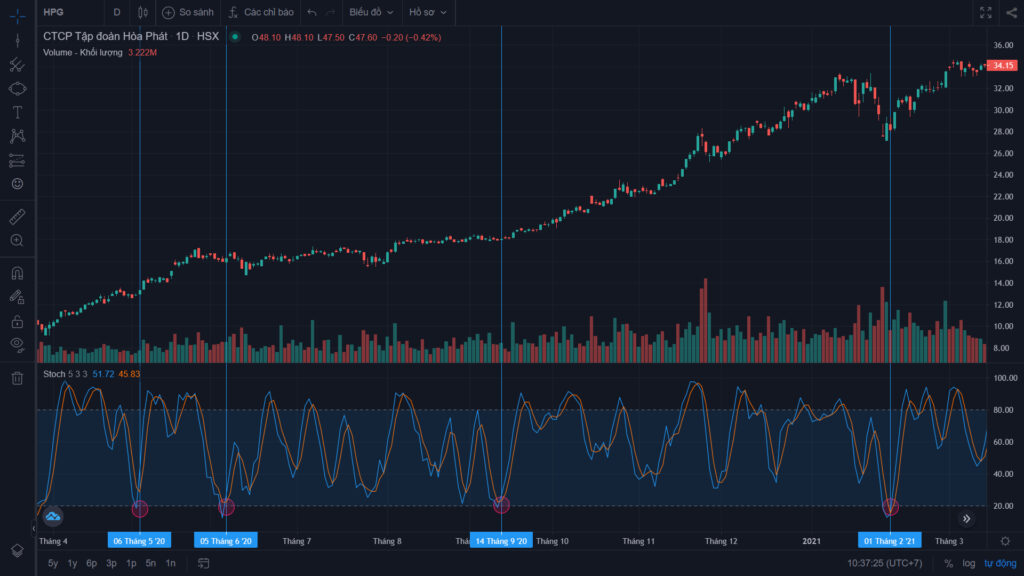
Good buy points in an uptrend
Trading Stochastic divergence
Divergence between the Stochastic and price action is also considered an important reversal signal. For example, when price is in a downtrend and makes a lower low, but the indicator makes a higher low, that may signal that the bears are running out of momentum and a bullish reversal is about to form.
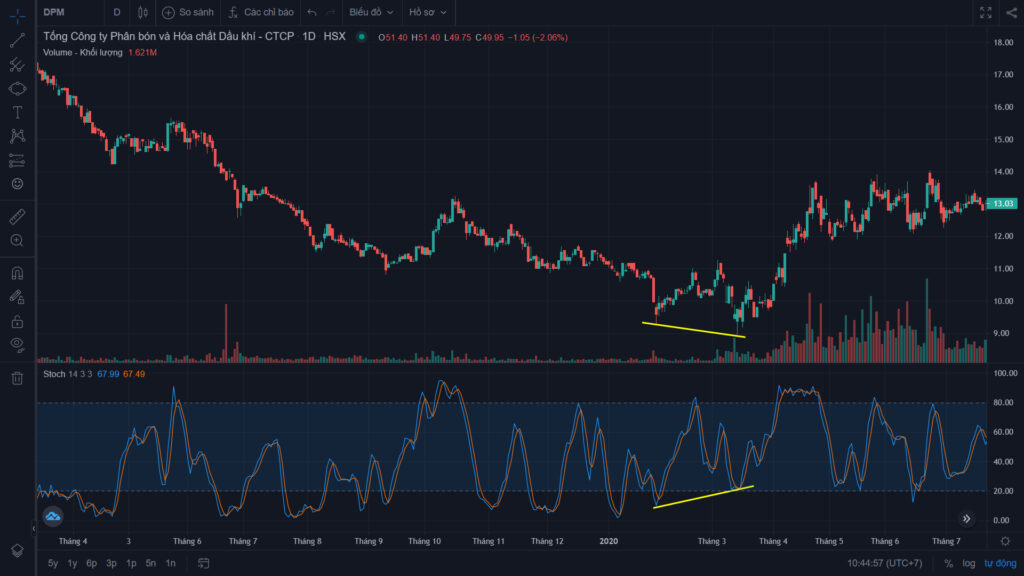
Stochastic divergence signalling that a downtrend is about to end
Conversely, when price breaks above its previous high and confirms the uptrend, but the Stochastic fails to make a new higher high, momentum in this advance is weaker than at the previous peak, signalling an unsustainable uptrend. At that point we can start thinking about selling to take profit.
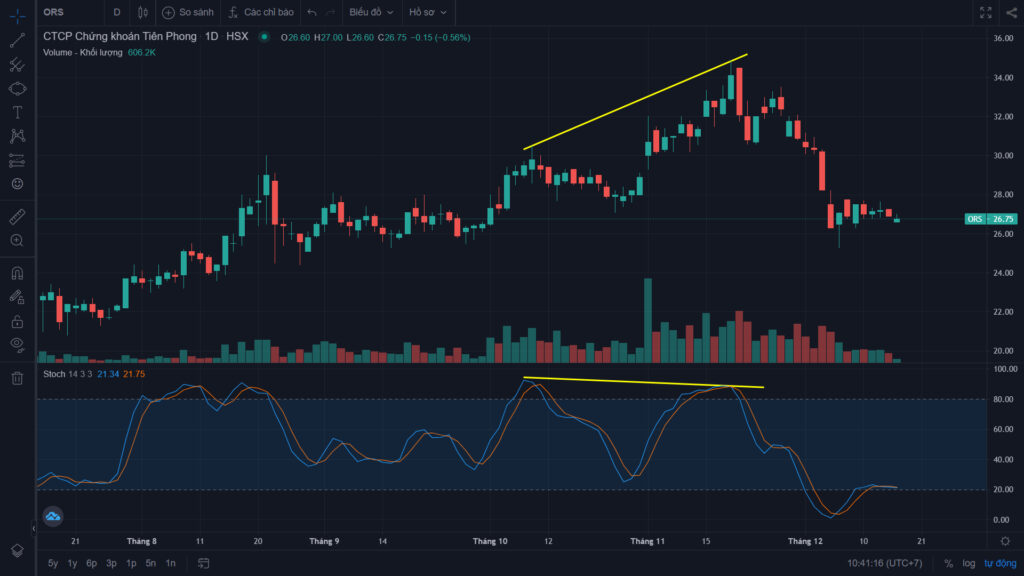
Stochastic divergence signalling that an uptrend is about to end.
Technical Analysis Course – CMT Level 1
Green Chart designed this course specifically for candidates in Vietnam who want to study and prepare for the CMT Level I exam. The programme includes 27 sessions of theory, practice questions and mock exams. Students also receive the course materials, question bank and mock exams free of charge, and can retake the course for free for life.
See full course details here.
Happy trading !