

Contents of this article
- What is stock valuation?
- Market value vs. intrinsic value of a stock
- Relative valuation (multiples)
- What is the P/E ratio?
- What the P/E ratio tells you
- Trailing P/E
- Forward P/E
- Valuing a stock with the P/E method
- The P/B ratio
- The P/S ratio
- The P/CF ratio
- The EV/EBITDA ratio
- Discounted cash flow valuation
- Net asset valuation
- The “Stock Trading For A Living” course

What is stock valuation?
Stock valuation is the process of determining a price for a stock that accurately reflects all the factors affecting it. This price is called the intrinsic value, also known as fair value or fundamental value.
In other words, valuing a stock means finding its intrinsic value.
In the opening example, to find the stock’s intrinsic value you would need to work out precisely how much the company’s earnings will grow, in percentage terms. That is clearly impossible (unless you are a clairvoyant like Baba Vanga), but with fundamental analysis methods you can assess different scenarios, pick the most probable one, and then determine the stock price that matches the assumptions of that scenario.
For example, if logical reasoning leads you to conclude that Company A’s earnings will grow by 20%, then a price of VND 50,000 is the stock’s intrinsic value. In that case, you have valued Stock A at VND 50,000.
As with any other asset, a stock’s price reflects what most investors expect to receive from owning it. A stock price is therefore a function of many input variables, such as future revenue and earnings growth, or macroeconomic factors such as interest rates, inflation and the business cycle.
Consider a simple example: the market expects Company A’s net profit after tax (NPAT) to grow 20% by year-end, the stock trades at VND 50,000, and the current market price already reflects investors’ expectations for that growth.
If Company A’s NPAT does not grow as expected, the share price may fall to VND 40,000. In this case, the price of Stock A is a function of future earnings growth:
P = f(E), where E is the expected future earnings growth.
Under these assumptions, P = f(20%) = VND 50,000 and P = f(0) = VND 40,000.
In reality, of course, stock prices depend on many more factors; the example above simply keeps things manageable. Suppose Stock A currently trades at VND 50,000. This tells us the market expects the company’s earnings to rise by 20%.
If at year-end the company publishes its financial statements and earnings have grown by exactly 20%, the share price will not change. If earnings stay flat, the price will fall to VND 40,000, because investors’ expectations turned out to be out of line with reality.
This opening example captures the theoretical basis of stock valuation: you need to find the correct value of E, and then derive P, which is the stock’s intrinsic value.
Market value vs. intrinsic value of a stock
Even if you have a watertight case for believing Company A’s earnings will grow 20%, other investors may not agree. The Vietnamese stock market has millions of investors, large and small, with millions of different expectations: some share your belief in growth, while others think the company’s earnings will decline.
If most of the market believes Company A’s earnings will stay flat, Stock A will trade at VND 40,000. This is the price set by market supply and demand, based on investors’ expectations. Because most retail investors lack the knowledge to assess Stock A accurately, gaps open up between the market price and the stock’s intrinsic value.
If markets were efficient and always reflected all real information about stocks immediately and completely, a stock’s market price would always equal its intrinsic value. Clearly, however, that assumption does not hold.
Even so, fundamental analysts believe that over the long term a stock’s market price will always converge towards its intrinsic value, and they trade on that belief to make a profit.
- If the market price is below intrinsic value, the stock is considered undervalued and investors will buy.
- If the market price is above intrinsic value, the stock is considered overvalued and investors will sell.

In the next section, we will look at the 8 most widely used valuation methods for estimating a company’s fair intrinsic value. They fall into 3 main groups:
- Relative valuation (multiples): P/E, P/B, P/S, EV/EBITDA, etc.
- Discounted cash flow valuation.
- Net asset valuation.
Relative valuation (multiples)
This approach rests on the premise that a stock’s price rises and falls in step with the size of the business. If earnings, revenue or shareholders’ equity grow, the share price rises with them, but the ratio between the share price and those figures stays the same. The ratios, or multiples, most commonly built from the share price are P/E, P/B and so on.
What is the P/E ratio?
This is the most widely used multiple in stock valuation. P/E is the ratio of the share price to EPS (the price-to-earnings ratio). EPS is earnings per share, calculated as net profit after tax divided by the number of shares outstanding.
You can easily calculate P/E from readily available market data, or look it up from stock data providers.


What the P/E ratio tells you
The P/E ratio tells you how much you have to pay to receive 1 dong of the company’s earnings. For example, if a stock has a P/E of 8, buying it means you accept paying 8 dong of capital for every 1 dong of the company’s earnings. It also means it would take you 8 years to recoup your initial investment in the company.
The inverse of P/E is the earnings yield (E/P), which tells you the stock’s rate of return. For the stock above, the earnings yield is 1/8 = 12.5%, meaning the stock could give you a 12.5% return. Some investors focus on this figure: if a stock’s earnings yield exceeds their cost of capital, they will invest in it.
Trailing P/E
Trailing P/E is the current share price divided by the total EPS of the reporting periods over the trailing twelve months (TTM). The P/E you find in market data is the trailing P/E, because it uses publicly available inputs. Trailing P/E changes constantly because the share price changes constantly.
Investing in stocks is about future value, yet trailing P/E only reflects past earnings. In the example above, if you buy a stock with a trailing P/E of 8, you have paid 8 dong for 1 dong of the company’s earnings.
However, this only holds if the company’s earnings next year are unchanged from last year. Next year’s earnings may rise or fall, so you might pay 8 dong today but receive 2 dong, or only 0.5 dong, of the company’s future earnings.
Forward P/E
Forward P/E is the current share price divided by the company’s projected future EPS, usually for the next fiscal year. Forward P/E reflects future value and the real yield the stock offers you more accurately. If a company has a forward P/E of 7, investors are willing to pay 7 dong for 1 dong of the company’s future earnings, equivalent to an earnings yield of 14.28%.
Unlike trailing P/E, forward P/E uses projected EPS. This figure is not readily available; you have to analyse the business and forecast its future earnings. Research reports from brokerage firms also give projected EPS and forward P/E figures based on their own views. These numbers can differ, and you can use any that look reasonable as a reference.
Whereas trailing P/E is merely a market statistic, forward P/E is precisely the number investors should weigh when deciding whether to invest in a stock, and it is also the number used to value it.
Valuing a stock with the P/E method
To find a stock’s fair value, you need to determine projected EPS and a reasonable P/E, then multiply the two together to get the share price.
If the business environment is unchanged, you can assume EPS will keep growing at the same rate to arrive at projected EPS. If the company has new expansion projects, you need a well-reasoned estimate of the revenue and profit those projects will bring, and then calculate projected EPS.
As for P/E, a stock’s fair P/E is usually its own historical average P/E, provided the company has maintained its market share and competitive advantage within the industry. Alternatively, you can use the industry average P/E, though it should be adjusted for the company’s risk. You can look up industry average P/E on Fialda.
An important point when using the industry average P/E: ideally, take it from a group of companies whose business activities and segments are closely comparable, rather than picking a generic P/E. For example, within the power sector, hydropower companies tend to trade at higher P/E ratios than thermal power companies.

A company’s P/E depends on how risky the business is. For large-cap companies that lead their industry in market share and have strong finances, risk is low and investors are willing to pay a high P/E. Conversely, small-cap companies without a strong industry position will only command a low P/E.
If you have no experience valuing stocks yet, it is best to study the Valuation section of brokerage firms’ research reports to learn the steps involved and the base-case projections.
Here is an example of a quick valuation of VNM stock using this method, with a target price for 2022 (Disclaimer: this example is for reference only and is not investment advice!).
Vinamilk is the leader of the dairy industry, which is in a mature, saturated stage. In addition, the consumer staples sector was barely affected by COVID-19, so the company should sustain revenue growth of 5–7%, as it has for many years. According to management, input material prices will ease in 2022, helping the company improve its profit margins, which had been squeezed in 2020 and 2021.
I therefore forecast VNM’s 2022 NPAT at VND 11,950 billion, up 9% from 2021, equivalent to EPS of VND 5,720 per share.
For P/E, I used data from Fialda and found that the stock has traded at an average 5-year P/E of about 21x. VNM’s fair value for 2022 is therefore VND 120,100.

Under certain conditions and for certain types of business, P/E loses its effectiveness and practicality as a valuation tool. In those cases we can use other variants instead of P/E, such as:
The P/B ratio
P/B is the ratio of the share price to book value per share (the price-to-book ratio). Book value per share is the shareholders’ equity on the company’s balance sheet attributable to each share, calculated as shareholders’ equity divided by the number of shares outstanding.
P/B is also the ratio of the company’s market capitalisation to its shareholders’ equity.
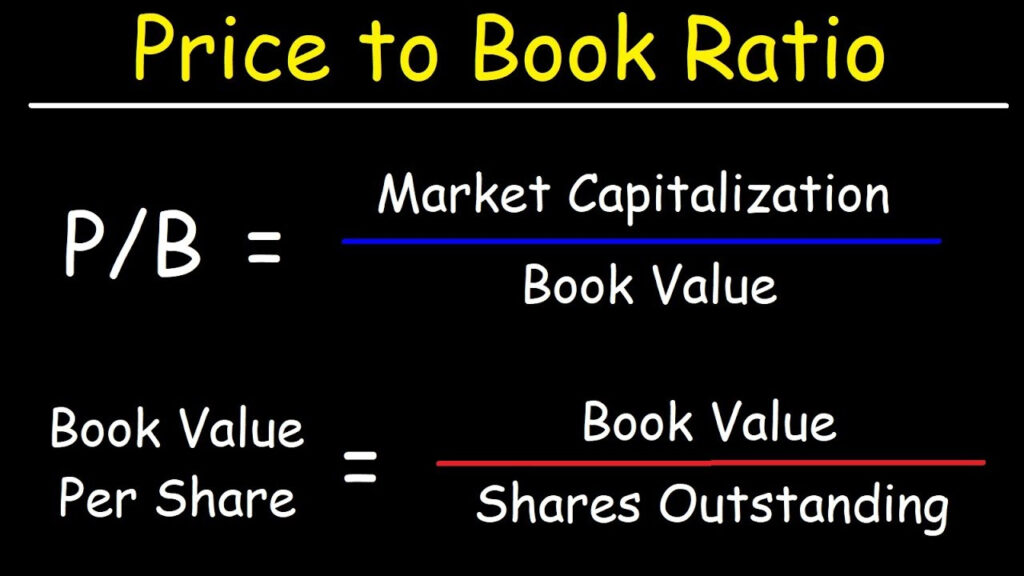
The gap between a stock’s market price and its book value comes from future value the business generates that is not recorded on the balance sheet. For example, the Apple brand keeps the company’s sales growing strongly and creates a great deal of value for shareholders, yet it is not carried on the balance sheet.
The properties of P/B and the way it is used to value stocks are exactly the same as for P/E, described above. P/B should be used to value banks and real estate companies, because their earnings are highly erratic by the nature of the industry, so P/E cannot be used to value them.
The P/S ratio
P/S is the ratio of the share price to revenue per share (the price-to-sales ratio), which is also the ratio of the company’s market capitalisation to its revenue. It is often used to value young companies (start-ups), which in their early stages are usually not yet profitable and have negative EPS, so P/E cannot be used.
The P/CF ratio
P/CF is the ratio of the share price to cash flow per share (the price-to-cash-flow ratio). The cash flow used here can be cash flow from operations (CFO), or free cash flow to the firm (FCFF) or to equity (FCFE).
The EV/EBITDA ratio
The multiples above are used to value the share price directly, i.e. the company’s market capitalisation, which is the value of its equity. EV/EBITDA, by contrast, is used to determine enterprise value (EV), from which the stock is then valued.
Enterprise value is the cost of acquiring a business. To acquire a company, the acquirer first has to pay an amount equal to the target’s market capitalisation. Later, the combined company has to pay off all of the subsidiary’s debt.
The total cost of acquiring the business is therefore the market value of its equity plus the market value of its debt, i.e. the market value of the company’s total assets. However, the subsidiary’s cash can also be used to repay debt, so enterprise value is adjusted using the formula:
EV = Market value of equity + Market value of debt – Cash
EV/EBITDA is the ratio of enterprise value to EBITDA, i.e. earnings before interest, taxes, depreciation and amortization.

EV/EBITDA is used for valuation in the same way as P/E. You project EBITDA, determine a reasonable EV/EBITDA multiple, and multiply the two to get a fair enterprise value. You then estimate the company’s cash and value its debt to arrive at the stock’s intrinsic value.
Valuing with EV/EBITDA is more complex than with P/E: unlike P/E, EV/EBITDA is harder to look up, and you also need extra steps such as valuing the debt and projecting the company’s cash balance.
This ratio is used to value companies with complex capital structures, because it assesses not only equity but also the company’s debt structure. EV/EBITDA also gets around the problem of negative earnings at companies whose heavy depreciation of fixed assets in their early years depresses reported profit, since EBITDA excludes depreciation.
Discounted cash flow valuation
The discounted cash flow (DCF) model states that the price of an asset equals the sum of its future cash flows discounted back to the present at a discount rate.
For stocks specifically, the future cash flows are dividends, so you can project future dividends and then discount them back to the present. The share price follows the formula:

In addition, methods that discount the company’s free cash flow can also be used to value a business, most notably FCFF and FCFE.
The discounted cash flow method is fairly complex and requires you to make projections over many years, and the further out the projection, the less accurate it becomes. This method is therefore best used for large companies that generate stable cash flow and are little affected by macroeconomic factors. We will discuss these two methods in more detail in another article.
Net asset valuation
Based on the basic accounting equation Total assets = Liabilities + Shareholders’ equity, you can value equity by appraising the company’s actual assets and subtracting its liabilities. This is called the revalued net asset value (RNAV) method.
This method is widely used to value real estate companies and banks, because their assets are large and their market value is easier to estimate than for other types of business. That is also the method’s weakness: it cannot be used to value companies with many intangible assets.
One idea I often apply with this method comes from the legendary investor Benjamin Graham, who applied a 75% discount to receivables and a 50% discount to inventory when valuing assets.
Happy trading!
The “Stock Trading For A Living” course
Green Chart designed this course to give students a solid foundation in fundamental analysis & stock valuation (Fundamental Analysis), and to show them how to integrate it effectively into their existing trading system, especially for traders who already use technical analysis (Technical Analysis). The program consists of 5 theory sessions and 6 months of hands-on guided trading in the live market with the lecturer.
See full details of the course here.