
Contents of this article

Are you planning to carry out fundamental analysis on some companies you want to invest in? If so, calculating and assessing turnover ratios first is a useful step that helps you analyse how efficiently a company uses its assets to generate revenue.
Turnover ratios are used to examine operating efficiency and how a company uses its assets to generate revenue. They compare business figures with various assets so we can see how many assets the company used to generate its sales.
A company uses many types of assets to generate revenue and keep its operations going. That is why turnover ratios belong to the group of efficiency ratios. In this article, let’s look at some of the most commonly used turnover ratios.
Inventory turnover ratio
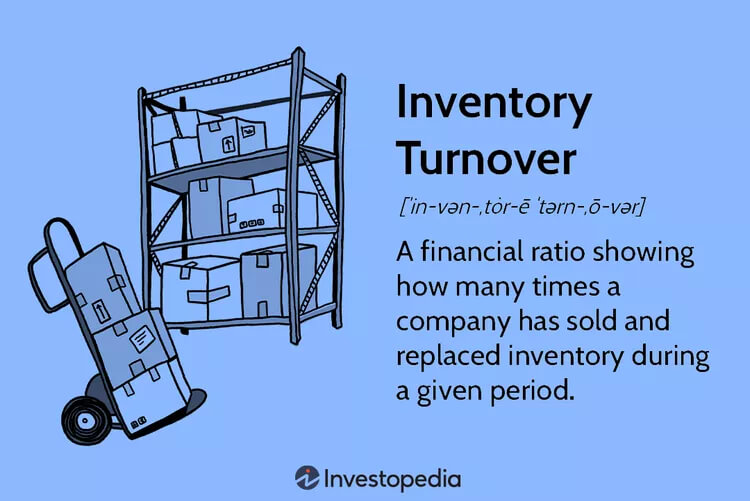
Inventory turnover is a financial ratio that shows how many times a company turns over its inventory relative to its cost of goods sold (COGS) over a given period. A company can then divide the number of days in the period, usually the fiscal year, by the inventory turnover ratio to calculate how many days, on average, it takes to sell its inventory.
The inventory turnover ratio can help a company make better decisions on pricing, production, marketing and purchasing. It is one of the ratios used to assess how efficiently a company uses its assets.
The inventory turnover ratio is calculated as follows:
Inventory turnover = Cost of goods sold / Average inventory
The denominator uses average inventory to offset the seasonality effect. It is calculated by adding the inventory value at the end of the current period and at the end of the previous period, then dividing the total by 2.
Cost of goods sold (COGS) is also called cost of sales. Analysts use COGS rather than sales in the inventory turnover formula because inventory is usually valued at cost, while revenue includes the company’s markup. In practice, however, some companies still use revenue instead of COGS in the calculation, which tends to inflate the ratio.
Fixed asset turnover ratio
The fixed asset turnover (FAT) ratio compares net revenue (from the income statement) with fixed assets (from the balance sheet) and measures a company’s ability to generate net revenue from its investments in fixed assets, namely property, plant and equipment (PP&E).
The formula for this ratio is:
Fixed asset turnover = Net revenue / (Gross fixed assets – Accumulated depreciation)
The fixed asset figure used in the formula is the final figure after deducting accumulated depreciation. A higher fixed asset turnover ratio shows that a company has used its investments in fixed assets effectively to generate revenue.
This ratio is commonly used as a benchmark in manufacturing industries that depend heavily on PP&E to increase output. When a company makes such large purchases, savvy investors watch this ratio closely in the following years to see whether the company’s new fixed assets pay off in higher sales.
In general, investments in fixed assets tend to make up the largest share of a company’s total assets. The FAT ratio is calculated annually to show how efficiently a company, or more precisely its management team, has used these key assets to generate revenue.
The ratio is also well suited to assessing companies in heavy industry, where large amounts of capital are tied up in investments such as production facilities. As a result, it is also used to compare companies within specific industries.
Note that the higher the ratio, the more efficiently the company uses its fixed assets, and the more it can generate revenue with a minimal amount of fixed assets without having to raise additional capital.
Receivables turnover ratio
The receivables turnover ratio measures how many times a company collects its average receivables balance. It quantifies how effectively the company collects revenue that customers have not yet paid and manages its credit process.

The formula for this ratio is:
Receivables turnover = Net credit sales / Average receivables
Where:
Net credit sales are sales for which cash is collected later (at some point in the future). Specifically, net credit sales = Credit sales – Sales returns – Sales discounts.
Average receivables is the sum of receivables at the beginning and end of the period (for example, monthly or quarterly), divided by 2.
An efficient company will usually have a higher receivables turnover ratio, and an inefficient one a lower ratio. The figure is often used to compare companies in the same industry to see whether they are on a par with their competitors.
Receivables are interest-free, short-term loans that companies extend to their customers. When a company sells to a customer, it may give the customer 30 or 60 days to pay.
The receivables turnover ratio measures how effectively a company collects its receivables, i.e. the credit it extends to customers. It also measures how many times the company’s receivables are converted into cash over a given period. It is calculated on an annual, quarterly or monthly basis.
Payables turnover ratio
The payables turnover ratio is a short-term liquidity measure used to determine how quickly a company pays its suppliers. It is also called the creditors’ turnover ratio, because it measures the average number of times a company pays its creditors over a specific period.
The ratio is calculated as follows:
Payables turnover = (Cost of goods sold + Ending inventory – Beginning inventory) / Average payables
Where:
Payables are short-term debts a company owes to its suppliers and creditors. Average payables for the period are calculated by adding the opening and closing balances of accounts payable and dividing by two.
Investors can use the payables turnover ratio to determine whether a company has enough cash or revenue to meet its short-term obligations. Creditors can use it to decide whether to extend a line of credit to the company.

Capital employed turnover ratio
This ratio shows how efficiently the capital a company employs generates sales. It helps investors determine the company’s ability to generate revenue from the capital it uses, and is an important factor in decisions about whether the company should borrow more.
The ratio is calculated with the following formula:
Capital employed turnover = Net revenue / Capital employed

Happy Trading!
The “Stock Trading For A Living” course
Green Chart designed this course to give students a solid foundation in fundamental analysis & stock valuation (Fundamental Analysis), and to show them how to integrate it effectively into their existing trading system, especially for traders who already use technical analysis (Technical Analysis). The program consists of 5 theory sessions and 6 months of hands-on guided trading in the live market with the lecturer.
See full details of the course here.