
Contents of this article
How can investors assess the risk of the stocks they buy or sell? Although risk is hard to build into stock analysis and valuation, one of the most widely used metrics is a risk measure called beta.
Beta (β) measures how volatile a stock is relative to the overall market. By definition, the market, such as the S&P 500 index, has a beta of 1, and individual stocks are ranked by how far they deviate from the market.
A stock that swings more than the market over time has a beta above 1.0. If a stock moves less than the market, its beta is below 1.0. High-beta stocks are considered riskier but offer higher potential returns; low-beta stocks carry less risk but also lower returns.

How to calculate beta
β can be calculated with the following formula:

If β equals 2, then when the VN-INDEX rises 1%, the stock price will rise 2%. The larger β is, the more the stock price swings relative to the VN-INDEX.
Depending on the timeframe you use, you can arrive at different β values. Beta figures are also calculated by brokerage firms and stock information websites.

Beta can also be calculated with another formula based on standard deviation.

What beta tells you
Stock risk can be divided into two main types:
- Systematic risk: risk that affects the market as a whole and every stock in it (e.g. COVID-19, interest rate rises). You cannot avoid this risk, because it affects your entire portfolio.
- Nonsystematic risk: risk specific to a single stock or a group of stocks (e.g. a changing business environment, a company missing its profit target). This is a risk you can protect your portfolio against through hedging.
β measures a stock’s systematic risk, because it measures how sensitive the stock price is to the overall market. That lets you choose stocks that match your risk appetite. Note that β cannot measure nonsystematic risk.
β is not only for individual stocks: you can also calculate beta for your whole portfolio, as the weighted average of the β values of the stocks in it.
Beta = 1
Stocks with a beta of 1 move in line with the market. If the VN-INDEX rises 1%, the stock price also rises 1%. Adding stocks with a beta of 1 therefore adds no extra risk to your portfolio, but it does not raise your expected return either.
The beta of the overall market, usually represented by the VNINDEX, is always 1.
0 < β < 1
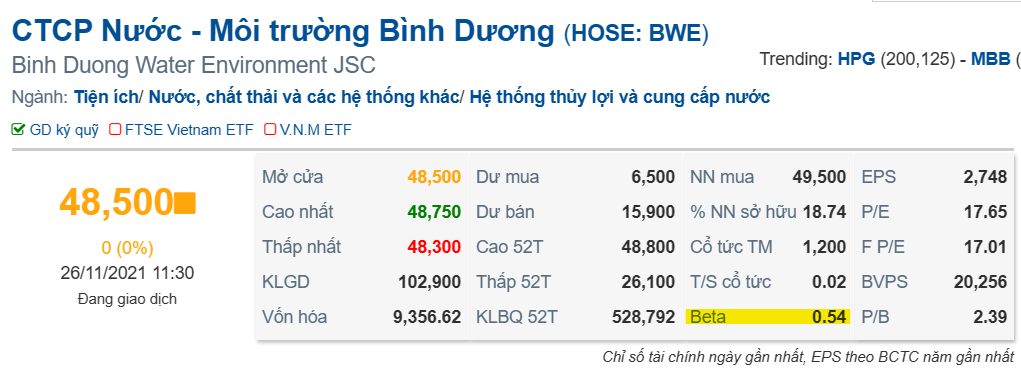
These stocks are less volatile than the market, so they are less risky than the market as a whole, but they also cannot deliver returns well above the benchmark. They are usually defensive stocks, such as healthcare, food and water utility stocks.
Adding these stocks to your portfolio lowers its overall beta and so reduces your risk.
β > 1
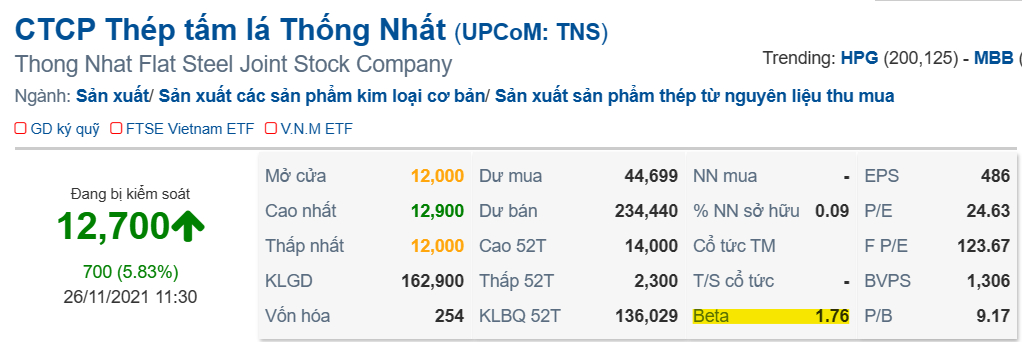
In contrast to the group above, stocks in this group are more volatile than the market, so they are riskier, but they offer higher expected returns. They are usually cyclical and small-cap stocks.
β < 0
A stock with a negative β moves in the opposite direction to the overall market. That is the theory, but in practice it is very hard to find stocks with a negative β.
If we take a broader view, however, quite a few assets have negative betas. Bonds and gold, for example, are safe-haven assets, so they tend to move against the stock market.
The limitations of beta
One assumption behind beta is that stock returns follow a normal distribution. Real financial markets, however, are very unpredictable and do not always follow a normal distribution. So using beta to predict stock price trends is not always accurate.
The concept of risk used in this theory measures an asset’s volatility, quantified by its standard deviation. When investors talk about risk, though, they usually care more about the portfolio’s expected loss than about asset volatility alone. So beta does not capture all of a stock’s risk.
For example, a stock with a low beta, meaning its price is not very volatile, may still be in a slow downtrend. Adding it to your portfolio will lower your portfolio’s standard deviation but will not reduce its expected loss.
Conversely, a high-beta stock may be in a fast uptrend. Adding it to your portfolio may reduce the portfolio’s expected loss, even though it increases the portfolio’s price volatility.
Happy Trading!
The “Stock Trading For A Living” course
Green Chart designed this course to give you a solid grounding in fundamental analysis & stock valuation, and to show you how to integrate it effectively into your existing trading system, especially if you already trade with technical analysis. The programme includes 5 theory sessions and 6 months of hands-on trading guidance in the live market with the lecturer.
Find out more about the course here.