
Contents of this article
Among the many technical indicators available, the Parabolic SAR indicator stands out as a favourite tool of technical analysts. What makes it stand out is its unique calculation and method of analysis, which make it effective at anticipating price movement and generating reliable trading signals. Combined with price action and other indicators, the Parabolic SAR provides more robust trading signals and improves your chances of success.
This guide takes an in-depth look at the Parabolic SAR indicator and presents some compelling trading strategies that use this technical tool.
What is the Parabolic SAR?
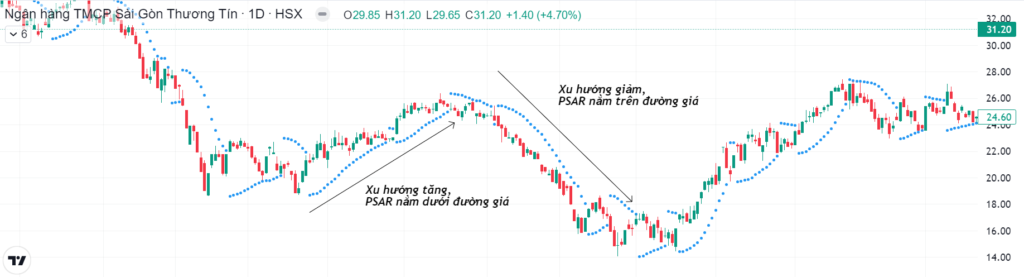
Developed by Welles Wilder (creator of other well-known indicators such as the RSI and ADX) in the late 1970s, the Parabolic SAR, or PSAR for short, is a technical indicator calculated from price and time data. Wilder called it the “Parabolic Time/Price System”. SAR stands for “stop and reverse”. The SAR tracks price as a trend extends over time. The indicator sits below price when prices are rising and above price when they are falling. It stops and reverses when the price trend reverses and breaks through the indicator from above or below.
The Parabolic SAR appears on the price chart as a series of dots above or below an asset’s price, depending on the direction of price movement. The dots are placed below price when it is trending up and above price when it is trending down.
The Parabolic SAR formula
For a rising period (uptrend)
SAR = Prior SAR + AF × (Prior EP – Prior SAR)
For a falling period (downtrend)
SAR = Prior SAR – AF × (Prior SAR – Prior EP)
Where:
EP (Extreme Point): the highest high and lowest low within a trend.
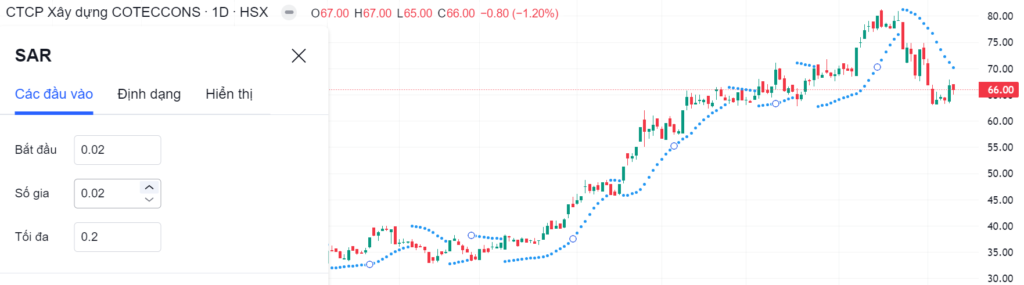
AF (Acceleration Factor): starts at 0.02 and increases by 0.02 each time price makes a new high (in an uptrend) or a new low (in a downtrend). The maximum acceleration factor is 0.2.
The first SAR value is calculated by taking the lowest low of at least five trading sessions if price is in an uptrend. If price is in a downtrend, use the highest high of at least five trading sessions as the initial PSAR value.
What does the Parabolic SAR tell you?
The Parabolic SAR is a trend-following indicator.
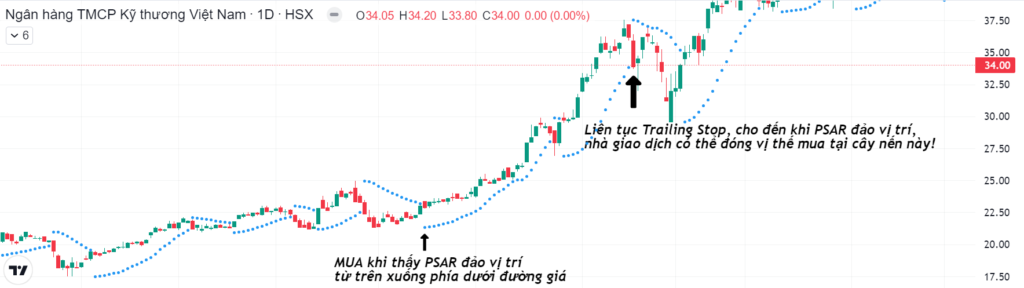
The PSAR generates a buy or sell signal when the dots switch from above price to below price, and vice versa. For example: a buy signal occurs when the dots move from above price to below it, while a sell signal occurs when the dots move from below price to above it.
Traders also use the PSAR dots to move their stop-loss orders (a trailing stop). For example: if price is rising and the PSAR is rising too, traders keep holding their long positions. Once price falls below the PSAR, they close their long positions to take profit.
Keep in mind that the Parabolic SAR is a trend-following indicator, so it works best in trending markets, where large price moves let traders ride the wave and capture significant profits. When the price of a security (or other asset) is confined to a sideways range, the indicator keeps flipping and producing noisy signals, leading to many trades with small profits or even losses.
The PSAR moves whether or not price moves. This means that if price rises at first but then moves sideways, the PSAR keeps rising regardless. A reversal signal will be generated at some point even if price has not fallen; the PSAR only needs to catch up with price to produce a reversal signal. For this reason, a reversal signal on the indicator does not necessarily mean that price is reversing.
The parabolic indicator generates a new signal each time it moves to the opposite side of the asset’s price. This means there is always a position in the market, which makes the indicator attractive to active traders. The indicator works best in trending markets, where large price moves allow traders to capture significant profits. When a security’s price is range-bound, the indicator keeps reversing, leading to many trades with small profits or losses.
For best results, traders use the Parabolic SAR together with other technical indicators, such as momentum and trend-strength indicators like the ADX, RSI or MACD, or moving averages (MA). For example: traders can confirm a PSAR buy signal when the ADX is above 30 and price is above the MA(50) or MA(200).
Adjusting the acceleration factor (AF)
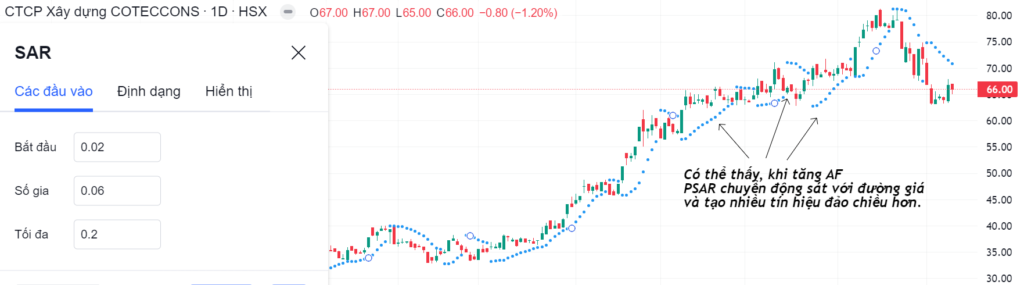
Traders can reduce the sensitivity of the PSAR by lowering the acceleration factor (AF) from its default. A lower AF makes the SAR move further away from price, so reversals happen less often. Likewise, you can increase the SAR’s sensitivity by raising the AF.
Conclusion
By Wilder’s estimate, the Parabolic SAR works best in trending markets, which occur about 30% of the time. This means the indicator tends to whipsaw and produce noisy signals more than 50% of the time, when the market is not trending. Ultimately, the PSAR is designed to catch a trend and follow it like a trailing stop. As with most indicators, signal quality depends on the indicator settings and the characteristics of each traded asset. The right settings combined with the right trend can make an excellent trading system. And of course, there is no golden rule or one-size-fits-all setting. Each asset should be assessed on its own characteristics. Finally, the Parabolic SAR should also be combined with other technical indicators to improve the odds of each trade.
These are the essential basics of the Parabolic SAR that Green Chart wanted to share. We hope this knowledge helps investors achieve better investing and trading results in the time ahead.
Happy trading!
Technical Analysis Course – CMT Level 1
Green Chart designed this course specifically for candidates in Vietnam who want to study and prepare for the CMT Level I exam. The programme includes 27 sessions of theory, practice questions and mock exams. Students also receive the course materials, question bank and mock exams free of charge, and can retake the course for free for life.
See full course details here.