Contents of this article
- What is the Ichimoku indicator?
- Components of the Ichimoku indicator
- Tenkan line (Conversion Line)
- Kijun line (Base Line)
- Chikou line (Lagging Span)
- Senkou Span A and Senkou Span B
- Key points about the Kumo cloud
- Trading strategies with Ichimoku
- Tenkan/Kijun cross
- Price crossing the Kijun line
- Kumo cloud breakout
- Senkou Span A & Senkou Span B cross
- Price crossing the Chikou Span
- Advanced applications of the Ichimoku indicator
- Ichimoku Kinko Hyo – a one-glance equilibrium chart
- A 4-step guide to reading a chart quickly with Ichimoku
- Technical Analysis Course – CMT Level 1
Technical analysis has always played an important role in identifying and studying the likely future trends of stock and other asset prices. The choice of technical indicators is highly personal and depends a great deal on each trader’s preferences. Personally, I tend to favour simple indicators with few components to calculate. However, among the more complex indicators in technical analysis, there is one set I am particularly fond of, both for its effectiveness and for the Eastern “philosophy” it embodies – the Ichimoku indicator.
What is the Ichimoku indicator?
Ichimoku Kinko Hyo is a charting technique invented by a Japanese newspaper journalist writing under the pen name “Ichimoku Sanjin”, which in Japanese means “a man looking from the mountain”. It is a versatile and remarkably comprehensive indicator used to identify support and resistance levels, determine the trend, measure the trend’s momentum and generate trading signals. “Ichimoku” means “one glance”, “Kinko” means “equilibrium” between price and time, and “Hyo” is Japanese for “chart”. Ichimoku Kinko Hyo can therefore be translated as “a one-glance equilibrium chart of price and time”. That is why technical analysts who understand Ichimoku can identify the trend and spot potential trading opportunities within it at a single glance. Although the Ichimoku indicator looks complicated on a price chart, it is actually fairly simple, with easy-to-understand concepts and clearly defined trading signals.

The author of the method was named Goichi Hosoda, who developed the system before the Second World War. After 20 years of research, Hosoda published a book on Ichimoku in 1969. However, the original Ichimoku books and documents have never been translated into English and nobody has been able to find the original edition; rumour has it that the book is kept hidden inside the Bank of Japan.
Components of the Ichimoku indicator
The Ichimoku indicator consists of five main components:

Tenkan line (Conversion Line)
Tenkan line formula:
Tenkan line (Conversion Line) = (Highest high over 9 sessions + Lowest low over 9 sessions)/2
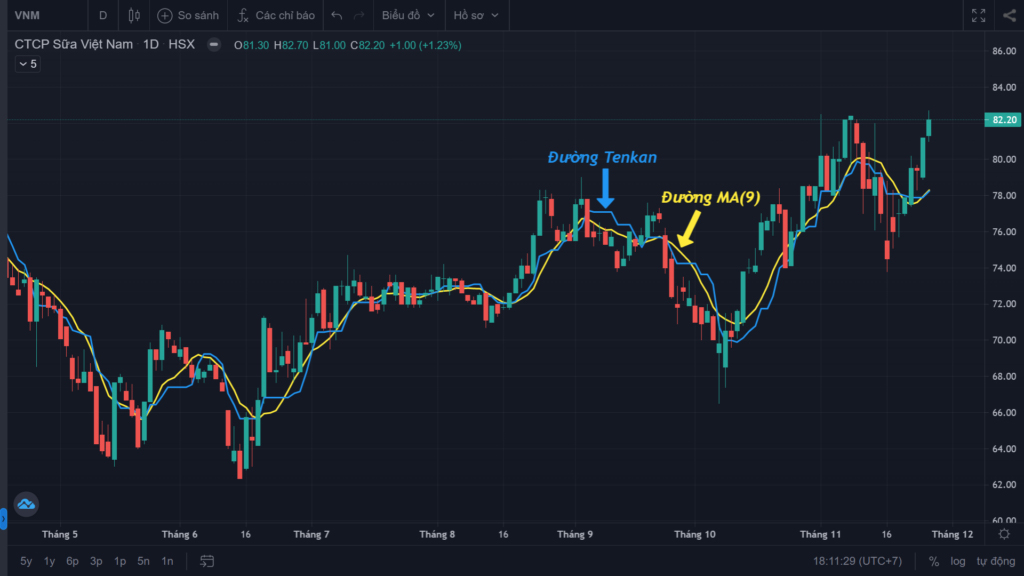
Because the Tenkan line’s values sit quite close to the 9-period moving average, the Tenkan line moves in the same direction as price, which is why it is also called the signal line. The purpose of this signal line is to filter out noise in the price line.
So if price and the Tenkan line are close together, the current trend is progressing slowly with little noise. When price runs too far from the Tenkan line, it warns of a strong pullback or a reversal, especially if price then touches the Kijun line.
What the Tenkan line tells you
Identifying the price trend:
- The trend is up when price is above the Tenkan line.
- The trend is down when price is below the Tenkan line.
- The current trend is sideways when the Tenkan line is flat, which also warns that price may reverse soon.
While a trend is in progress, if price crosses the Tenkan line against the trend, three scenarios can follow:
- A small, short-term pullback: price crosses the Tenkan line but does not cross the Kijun line => the original trend will quickly resume.
- A strong pullback: price crosses both the Tenkan and Kijun lines against the trend, then the trend resumes.
- A trend reversal: similar to the strong pullback scenario, but price does not resume the trend. Price will drift sideways or form a new trend.
Kijun line (Base Line)
This is considered the most important of the five lines, and it is regarded as the equilibrium line.
Kijun line formula:
Kijun line (Base Line) = (Highest high over 26 sessions + Lowest low over 26 sessions)/2
The Kijun line also moves in the direction of the trend. The steeper the slope, the stronger the trend. However, because the Kijun line is calculated over 26 sessions, instead of hugging price as the Tenkan does, price has to travel a relatively long way to affect the Kijun line.

Put simply, if the Tenkan line represents the short-term trend, the Kijun line usually reflects the medium-term trend.
The Kijun line acts as an important support/resistance line (equivalent to the 50% Fibonacci level).
When price crosses the Kijun line, the price trend may change. Neither a strong pullback nor a reversal can occur until price has crossed the Kijun line.
When price crosses the Kijun line, the same three scenarios apply as when price crosses the Tenkan line. A general note:
When the Tenkan line is above the Kijun line, it signals an uptrend. Conversely, when the Tenkan line is below the Kijun line, it is a sign of a downtrend.
Chikou line (Lagging Span)
The Chikou line has a 26-session period and represents the inertia, or momentum, of price. It is also called the lagging line because it plots the current price shifted back 26 sessions.

What the Chikou line tells you
The Chikou line helps identify three main trends:
- Bullish: if the Chikou line is above the price line of 26 sessions earlier.
- Bearish: if the Chikou line is below the price line of 26 sessions earlier.
- Sideways: if the Chikou line is very close to the price line of 26 sessions earlier.
In addition, the peaks and troughs of the Chikou line are all strong support and resistance levels.
Senkou Span A and Senkou Span B
The last two components of the Ichimoku indicator are Senkou Span A and Senkou Span B. These two lines are quite different from the rest of Ichimoku.
Lines A and B together form a cloud called the Kumo. The cloud is the area between Senkou Span A and Senkou Span B. When Senkou Span A is above Senkou Span B, the cloud is shown in a different colour from when Senkou Span A is below Senkou Span B.
Senkou Span A formula:
(Tenkan line value + Kijun line value)/2, plotted 26 sessions ahead
When observing Senkou Span A, you need to watch two things: its current section and its future section. The current section is the average of the Tenkan and Kijun lines from 26 sessions earlier. The future section is the average of the current Tenkan and Kijun lines. In this way, current price movement affects the future. The peaks and troughs of Senkou Span A are strong support and resistance levels.
Senkou Span B formula:
(Highest high over 52 sessions + Lowest low over 52 sessions)/2, plotted 26 sessions ahead.
Senkou Span B also has two sections like Senkou Span A, but it is stronger because it uses more historical data.

What the Senkou Spans tell you
Like the Kijun line, Senkou Span B is very often flat and exerts a very strong pull. When this happens, take advantage of it for short-term trades (targeting profit at the flat Senkou Span B ahead).
When this happens, price tends to be pulled back towards the cloud. And when Senkou Span B is flat, it creates a very strong barrier. A breakout through this barrier is very difficult.
Breaking this barrier requires a very large force, that is, one or more long, very large candles. Unlike a breakout session (where price runs in the new trend direction), when price breaks a flat Senkou Span B it gets pulled back (or retests it once more). So what does this mean?
First, when you see a flat Senkou Span B, you know price will soon be pulled towards the cloud, and you can anticipate whether price will break through the cloud by looking at the candles and the price action.
- If the candle is small, it will almost certainly be stopped by the cloud and bounce off to continue the prior trend.
- If the candle is large, it may break through the cloud (signalling a big move ahead), but it will not necessarily reverse into a new trend; instead it may pull back because of the attraction of the flat Senkou Span B.
Second, do not enter a trade when you see price break the cloud where Senkou Span B is flat, as in the Kumo Breakout strategy, because it is very risky. Instead, wait for the retest, that is, for price to be pulled back, and assess the market before trading. As in the chart above, price reacts to the very strong pull of the flat Senkou Span B: it is pulled in, bounces up, is pulled down again, then rises again.
There are two main types of cloud:
- The Kumo cloud: the cloud above or below the price line.
- The future cloud: the cloud plotted in the 26 sessions ahead of the price line.
The Kumo cloud is formed by Senkou Span A and Senkou Span B, and it is extremely useful in Ichimoku analysis.
Key points about the Kumo cloud
Based on the colour of the cloud and the cloud ahead, we can anticipate the trend and how the market is likely to move.
Current trend:
- Bullish: price is above the Kumo cloud.
- Bearish: price is below the Kumo cloud.
- Sideways: price is inside the Kumo cloud.
Future trend:
- Bullish: Senkou Span A is above Senkou Span B.
- Bearish: Senkou Span A is below Senkou Span B.
- Sideways: Senkou Span A equals Senkou Span B.
The strength of the future Kumo cloud is determined by the future Senkou Span A and the future Senkou Span B. The following scenarios can occur:
- Strongly bullish: the future Kumo cloud is rising and both the future Senkou Span A and the future Senkou Span B are pointing up.
- Moderately bullish: the future Kumo cloud is rising, the future Senkou Span A is pointing up and the future Senkou Span B is flat.
- Weakly bullish: the future Kumo cloud is rising, the future Senkou Span A is pointing down and the future Senkou Span B is flat. At this point a strong pullback or a reversal may occur.
- Strongly bearish: the future Kumo cloud is falling and both the future Senkou Span A and the future Senkou Span B are pointing down.
- Moderately bearish: the future Kumo cloud is falling, the future Senkou Span A is pointing down and the future Senkou Span B is flat.
- Weakly bearish: the future Kumo cloud is falling, the future Senkou Span A is pointing up and the future Senkou Span B is flat. At this point a strong pullback or a reversal may occur.
In essence, the cloud is a visible reflection of market sentiment:
- A thick cloud shows that market sentiment and crowd psychology are very stable; breaking through it requires very heavy buying or selling pressure.
- Conversely, a thin cloud reflects weak, changeable market sentiment.
- When price moves too far from the cloud, it usually tends to pull back towards the cloud to rebalance, much as it does with a moving average.
Trading strategies with Ichimoku
Tenkan/Kijun cross

This is the traditional strategy in the Ichimoku system. The signal occurs when the Tenkan line crosses the Kijun line.
- If the Tenkan line crosses above the Kijun line => bullish signal.
- If the Tenkan line crosses below the Kijun line => bearish signal.
The Tenkan/Kijun cross strategy can be further divided into three main types:
STRONG Tenkan/Kijun signal
- BUY when the Tenkan line crosses above the Kijun line above the Kumo cloud.
- SELL when the Tenkan line crosses below the Kijun line below the Kumo cloud.
MODERATE Tenkan/Kijun signal
- BUY when the Tenkan line crosses above the Kijun line inside the Kumo cloud.
- SELL when the Tenkan line crosses below the Kijun line inside the Kumo cloud.
WEAK Tenkan/Kijun signal
- BUY when the Tenkan line crosses above the Kijun line below the Kumo cloud.
- SELL when the Tenkan line crosses below the Kijun line above the Kumo cloud.
We can also use the Chikou line to confirm the trend in any Ichimoku strategy. Tenkan/Kijun crosses can be classified further based on the relationship between the Chikou line and price at the time of the cross.
- If the cross is a BUY and the Chikou line is above the price line, the BUY signal is stronger.
- If the cross is a SELL and the Chikou line is below the price line, the SELL signal is stronger.
- If the position of the Chikou line does not agree with the Tenkan/Kijun cross signal, the signal is weaker.
Price crossing the Kijun line

This strategy is relatively strong and reliable. It can be used on any timeframe (1 hour, 4 hours, 1 day…), but the shorter the timeframe, the less reliable the signal. The entry signal appears when price crosses the Kijun line.
- If price crosses the Kijun line from below => bullish signal.
- If price crosses the Kijun line from above => bearish signal.
The price/Kijun cross strategy can be further divided into three main types:
STRONG price/Kijun cross signal:
- BUY when price crosses the Kijun line above the Kumo cloud
- SELL when price crosses the Kijun line below the Kumo cloud
MODERATE price/Kijun cross signal:
- BUY when price crosses the Kijun line inside the Kumo cloud
- SELL when price crosses the Kijun line inside the Kumo cloud
WEAK price/Kijun cross signal:
- BUY when price crosses the Kijun line below the Kumo cloud
- SELL when price crosses the Kijun line above the Kumo cloud
You can consider the Chikou line to increase reliability, in the same way as for the Tenkan/Kijun cross strategy.
Kumo cloud breakout
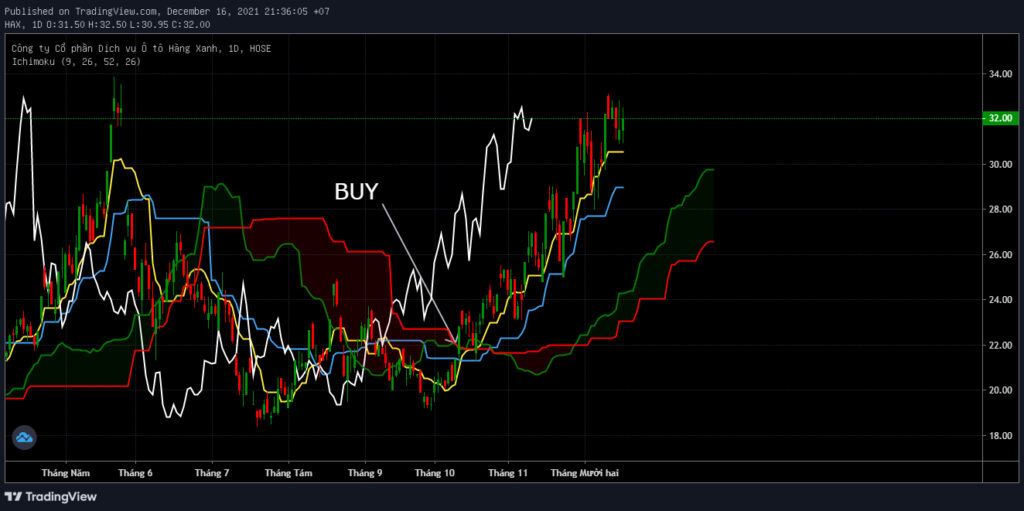
This is the purest trend-following strategy in the Ichimoku system, because it uses only the Kumo cloud and its relationship with price to generate signals.
- BUY when price closes above the cloud
- SELL when price closes below the cloud.
You can combine this with the direction of the Kumo cloud to confirm the signal.
- If the Kumo cloud is trending up and price is above the cloud, it is a strong BUY signal.
- If the Kumo cloud is trending down and price is below the cloud, it is a strong SELL signal.
- If the direction of the Kumo cloud contradicts price’s position relative to the cloud, wait until the cloud agrees with price before entering.
Senkou Span A & Senkou Span B cross
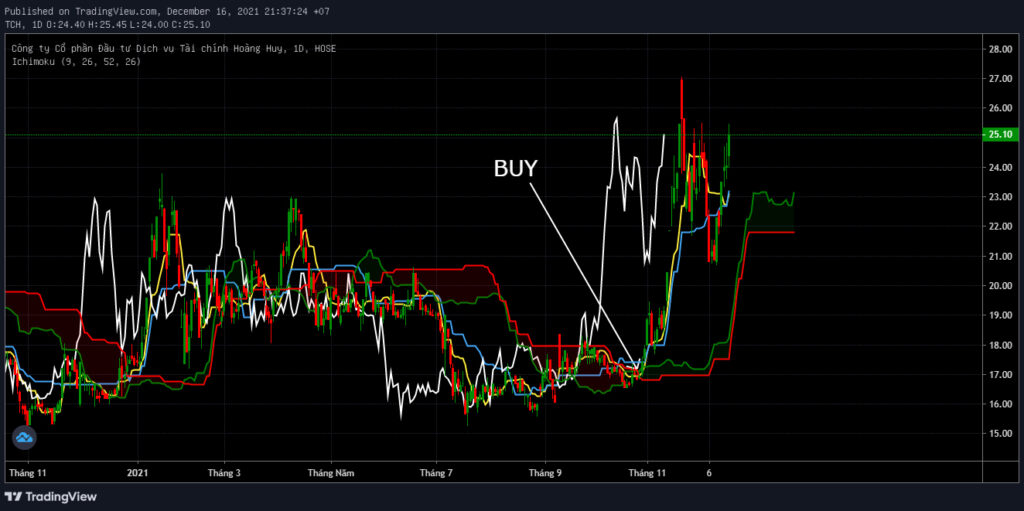
Compared with the Kumo breakout strategy above, this strategy is less commonly used in the Ichimoku system. It is usually used as confirmation alongside other strategies rather than on its own.
- BUY when Senkou Span A crosses above Senkou Span B.
- SELL when Senkou Span A crosses below Senkou Span B.
Note: this signal appears 26 sessions ahead of price, because Senkou Span A and Senkou Span B are plotted 26 sessions forward.
The cross signal can be divided into three main types: strong, moderate and weak.
Price crossing the Chikou Span
This is another strategy that is rarely traded in the Ichimoku system. It is mainly used as confirmation before entering a trade.
- If the Chikou line crosses above the price line, it is a bullish sign
- If the Chikou line crosses below the price line, it is a bearish sign
As with other technical indicators, Ichimoku should not be applied too mechanically; you also need to assess the stock’s fundamental potential. Technical indicators only help investors identify good entry points for a stock; they cannot replace the role of fundamental analysis in stock selection.
Advanced applications of the Ichimoku indicator
Having covered the basics of Ichimoku and a basic Ichimoku trading strategy, we now move to a more advanced section. To understand this indicator more deeply, we need to understand its history as well as Hosoda’s meaning and methodology.
Ichimoku Kinko Hyo – a one-glance equilibrium chart
Many people who do not understand Ichimoku see it as no different from moving averages and other indicators. In fact, with a deep understanding of Ichimoku, you can see that it is a fairly “comprehensive” tool: it can tell us the trend, identify resistance, entry points and exit points, and, more unusually, Ichimoku is an indicator that can anticipate the future. The proof is the “future cloud”, which is calculated 26 days ahead. Unlike most other indicators, which change alongside price, Ichimoku’s “future cloud” is genuinely calculated in advance and does not repaint when price changes.
With the Chikou line shifted 26 days into the past relative to price, the Tenkan and Kijun lines running around price, and the “future cloud” projected 26 days into the future, the Ichimoku indicator gives us a view of the Past, the Present and the Future. That is why Ichimoku is called a “comprehensive” indicator.
The name Ichimoku Kinko Hyo, translated as “a one-glance equilibrium chart”, itself describes how the indicator is built. Look closely and you will see that the Ichimoku chart is very “balanced”. Every Ichimoku line is built from the highest and lowest prices. In other words, it only cares about the highest and lowest prices within a given period – the upper bound (highest) and the lower bound (lowest). This creates an “equilibrium zone” in which the cloud is the centre between the upper and lower bounds, because the cloud is formed by Senkou Span A and Senkou Span B (both of which are also calculated from the highest and lowest prices).

So, looking at the chart above, we can see price oscillating up and down around the equilibrium zone. A break of either bound forms a new equilibrium zone, that is, a new cloud. In the chart above, the highest candle broke the upper bound. This shows that the equilibrium zone has changed and shifted upwards – the green cloud now appears ahead. It will quickly pull price back towards equilibrium, that is, towards the cloud. “Price too far away” means price has exceeded the highest or lowest bound of the previous period.
In particular, notice that the Kijun and Senkou B lines are very often flat. This happens because both are calculated from the highest and lowest prices. When it happens, it means an “equilibrium zone” has formed that creates a “pull” on price that has moved too far away from it. Price that has moved too far will usually tend to go sideways and return to the equilibrium zone. In a strong trend, this “equilibrium zone” rarely appears, so when one appears, the trend is weakening and turning sideways. Once you understand the essence of Ichimoku, you can glance at the chart and immediately identify its equilibrium point, just as the name Mr. Hosoda gave it suggests.
A 4-step guide to reading a chart quickly with Ichimoku
Step 1: Look at the future first by looking at the Kumo cloud and identifying the equilibrium zone.
Step 2: Look at the present by looking at the Tenkan and Kijun lines and the upper and lower bounds of price.
Step 3: Look at the past by looking at the Chikou line.
Step 4: Return to the current price and make a forecast.
Technical Analysis Course – CMT Level 1
Green Chart designed this course specifically for candidates in Vietnam who want to study and prepare for the CMT Level I exam. The programme includes 27 sessions of theory, practice questions and mock exams. Students also receive the course textbook, question bank and mock exams free of charge for their exam preparation, and can retake the course for free for life.
See more details about the course here.
Happy trading !