
Contents of this article
In this post I focus on analysing event-driven strategies, drawing on several strategies used by hedge funds, to understand what they are and whether they can be applied in Vietnam.
Objectives of this post:
- What is event-driven investing? What are its main types? How do traders exploit it?
- Assess the impact of event-driven strategies in Vietnam.
- Find alpha from the best strategies, possibly combined with suitable strategies for more flexibility.
Conclusion:
- There are alpha signals for an (extremely passive) event-driven strategy that arbitrages some fairly common information, such as cash dividends, insider buying and share issuance. The results are quite good for the test period from 1 January 2024 to date.
- Bias sectors (08/18): OnG (oil and gas), Hospitality, Healthcare, Automobiles, IT (information technology), Retail, FnB (food and beverage) and Industrial.
- Maximum holding period: 10 days
- Portfolio type: equal weights across the current signals.
Notes:
- This post is purely my personal view and analysis, based on my limited knowledge, so it is somewhat subjective. I would very much welcome everyone’s feedback!
- The writing style is close to everyday speech, not very academic, and sometimes mixes in English terms; I hope readers will bear with this.
- The data is accessed and calculated from the vnstocks library (http://vnstocks.com) and yfinance.
- The post relies on a limited number of mainstream references, so it does not cover everything else (including the non-mainstream =]]).
- Event dates are counted from the announcement date, except insider trades, which are counted from the trade date.
EVENT DRIVEN STRATEGIES
Event-driven trading is a strategy in which hedge funds or investors exploit price movements caused by corporate or market events. These events typically include (M&A, bankruptcy, restructuring, spin-offs, policy changes). Such events often create information asymmetry and prices that do not yet fully reflect them, leading to profit opportunities.
Hedge funds’ event-driven strategies
Drawing on several sources (the CAIA curriculum and the book Investment Banks, Hedge Funds and Private Equity), I can summarise event-driven strategies as follows:
- Merger Arbitrage (Risk Arbitrage)
- How it works: Long the target’s stock, short the acquirer’s stock (in a stock-for-stock deal).
- Source of profit: The spread between the post-announcement market price and the offer price.
- Risks: Regulatory risk (antitrust, the government blocking the deal), financing risk (the acquirer fails to raise the capital).
- Return profile: Average 5.1% per year, Sharpe ~0.6, low volatility (4%), negatively skewed (CAIA calculates this purely from the S&P 500, not Vietnam, and these are only historical data).
- Activist Investing
- How it works: Buy a stake (1–10%) and pressure the board/CEO to make changes: cut costs, increase buybacks, pay higher dividends, change the capital structure, or spin off a business.
- Tactics: Proxy battles, wolf packs, capital structure pressure, board representation. It gets quite convoluted; specifically:
- Proxy battle, or using “money” to overpower people: this simply uses a majority of votes to force the vote (why a majority? Because they have the money). It is the most forceful method, expressing the will of whoever has the money (=]]), ready to confront the target company’s board head-on.
- Wolf pack, or overpowering by sheer numbers (as I see it). The hedge fund calls on several other funds or partners to target the same company, putting simultaneous pressure on the target and creating a knock-on effect.
- Capital Structure Pressure (to me, a stick without the carrot): as an activist, the fund uses various arguments to force the company to change or restructure its finances to be more efficient. This may mean increasing or reducing borrowing (depending on the optimal structure), or demanding the sale of unproductive assets (selling off land, factories… =]]).
- Board Representation (also known as stepping into the open =]]): here the activist intervenes directly through the presence and management of a representative appointed to the board. In fact, this also depends on the representative’s capital stake and voting rights; essentially, it is a derivative of the proxy battle.
- Source of profit: Alpha from better governance and unlocking hidden value.
- Return profile: Below the market, return ~3.9% but very volatile (14.3%), Sharpe ~0.1, negatively skewed.
- Distressed Securities (Distressed Debt Funds)
- How it works: Buy the debt of companies close to default at a deep discount; recover value through restructuring or conversion into equity. The equity can be shorted, much like writing a naked call option.
- Sub-strategy: Capital structure arbitrage (long senior secured debt, short junior debt).
- Source of profit: Mispricing because few investors are permitted to hold distressed debt (regulatory constraints).
- Return profile: Return ~6.9% per year, volatility ~6.5%, Sharpe ~0.7, negatively skewed.
- Special Situations
- How it works: Invest in spin-offs, split-offs, recapitalisations, restructurings and litigation outcomes.
- Example: A company spins off a business line, creating value through revaluation; or it restructures its capital through buybacks or a recapitalisation.
- Source of profit: The market misprices the assets/legal form after the event.
- Characteristics: Often combined within multi-strategy funds, helping to diversify when M&A activity falls but defaults rise.
- Zero Events
- Here the hedge fund acts as the one who sets up the “game” (=]]). The game is not stock manipulation, but takes the following forms:
- Litigation/Lawsuit: Simply sue the company or get it sued (or inspected :))). This creates a surprise for the market, in the expectation of a market shock.
- Public Campaigns & Media Shocks: In this strategy the activist focuses heavily on PR and the press to keep up continuous pressure around investor relations (IR). The impact of this strategy needs further clarification.
- Here the hedge fund acts as the one who sets up the “game” (=]]). The game is not stock manipulation, but takes the following forms:
So hedge funds play a very active role in setting investment strategy and intervening directly in the factors that create alpha. But if the hedge fund is a quant fund, or purely a trading operation, are there other strategies? There are, in the following ways:
- Earning surprise & guidance events
- Tactic: identify companies’ earnings announcement dates and trade around them.
- Assessment method: mostly qualitative assessments (based on guidance from the board or its representatives), assessing the outlook from the company’s business results qualitatively and feeding it into valuation expectations quantitatively (quantitative assessments). Why qualitative when there are clearly numbers going into the models? Subjectively, I think it depends on the valuer’s judgement and uses many subjective expectations. Even though the main parameter is the company’s annual plan, it is still very subjective!!!
- Expected return: comes from systematic changes in expectations of intrinsic value.
- Corporate actions
- Tactic: based on corporate events such as dividends (in shares or cash) and news of additional or new share issuance.
- Main expected return: mostly arbitrage.
- Merger Arbitrage: this has already been covered above.
- Credit events:
- Tactic: based on news of changes in the company’s credit rating or debt quality.
- Main expected return: expected systematic changes in intrinsic value.
- Macro events
- Tactic: trade on news of changes in macro factors (which are very hard to quantify).
- Main expected return: changes in systematic risk, and trading them.
- Insider actions:
- Tactic: follow information on insider trades.
- Main expected return: arbitrage.
FINDING ALPHA
Alpha Research
Many studies have assessed the impact of these events, and the answer is usually, of course, that there is one (=]]). But what about actually finding alpha – and if they really are alpha factors, what would the strategies and their specific rules look like? Naturally, I could not find any research in Vietnam that fully answers this question! (Or I have not searched enough, or people have not published it.)
This time I will try to find alpha from the following specific events:
- Corporate actions: dividends, additional issuance, new issuance.
- Insider trading: insiders’ purchases and sales.
I observed the stocks in the VNALLSHARES basket (actually two stocks are missing because their data would not download :))) from 2013 to 2024 (I use the period from 2024 onwards for testing). Looking only at these two groups of events, I have about 12,769 events, as follows:
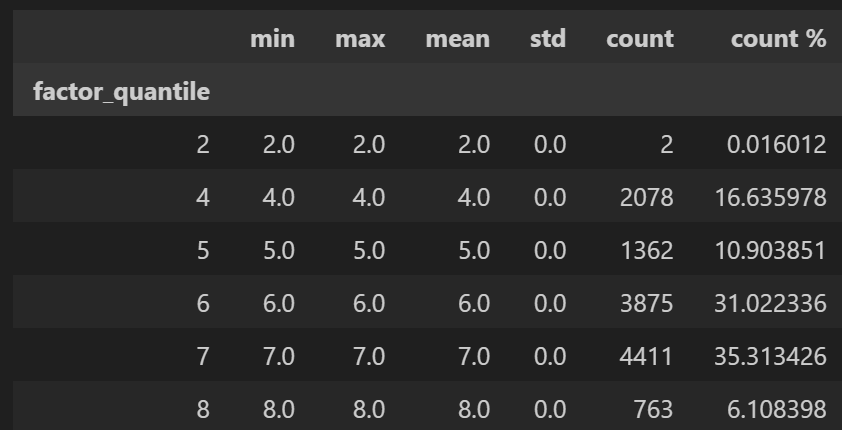
Where:
- Group 2: receiving bonus or gifted shares
- Group 4: receiving cash dividends
- Group 5: additional listing
- Group 6: insider buying
- Group 7: insider selling
- Group 8: share issuance
Among the groups observed, groups 6 and 7 make up the largest share, while group 2 has only two events (=]]). There are many reasons for this, but I will avoid drawing conclusions about group 2 because it has the least statistical value.
Looking at the returns from holding the stock after these events (counted from the event date) over the next 1 to 20 days (at 1, 3, 5, 10 and 20 days), I get the following figure:
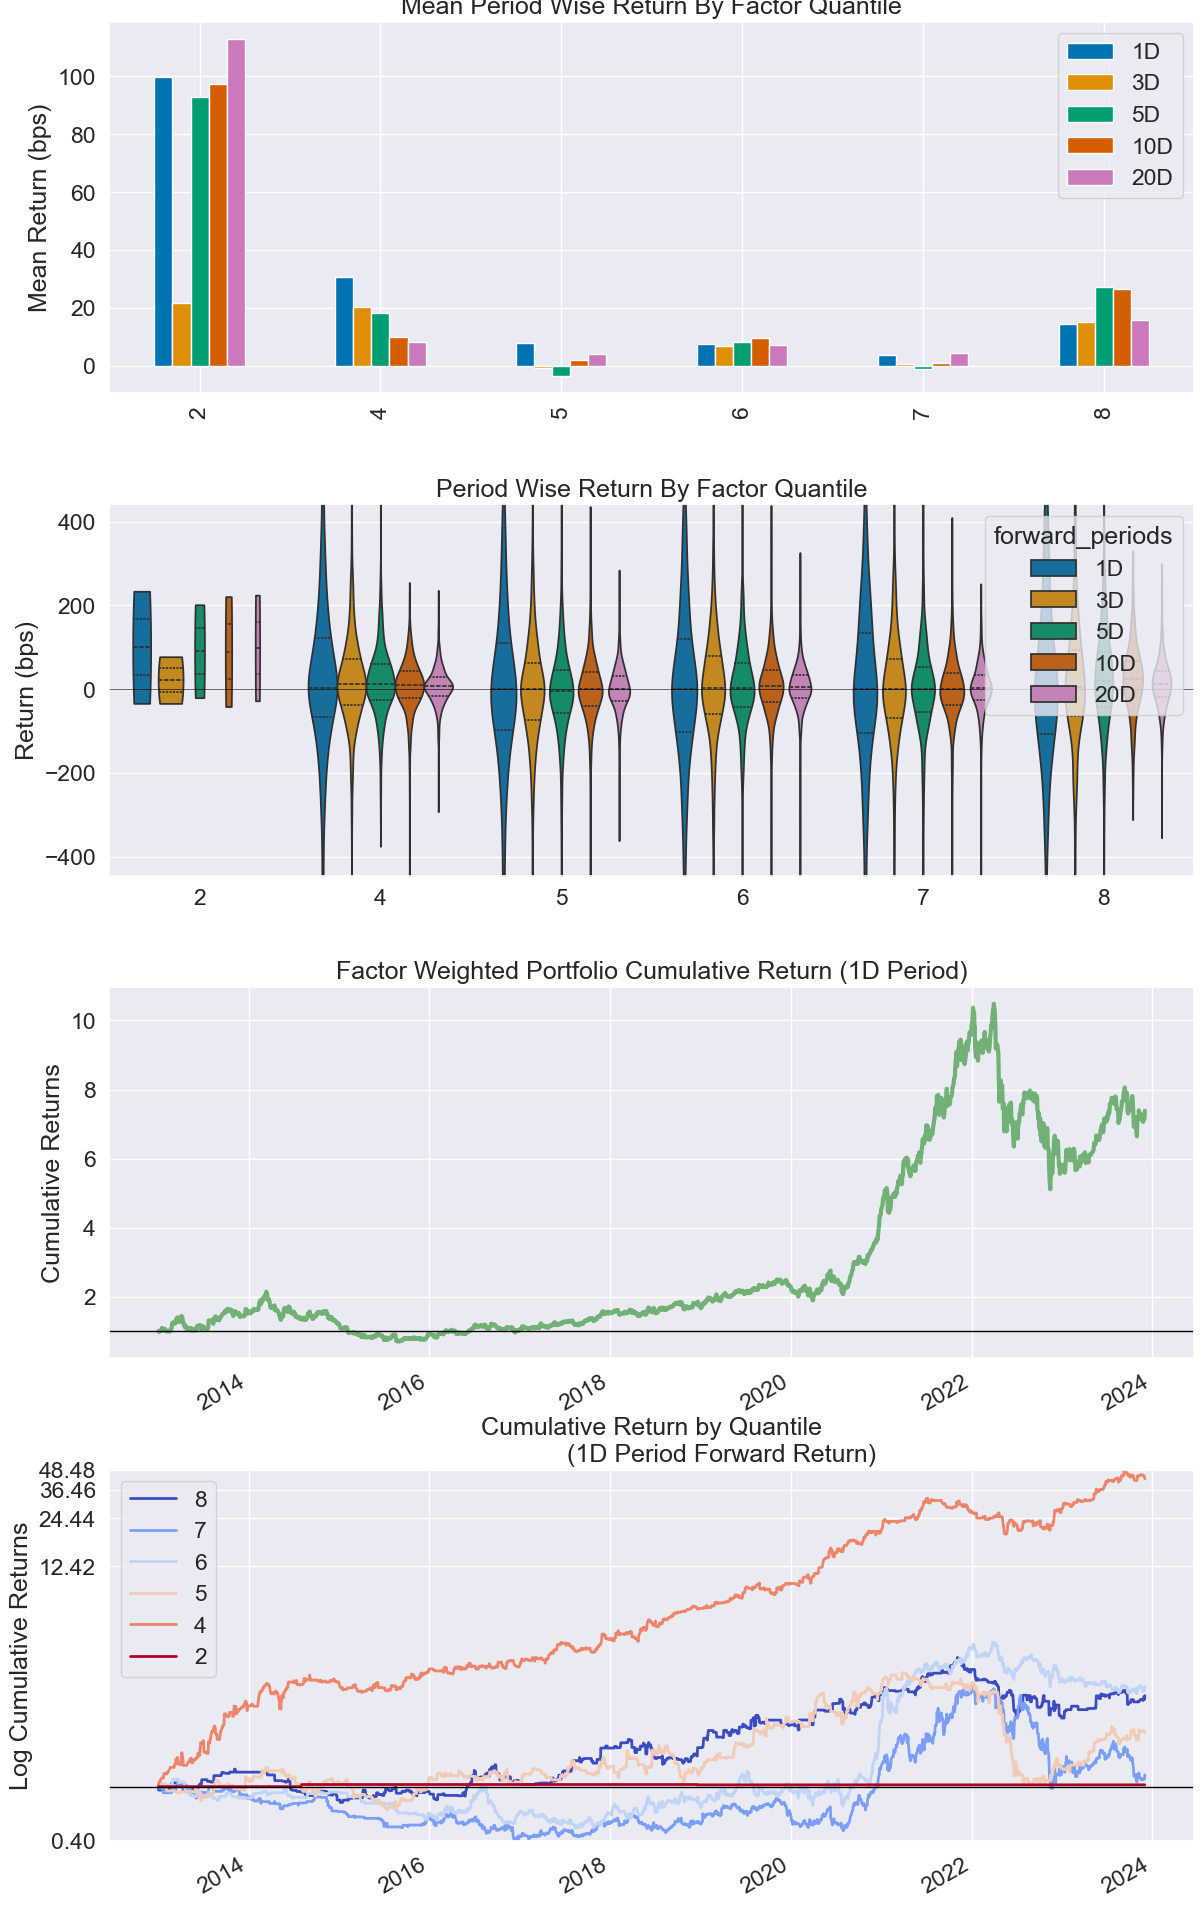
The returns in the table above are cross-sectional returns when an event occurs. More specifically, if several events occur at the same time – for example, two stocks pay dividends on the same day – the portfolio is reweighted with equal weights.
Looking at the returns from trading for one day, groups 4 (cash dividends) and 8 (share issuance) have outstanding returns; group 5 (additional listing) had fairly good returns up to 2020 but got much worse from 2021 onwards; and group 6 (insider buying) also performs reasonably well. However, the Vietnamese market does not allow T+1 trading, so these values are only a first look. Moving on to the other windows:
- Excluding group 2, the average returns of groups 4 and 8 are also the highest. However, group 4 declines across the longer windows, peaking at a 1-day holding period. Group 8 is more stable, rising up to a 10-day holding period (its peak) and declining after that.
- The groups’ histograms also show that most values are centred around a move of 0 bps, with fairly fat tails in the return distribution.
—> So, based on this, I can judge subjectively that we should focus only on events in groups 4, 6 and 8.
Digging into each sector (18 sectors), and once again analysing with the Information Coefficient (which I used in my first post on market breadth), I get the following results:
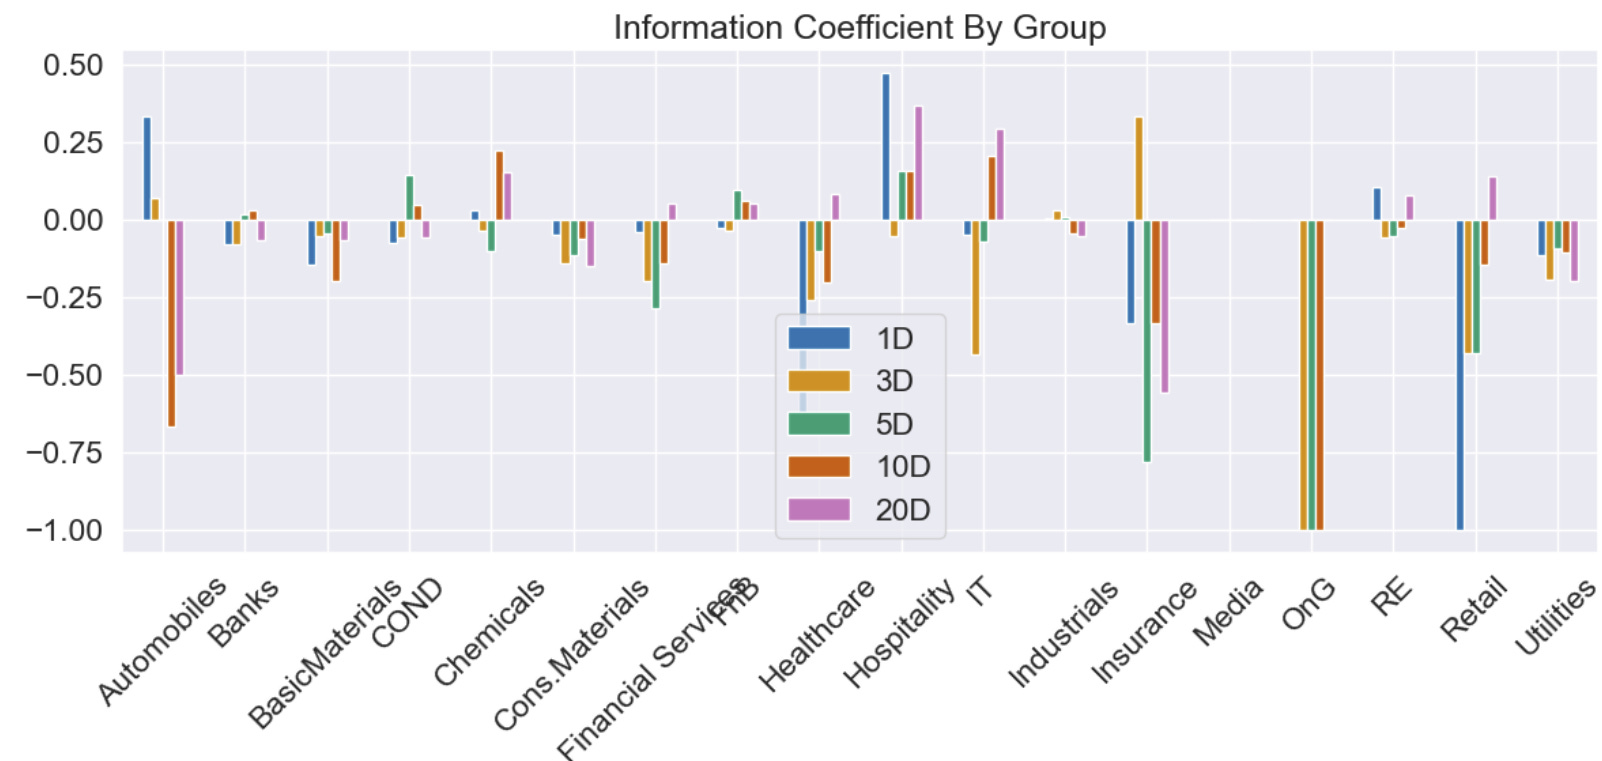
The IC explains the relationship between the factor I am analysing and stock returns; in essence it is a Spearman correlation. Both positive and negative IC have trading meaning: a high positive IC means we expect price to rise when the factor appears, and a large negative IC means we expect to sell or exit when the factor appears. So alpha is absent, or weak, only when IC is closest to 0.
If we trade on all these events across all the sectors observed (from VNALLSHARES), only some sectors (8/18) show a strong effect: OnG (oil and gas), Hospitality, Healthcare, Automobiles, IT (information technology), Retail, FnB and Industrial. The sectors usually considered “core” or “key” in the VN-Index, such as financials and real estate, do not seem to perform well (perhaps because they are large-cap with many blue chips, so they have already been heavily arbitraged?).
Taking out Banks and RE (real estate), I get these results:
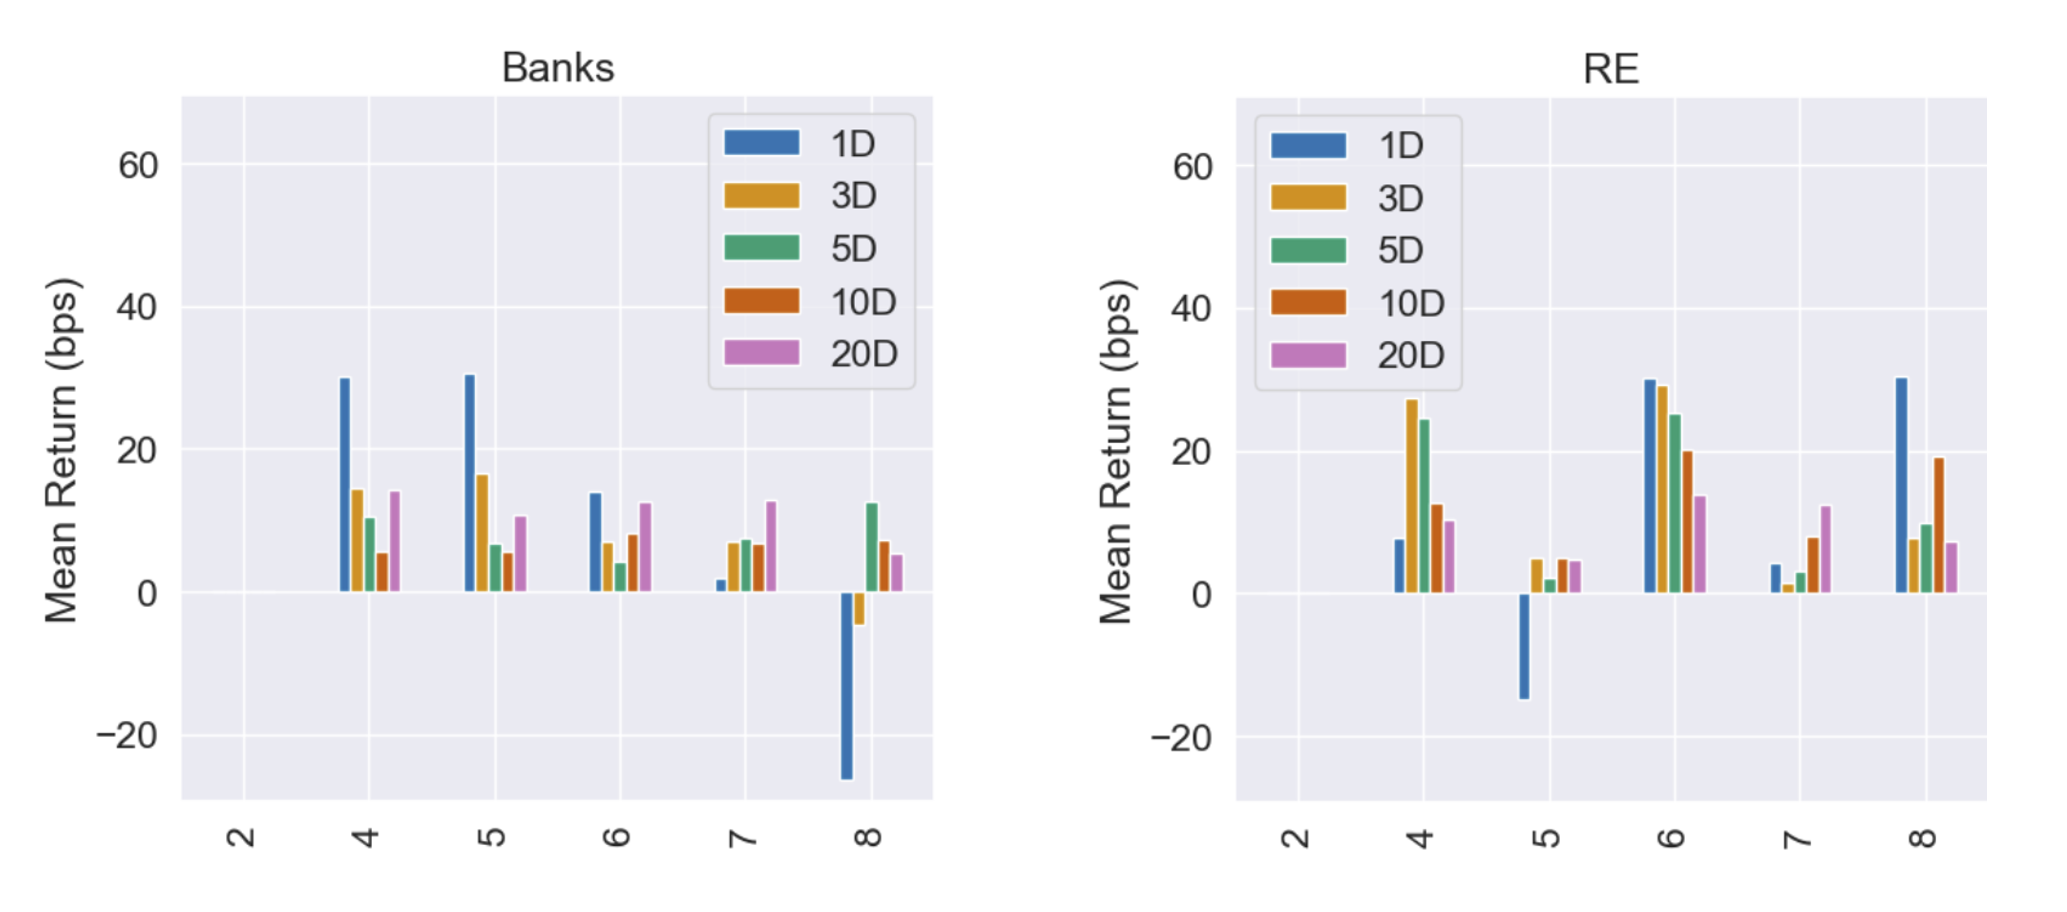
Looking only at events in groups 4, 6 and 8, both sectors give fairly similar results: the longer the holding period (after the event), the lower the average return, which is highest only on the first day after the news. For event 8 (share issuance), the Banks group even falls sharply (perhaps a case of “sell on the fact” =]]). So these two sectors should not be included in an event-driven portfolio.
Based on these observations, I will build a long-only portfolio that trades only the sectors above when events with strong alpha occur, namely events in groups 4, 8 and 6. The next question is: when do we rebalance?
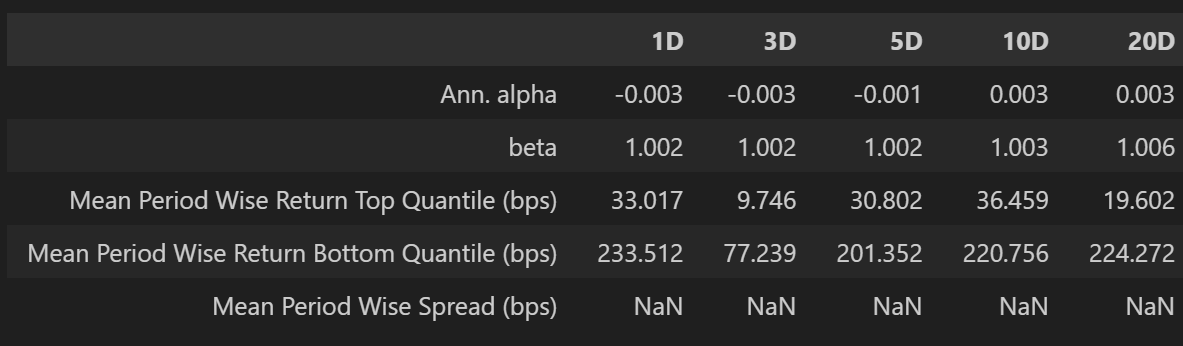
Once again I look at historical data, but filter for only the 8 sectors we care about. A 10-day holding period gives a positive alpha and the lowest beta, which seems acceptable, so I will set a maximum holding period of 10 days for any stock with a trading signal.
To summarise, our trading rules are:
- Alpha signals: stocks with news of cash dividends, share issuance, or insider buying.
- Bias sectors (8/18): OnG (oil and gas), Hospitality, Healthcare, Automobiles, IT (information technology), Retail, FnB and Industrial.
- Maximum holding period: 10 days
Naive Backtest
With the trading rules in place, I test my portfolio naively, with the following results:
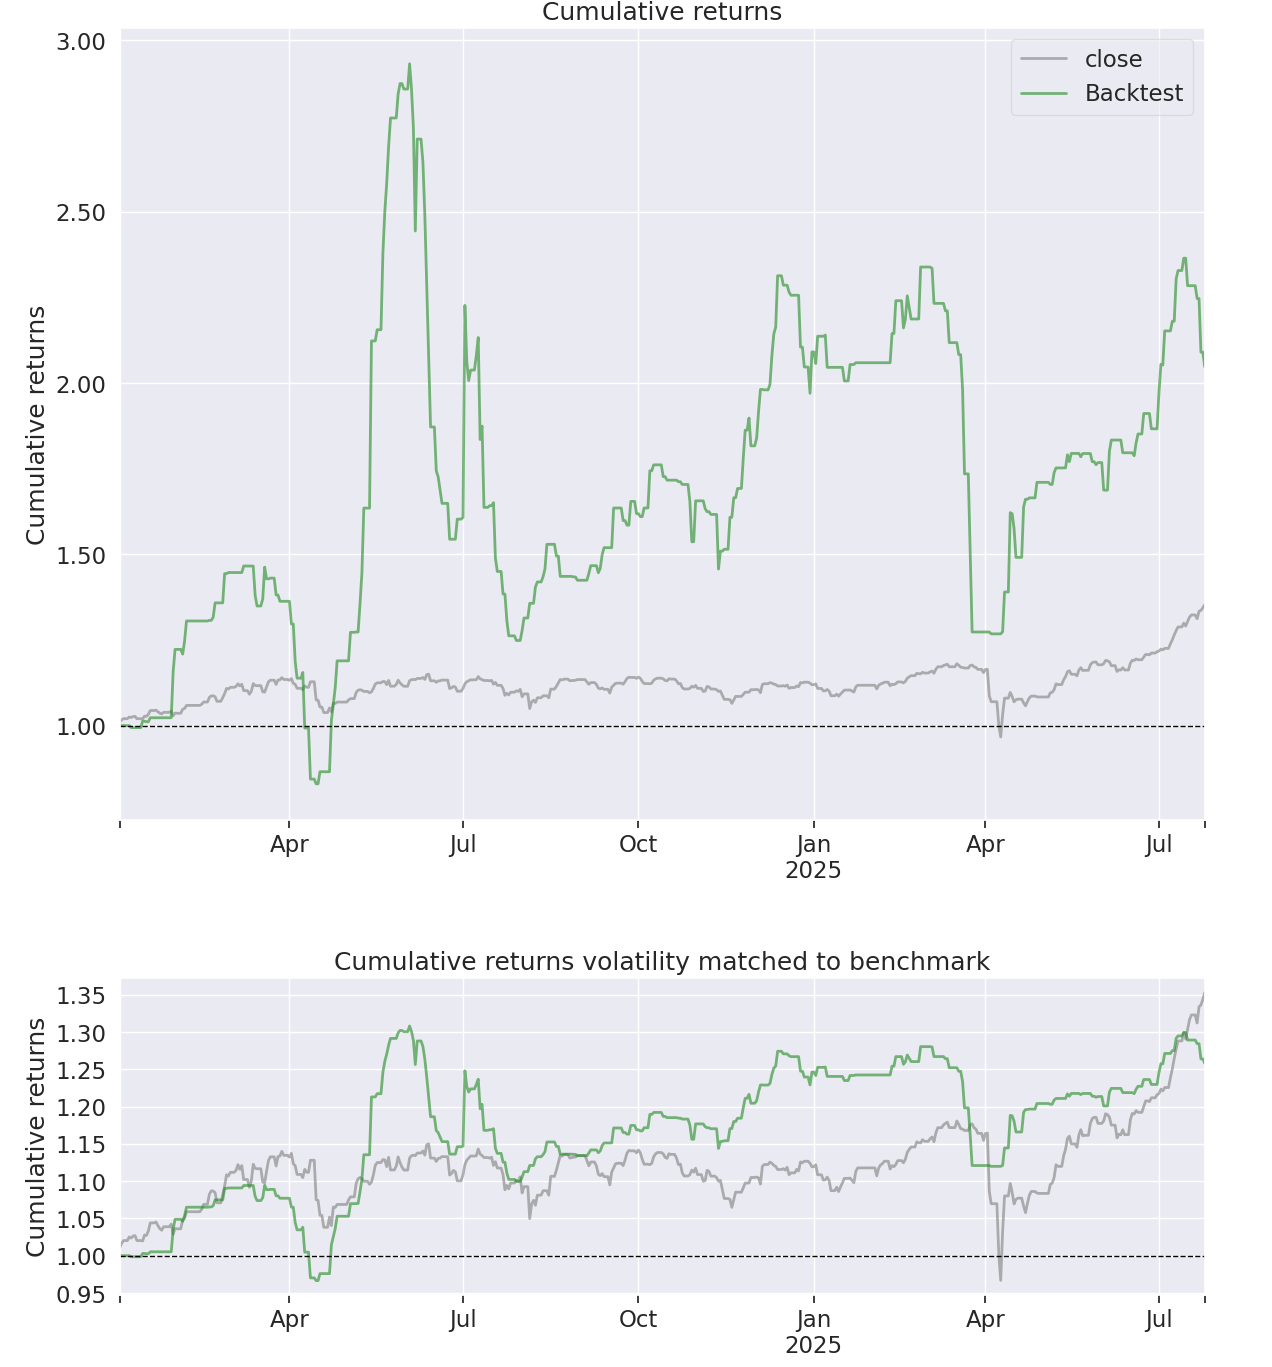
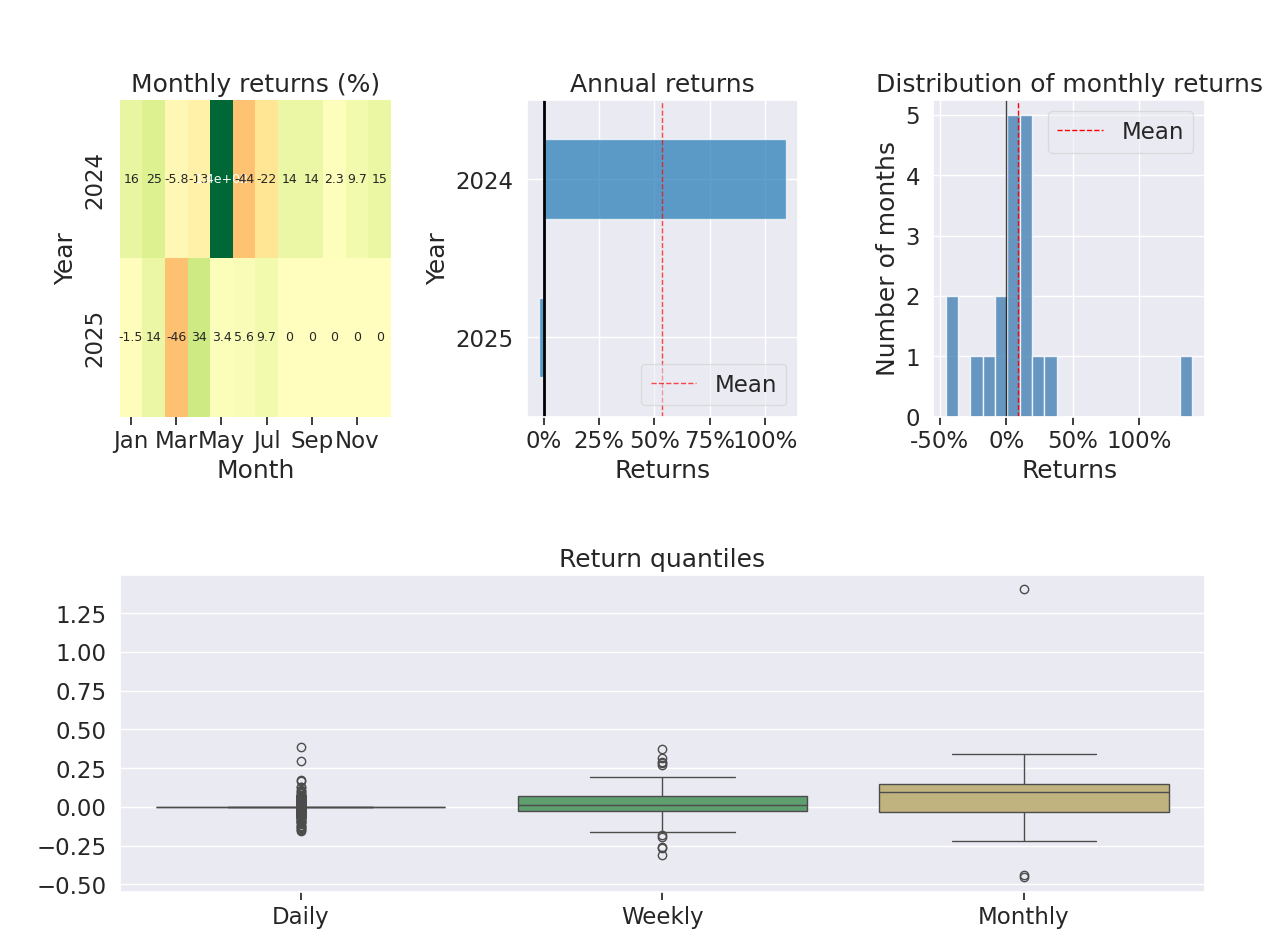
The portfolio clearly outperforms the benchmark (here the VN-Index), and very impressively. Digging into the performance metrics, I get the following table:
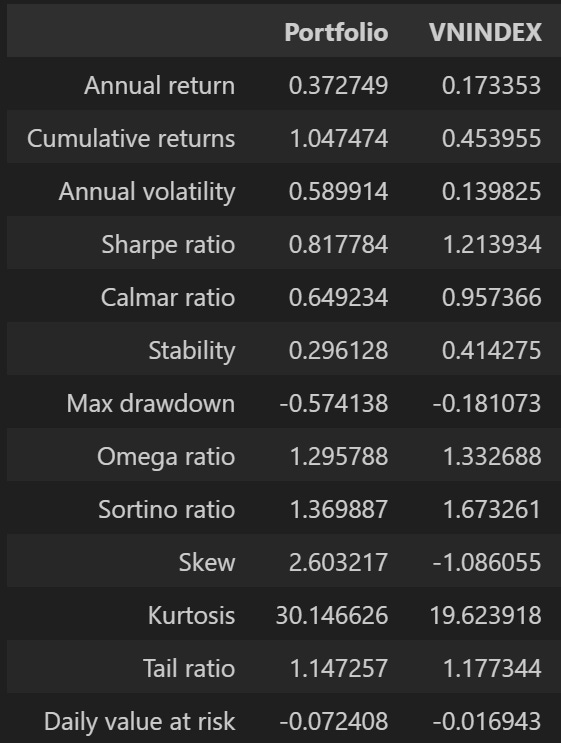
You can see that this strategy is quite volatile and its ratios are not much better than the index, but they are still stable: Sharpe 0.8, Sortino 1.37 and Calmar 0.96. Returns are far superior, with an average (compound) rate of 37% versus 17% for the VN-Index.
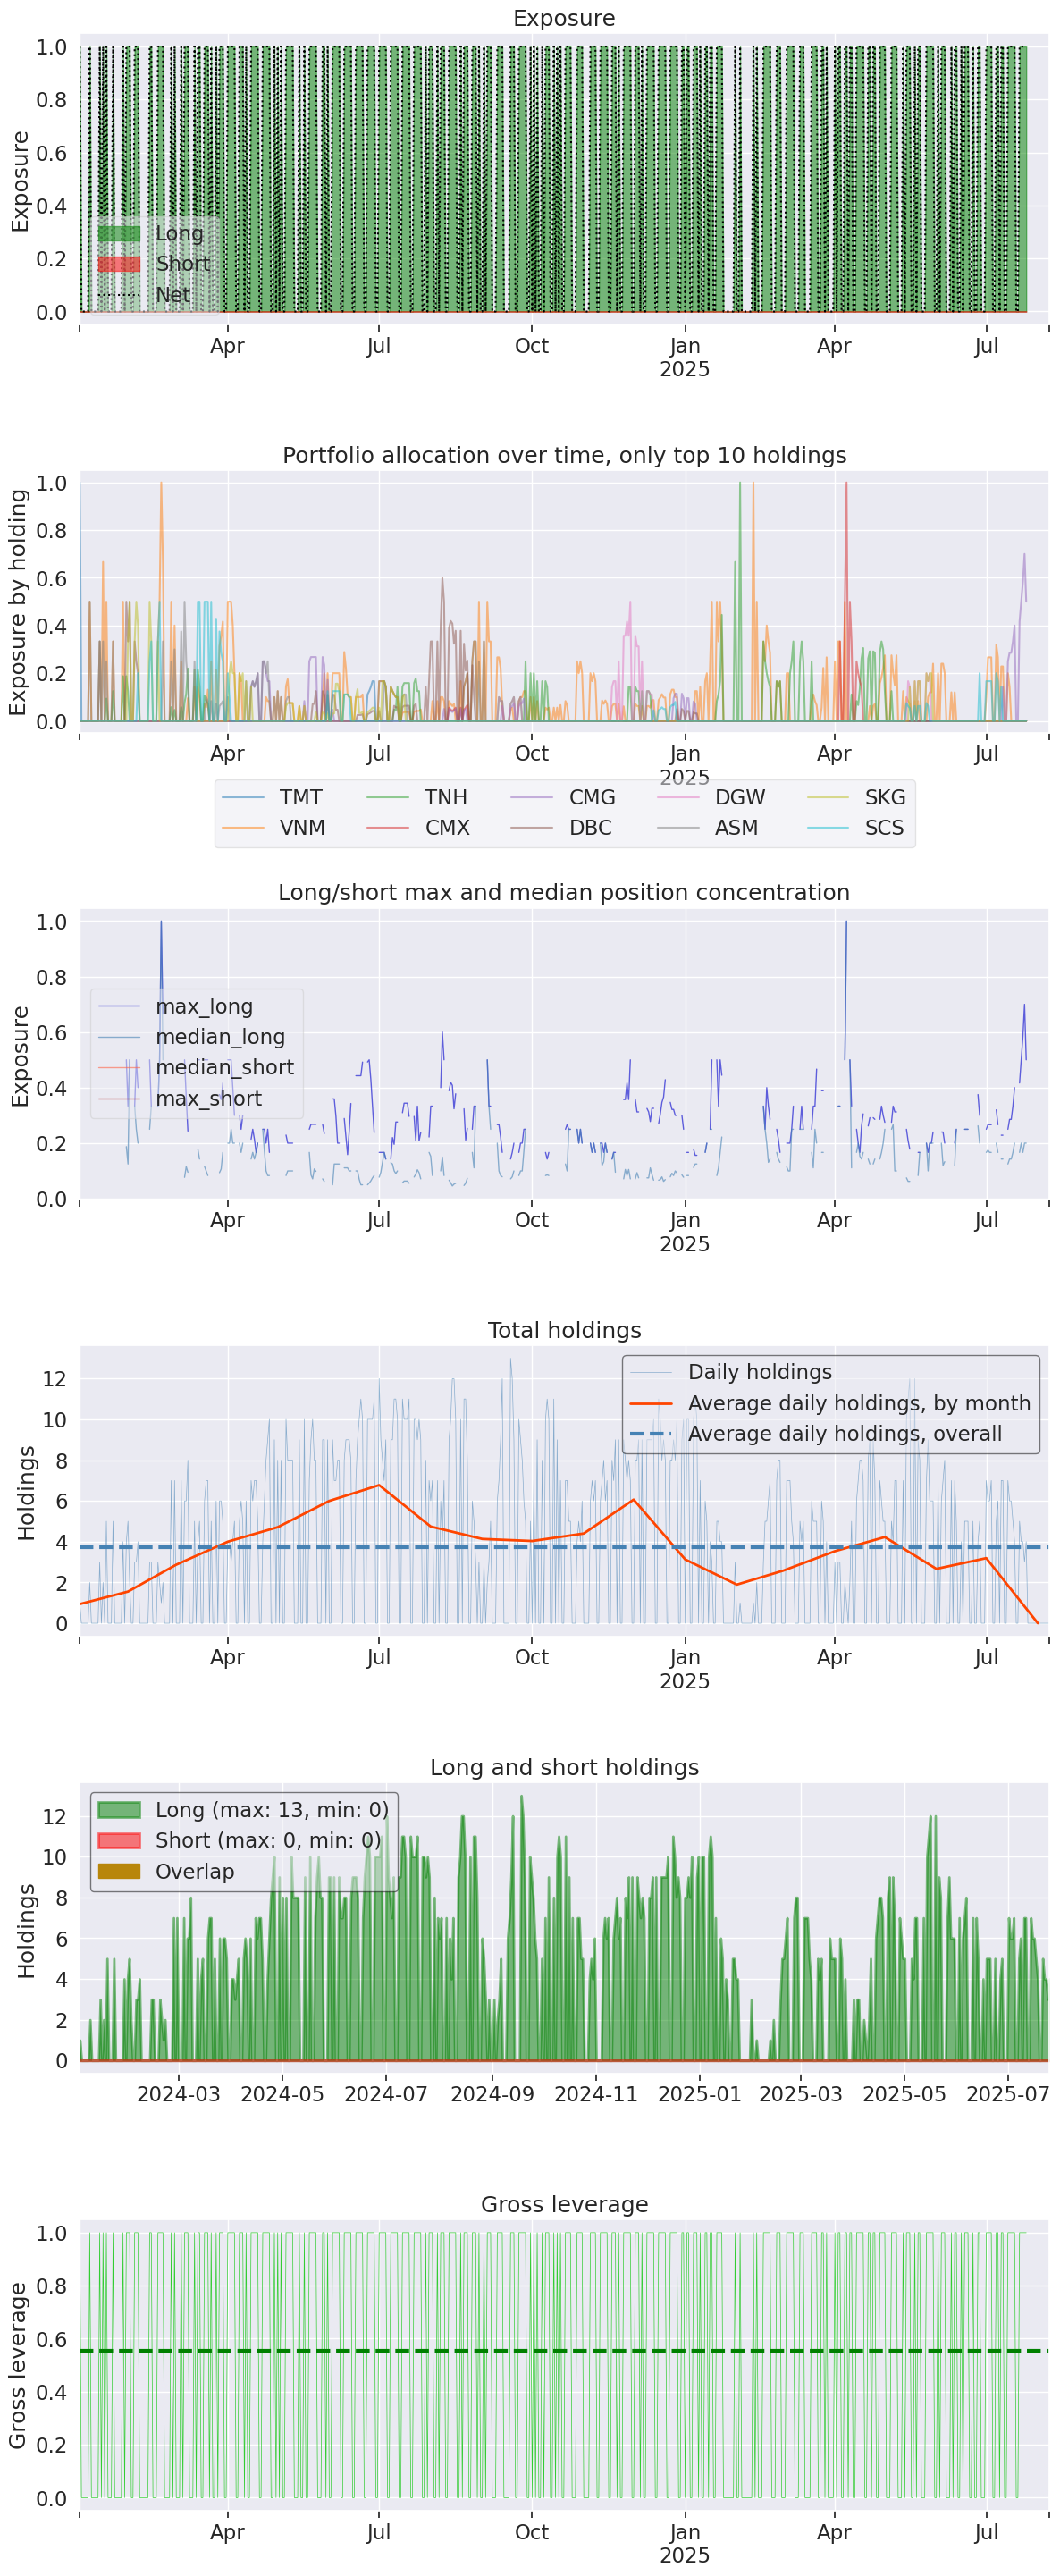
Looking into the portfolio allocation, trading frequency is also fairly stable, and the portfolio is rarely concentrated in a single stock. The (rolling) holding period is 4 days, which is moderate for a tactical portfolio.
CONCLUSION
- There are alpha signals for an (extremely passive) event-driven strategy that arbitrages some fairly common information, such as cash dividends, insider buying and share issuance. The results are quite good for the test period from 1 January 2024 to date.
- Bias sectors (08/18): OnG (oil and gas), Hospitality, Healthcare, Automobiles, IT (information technology), Retail, FnB and Industrial.
- Maximum holding period: 10 days
- Portfolio type: equal weights across the current signals.
This post has become quite long. I hope it is useful, and I look forward to plenty of discussion. Thank you!
Technical Analysis Course – CMT Level 1
Green Chart designed this course specifically for candidates in Vietnam who want to study and prepare for the CMT Level I exam. The programme includes 28 sessions of theory, practice questions and mock exams. Students also receive the course textbook, question bank and mock exams free of charge for their exam preparation, and can retake the course for free for life.
See more details about the course here.