Contents of this article
In this post I will try to analyse how the FedWatch Tool calculates probabilities for FFR targets and how they affect market expectations; I will also use other variables for a fuller assessment.
Objectives of this post:
-
- Get a basic understanding of the FFR.
-
- Briefly understand how the FedWatch Tool calculates probabilities and build a similar monitoring tool.
-
- Understand the relationships between the variables and factors.
-
- From these relationships, find regimes based on how this variable affects markets such as the S&P 500 and the VN-Index, to generate trade ideas.
Conclusions of Part 1:
Thanks for reading! Subscribe for free to receive new posts and support my work.
-
- Changes in the FFR (distance) directly affect oil (OIL) returns, and this is a causal relationship that also runs “the other way round” (=]]). In other words, a move in one affects the other and vice versa (both watch each other to move).
-
- Likewise, the VN-Index has a causal relationship with oil prices, and vice versa.
-
- Moves in the SPX affect the VN-Index and affect gold prices (GOLD). So if you trade gold, watch the SPX; likewise, if you trade the VN-Index, watch the SPX too. I also cannot hold both at the same time, because these two have an “extramarital” relationship with the SPX (=]]).
-
- The SPX’s Beta to the VN-Index is positive more than 80% of the time, and its R2 also covers the largest area among the exogenous factors. Combined with the results above, it is one of the most important explanatory factors with a big influence on VN-Index returns.
Notes:
-
- This post is purely my personal view and analysis, based on my limited knowledge, so it is somewhat subjective. I would very much welcome everyone’s feedback!
-
- The writing style is close to everyday speech, not very academic, and sometimes mixes in English terms; I hope readers will bear with this.
-
- The data is accessed and calculated from the vnstocks library (http://vnstocks.com) and yfinance.
-
- The data for all variables covers 2014 to date.
FED FUND RATES
In theory, the Fed Funds Rate (FFR) is like the benchmark interest rate from which the rates or yields of other assets are determined. So what is the FFR? Why the FFR? How many kinds of FFR are there?
-
- The FFR (EFFR) is the overnight rate between depository institutions (banks, financial institutions) within the Federal Reserve system, calculated as a volume-weighted median (details at this link: https://www.newyorkfed.org/markets/reference-rates/effr?). The FFR therefore reflects the most basic level of interest in the asset that is money (specifically the USD). To help investors, hedge funds and financial institutions hedge moves in line with their expectations, CME created derivatives (futures, options) on the FFR (or so that everyone can bet together, with CME as the bookmaker =]]).
-
- Moves in the FFR are overseen by one party at the top, the Fed, which conducts monetary policy to meet its mandate of price stability and maximum employment (the “dual mandate”), and thereby helps keep long-term interest rates moderate. To steer rates, the Fed sets a “target range” and announces its stance at the FOMC, which meets eight times a year; four of these meetings (at the end of each quarter: March, June, September, December) publish projections with the dot plot. To keep rates within the “target range”, the Fed (mainly) sets administered rates and actively manages the supply of reserves. For more details, see this link: https://www.newyorkfed.org/markets/domestic-market-operations/monetary-policy-implementation?
-
- So the FFR essentially carries two elements – the market element and the Fed’s intervention – which together reveal expectations about the value of the USD.
So to understand the USD from a monetary-policy perspective, I would have to read the FOMC minutes to grasp the Fed’s direction, then follow the FFR from spot to derivatives, and also watch other macro factors for a complete assessment. That is quite a lot to follow, and honestly I think it is very hard to get from those observations to a real view of what the Fed is doing. CME (the bookmaker) offers a tool giving the probabilities of expected rate changes, the CME FedWatch Tool, so that everyone can follow along – or, as I like to call it, a betting score (=]], it’s a bookmaker, so it must have odds). What I like about it is that it shows market sentiment, and in a way it is quite similar to the VIX (in my view, both are calculated from derivatives and reflect implied expectations). Assuming that the expected probabilities of rate changes can affect market states, I will dig into how it is calculated and test whether it can be used to predict or classify regimes.
HOW THE FEDWATCH TOOL IS CALCULATED
The FedWatch Tool includes a probability calculator for the target FFR, which looks like this:
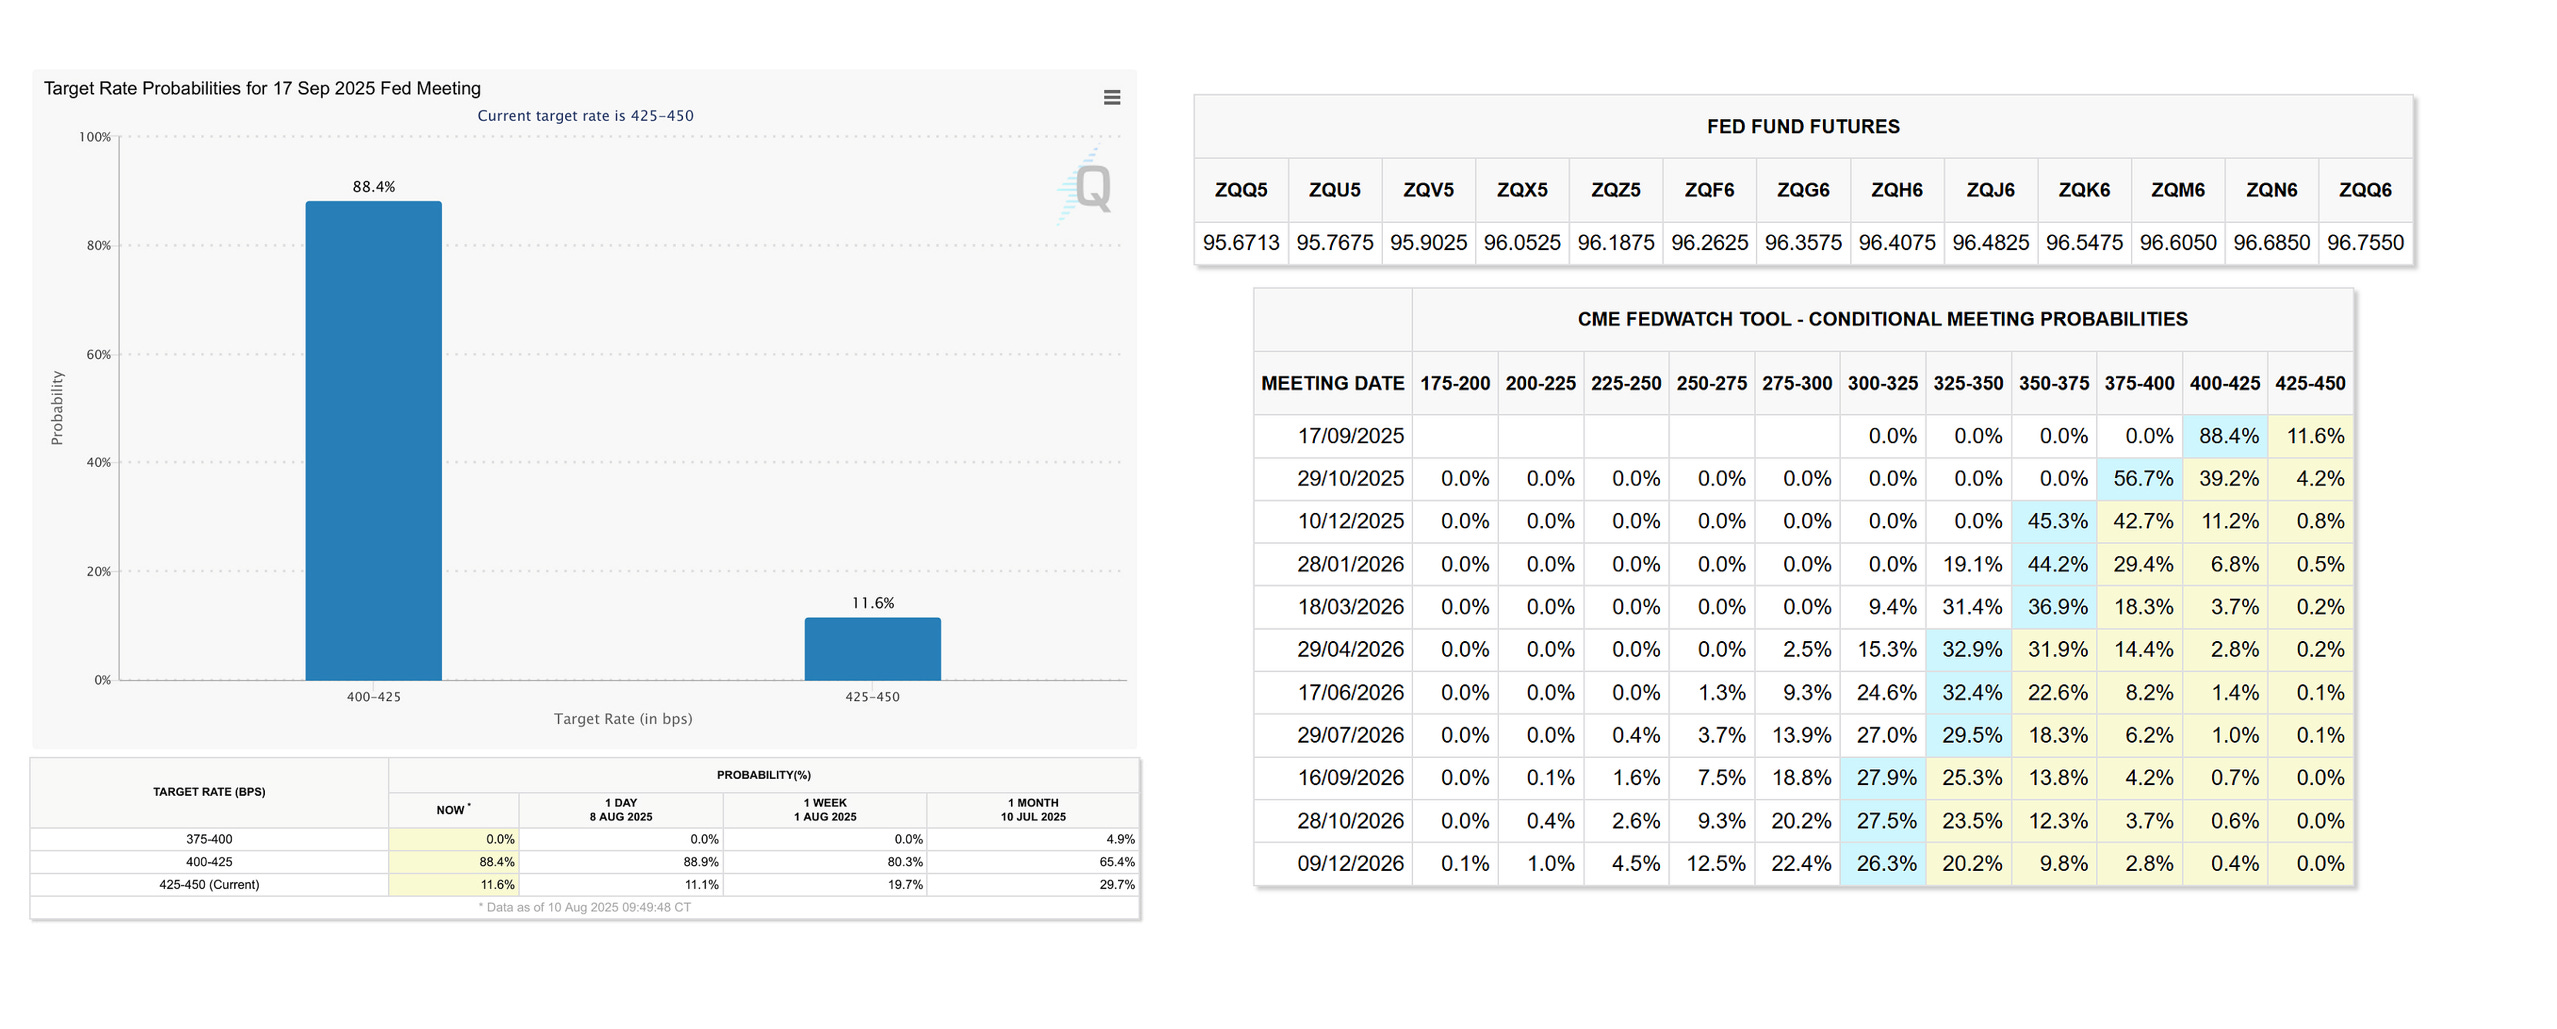
It shows the theoretical probability of a change in the FFR target. How does CME arrive at this probability?
CME describes the basis of its calculations at this link: https://www.cmegroup.com/tools-information/quikstrike/cme-fedwatch-tool-user-guide.html
But let me summarise it as I understand it:
-
- CME sells futures contracts (called ZQ) on the FFR with a single 30-day tenor (30-day Fed funds futures), listed monthly.
-
- From the prices for meeting months and non-meeting months, the following can be calculated:
-
-


- Where EFFR is the rate implied by the ZQ futures price, calculated as follows:
-

- If there is no meeting that month, then EFFR(AVG month T) = EFFR(End of month T-1) = EFFR(Start of month T+1)
-
- If there is a meeting that month, then EFFR(AVG) equals the day-weighted average. Assuming the FOMC falls on day a, with (a+b) the number of days in the FOMC month (e.g. for a 30-day month, a+b = 30), EFFR(AVG) is weighted as follows:


-
- Because there is no meeting in the month after the FOMC, EFFR(Start) = EFFR(End) = EFFR(Avg) for month T+1. So, in the frame of reference of the meeting month, we have EFFR(Avg) for the meeting month and EFFR(Avg) for the non-meeting month. We can then calculate EFFR(Start) for the meeting month as follows:

-
-
-
- So how is the probability calculated once we have the ratio delta/0.25 (0.25, or 25 bps):
-
- If the absolute value of this ratio is < 1 —> use the probability formula above.
-
- If the absolute value of this ratio is > 1, roughly speaking the expectation has moved beyond the 0–0.25 range into a larger range:
-
- For example, if the value is 1.2, it moves into the 0.5–0.75 range, and we set P[Hike] = 0.2, i.e. 20% for a 75 bps hike, and P[No Hike] = 1 – 0.2 = 0.8, i.e. 80% for a 50 bps hike
-
- If the value is 2.2, the threshold is 0.25 * (1 + 2) = 0.75, the new range is 0.75–1.00, and P[Hike] = 20% for a 100 bps hike and P[No Hike] = 80% for a 75 bps hike.
-
- If the absolute value of this ratio is > 1, roughly speaking the expectation has moved beyond the 0–0.25 range into a larger range:
-
- So how is the probability calculated once we have the ratio delta/0.25 (0.25, or 25 bps):
Very convoluted, but in the end the key ratio is still delta/0.25. I only need to calculate this to see how representative it is at a given time. However, there is a big problem: I do not have historical futures data (CME charges for it, and yfinance does not have complete data). The current yfinance data only has the latest futures price, meaning I have the market’s expectations but no prices to compare against to calculate this probability.
OK! I’ll play it the poor man’s way and use what I’ve got (=]]). Instead of the expensive paid prices, I will calculate a so-called distance between the FFR the market expects and the current FFR, to see how far rate expectations differ. In the end it looks like this:
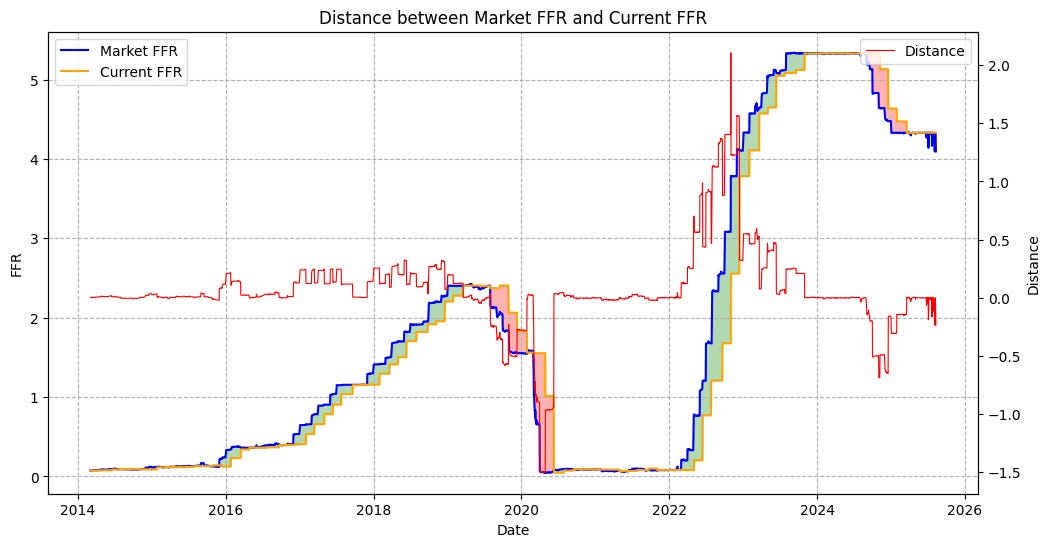
(Where: Market FFR is the FFR futures price, Current FFR is the current FFR)
You can see that changes in this distance capture changes in FFR expectations quite well: the thicker the cloud between the futures price and the current price (sounds a lot like the godly Ichimoku of “Japan Antivirus” =]]) – i.e. the bigger the move – the larger the distance. Peaks in the distance also show early turning points in the FFR (interestingly, right now the market FFR seems to be trying to form a downward cloud but hasn’t managed it yet, heh). Based on this data, I will try to see whether so-called regimes exist in the market when the FFR the market expects changes.
REGIMES
a) Relationships between the factors
I see that most people care a lot about how the economic calendar affects the Vietnamese market, especially the FOMC and other macro events in the US, EU and elsewhere. However, I have some doubts about the theory versus the reality of how changes in these events affect markets (both the home country and Vietnam). Do they really have a significant effect? If so, how should we understand it? Does that understanding hold for Vietnam?…
There are many questions about this! If we put all these factors into a basic regression model, I would subjectively treat them as exogenous variables, since they may have an exogenous effect on what I am observing. OK! Let’s see whether they really affect Vietnam:
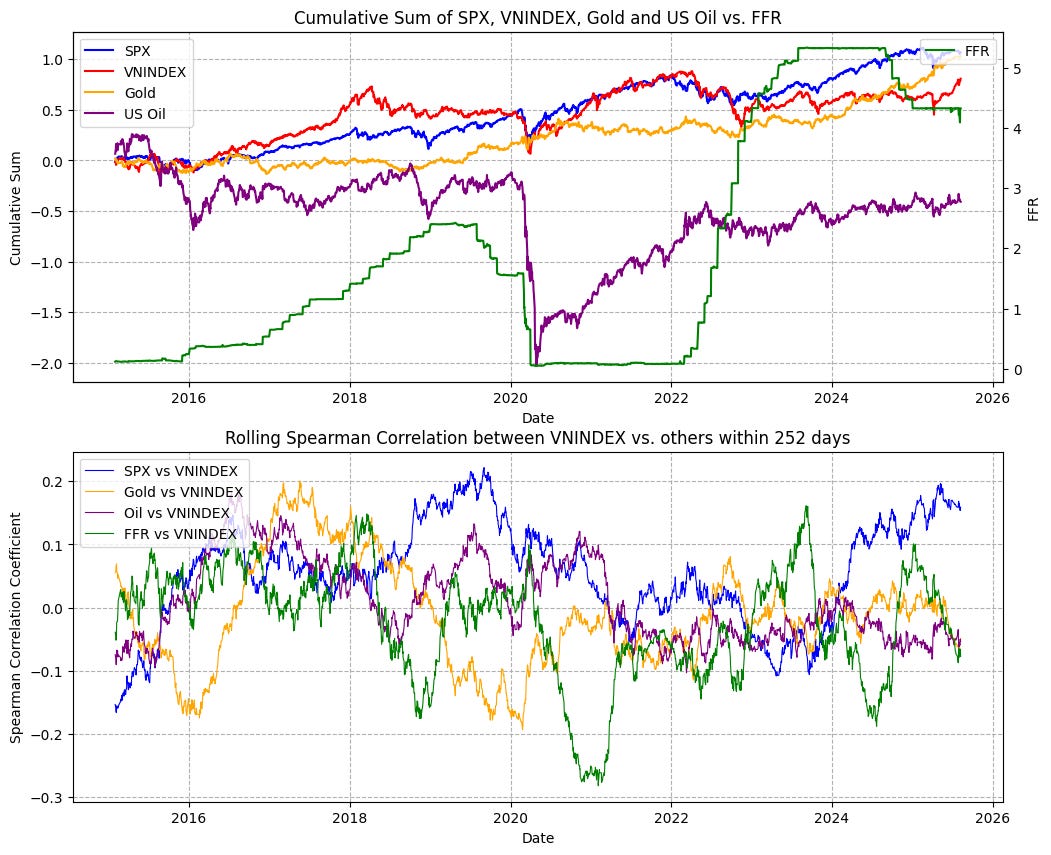
(The FFR here is calculated from FFR futures on yfinance; the VN-Index has been converted into USD for consistency (so you won’t see it break 1,500 =]]))
The chart above shows the VN-Index against other assets (the S&P 500, gold and oil) and the FFR, with Spearman correlations over a 252-day look-back window. I draw only a few preliminary observations:
-
- The correlation between VN-Index and SPX returns seems to be the most consistently positive, with the highest share of time in positive correlation (almost 80% of the time), followed by oil prices (just over 40%) and, third, the FFR (quite interesting).
-
- More specifically, looking at the 252-day rolling Beta between these variables and the VN-Index, the SPX and oil also co-move the most, with Beta > 0 about 79% and 67% of the time respectively (naturally, since Beta = correlation / std). R-squared (R2) (used to assess how much one variable explains another; e.g. 0.2 means 20% explained) also stays highest for the SPX and oil, although still fairly modest. Interestingly, at extremes (2020 and 2024), R-squared jumps sharply; my subjective view is that these extremes are crisis points where the whole market shares the same view (=]]).
-
- Most of the time the FFR explains very little, but there are periods when it explains more, with R2 rising steadily – usually times when the other assets’ correlations are fading.
Based on this, I will run a small test of a causal network: roughly, a Granger causality test of all the moves from these variables to the VN-Index. However, since this tests linear relationships, it must meet some statistical requirements for linear regression, one of which is a test of the stationarity of the time series. For that I use the “famously headache-inducing” ADF test, with the following results:
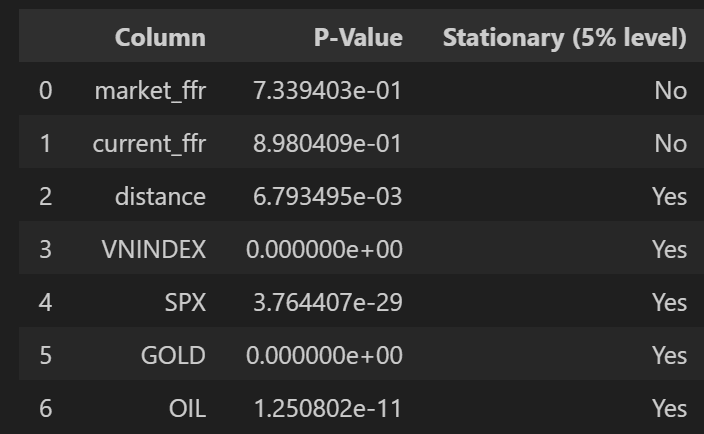
After testing, I can only use 5 of the 7 variables in this network; the two variables Market_FFR and Current_FFR plotted in section I cannot be used (no matter, since the distance already represents both).
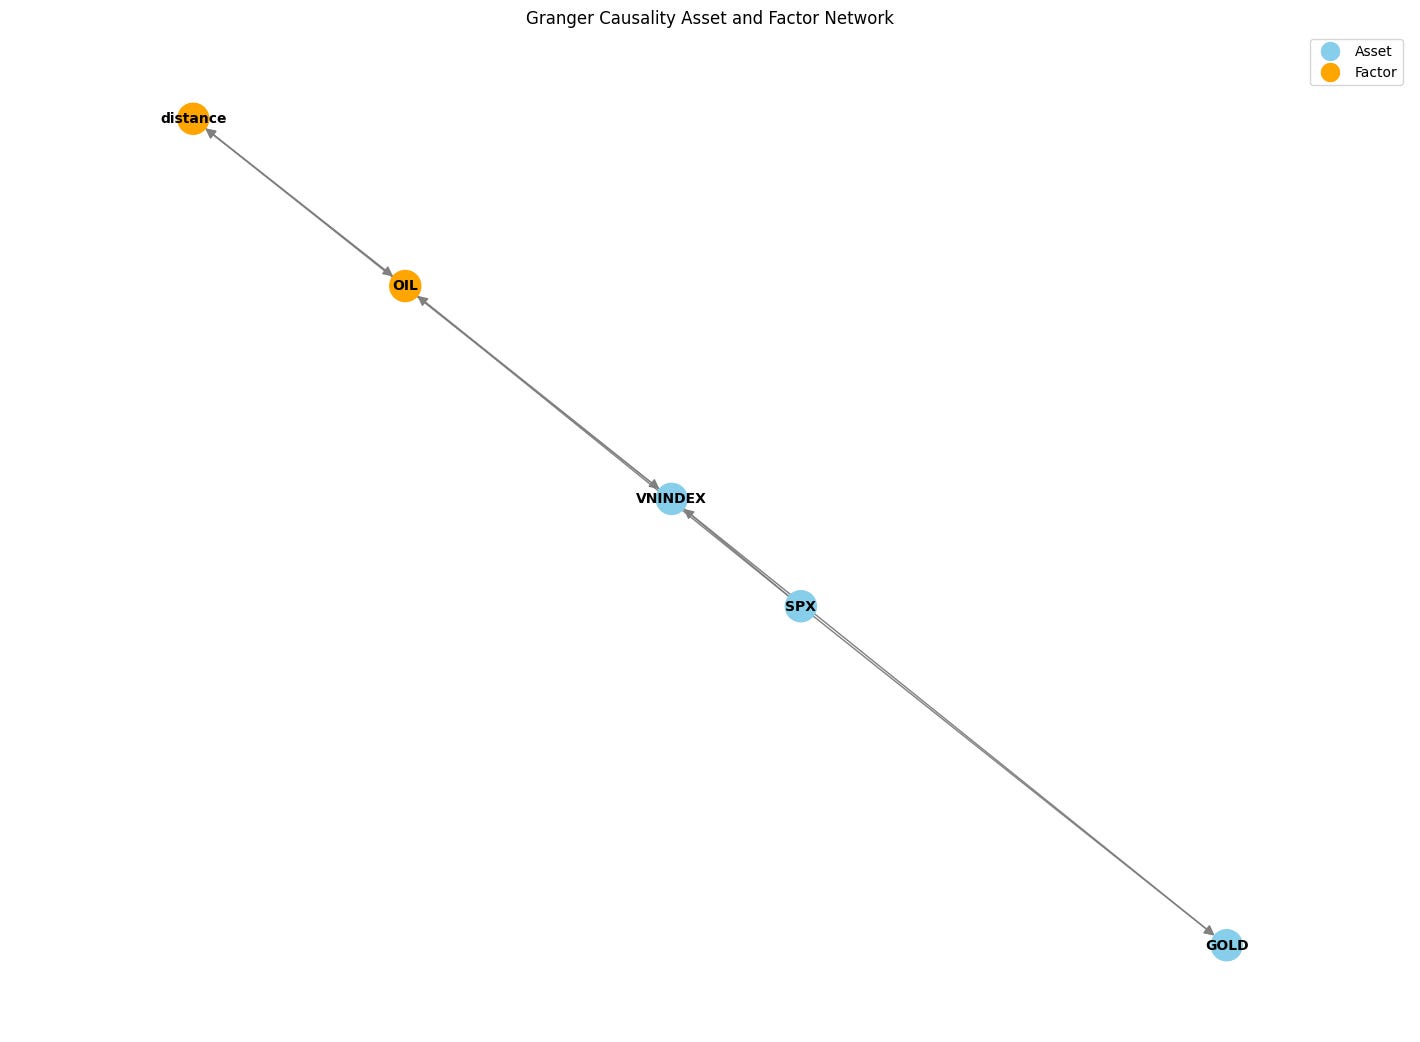
Then I tested with a maximum lag of 20 days and got this result:
Conclusions of Part 1:
The results here are quite interesting:
-
- Changes in the FFR (distance) directly affect oil (OIL) returns, and this is a causal relationship that also runs “the other way round” (=]]). In other words, a move in one affects the other and vice versa (both watch each other to move).
-
- Likewise, the VN-Index has a causal relationship with oil prices, and vice versa.
-
- Moves in the SPX affect the VN-Index and affect gold prices (GOLD). So if you trade gold, watch the SPX; likewise, if you trade the VN-Index, watch the SPX too. I also cannot hold both at the same time, because these two have an “extramarital” relationship with the SPX (=]]).
-
- The SPX’s Beta to the VN-Index is positive more than 80% of the time, and its R2 also covers the largest area among the exogenous factors. Combined with the results above, it is one of the most important explanatory factors with a big influence on VN-Index returns.
This post has become quite long; I hope it is useful to readers. In the next part I will write about creating trade ideas from these results and explain more about how the Granger network above is calculated. I hope you will keep following along.
Best regards!
Nguyen Le Khanh
Technical Analysis Course – CMT Level 1
Green Chart designed this course specifically for candidates in Vietnam who want to study and prepare for the CMT Level I exam. The programme includes 25 sessions of theory, practice questions and mock exams. Students also receive the course textbook, question bank and mock exams free of charge for their exam preparation, and can retake the course for free for life.
See more details about the course here.