

Contents of this article
Following on from Part 2, in this part I focus on forecasting regimes and analyse the problem of overfitting very carefully, as I understand it.
Objectives of this post
- Get a basic understanding of the FFR (Done).
- Briefly understand how the FedWatch Tool calculates probabilities and build a similar monitoring tool (Done).
- Understand the relationships between the variables and factors (Done).
- From these relationships, find regimes based on how this variable affects markets such as the S&P 500 and the VN-Index, to generate trade ideas (Part 3).
Conclusion
- Market risk states (regimes) can be identified, including risk-on (a stable state) and risk-off (a high-risk state).
- The model comes close to forecasting the regimes but is not yet effective (overfitting still cannot be ruled out).
- The backtest results also confirm a high degree of overfitting when trying to trade the strategy.
- The model still has potential for further mining, since the distribution of alpha looks fairly good relative to Beta. This also suggests we may be on the right track and can mine more data for better strategies.
Notes
- This post goes deep into assessing whether a financial model is overfitted, using quite a few unusual concepts (Combinatorial Purged K-Fold, regressing IS-Sharpe on OOS-Sharpe, and so on). I try to explain them briefly, but there will inevitably be gaps; I will explain these topics further in a dedicated post later.
- This post is purely my personal view and analysis, based on my limited knowledge, so it is somewhat subjective. I would very much welcome everyone’s feedback!
- The writing style is close to everyday speech, not very academic, and sometimes mixes in English terms; I hope readers will bear with this.
- The data is accessed and calculated from the vnstocks library (http://vnstocks.com) and yfinance.
- Unlike some academic research, the goal here is to find influential factors to observe and forecast, so I keep speculation and conspiracy theories to a minimum – things like the VN-Index being moved by the SPX because of Trump, because of tariff policy, or “liquidity moves the market” (=]]), blah blah… Why?
- Simply because I don’t want to fall into certain biases in financial reasoning, specifically anchoring bias (anchoring on limited knowledge) and confirmation bias (seeking information that confirms my argument and, intentionally or not, leaving out information pointing the other way).
- The market is always changing; the information I have now explains only part of the movement, and often only from one angle. That means if we look at it differently, it may still be meaningful and can still be mined.
- The goal here is not research either: I am looking for alpha, i.e. trading strategies. So signal testing matters more!
III) THE FORECASTING MODEL
Having found the causal relationships between the variables and VN-Index returns, to build a reliable multi-factor forecasting model I need to clarify the following points:
- Regimes must be identified from the observed variables with an appropriate level of statistical confidence.
- A suitable model must be found with the lowest degree of overfitting.
Both problems are actually very hard to solve, and there is no completely correct answer. But here is how I will approach them.
Problem 1: Identifying regimes
This involves labelling data, for which I need a standard that defines the regimes. In fact, regimes can be identified from a macro perspective (identifying macro states: Expansion, Overheating, Stagflation and Deflationary) to determine the state of GDP growth and from that forecast the movements of assets in the economy, of which equities are one. In my view, forecasting this has some problems:
- Lack of data: macro data is quite patchy, and the quality of Vietnamese macro data only becomes reasonable from around 2000 (and some methods are still needed to fill gaps). The data is also quite strongly biased: for some variables reflecting expectations of the economic cycle, such as the PMI, the free data I could find only starts in 2013 (S&P survey data) and is fairly weak, not representative of overall expectations.
- Long forecast horizon: since most of the data is quarterly, the forecasts will also be quarterly. If a trader only cares about the regime over one month, the forecast is quite noisy and impossible to gauge.
So I need to classify regimes by a different characteristic, ideally based on the variables I have already observed. Subjectively, I use the K-means clustering algorithm, which simply groups together values with shared characteristics (I won’t go into the formula; you can google it for details). This algorithm has some advantages:
- Automatic classification (unsupervised learning): the algorithm uses the characteristics I feed it to group the data automatically (into groups with shared characteristics).
- Fast to compute and easy to explain.
However, it also has some problems:
- It is very susceptible to noise, and the more characteristics there are, the noisier it gets, so the characteristics (or features) need to be filtered to reduce the number observed.
- Choosing the number of clusters also depends on fairly subjective methods (elbow, silhouette…), so the number of clusters is fairly subjective and not very stable.
So, to keep my algorithm stable, I need to filter the variables to reduce the dimensionality of the data while preserving their explanatory and classifying power, then fit them into the algorithm to get suitable regimes. So once again I select suitable variables from the observations in the previous post, with the following results:
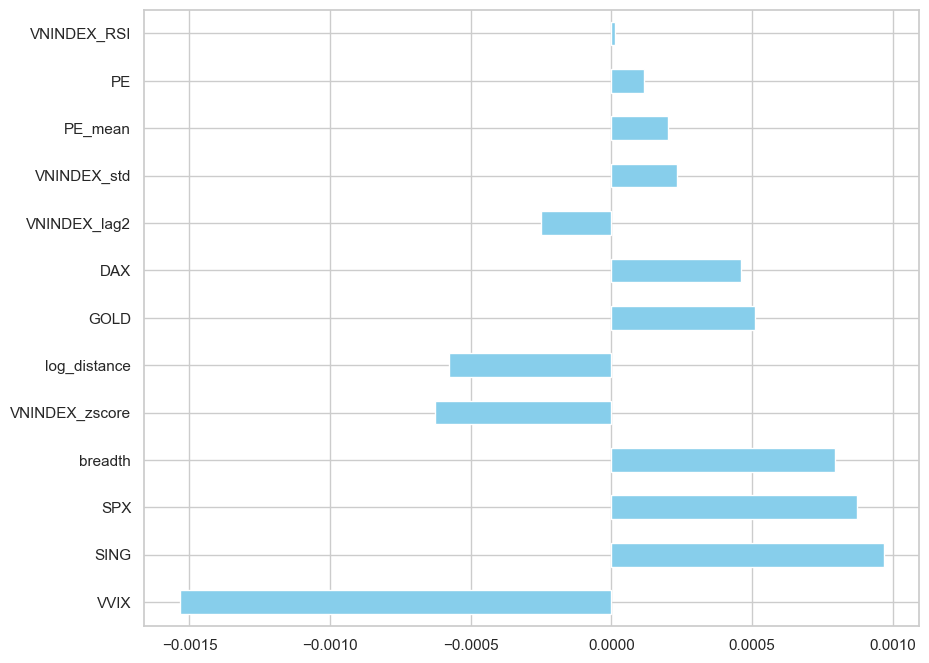
I continue with Elastic Net for feature selection, but focus more on the transformations for the VN-Index. In the end, the dimensionality is reduced to 13 variables (versus 19 in Part 2). Using these variables to run K-means clustering, with the number of clusters chosen by silhouette, gives the following result:
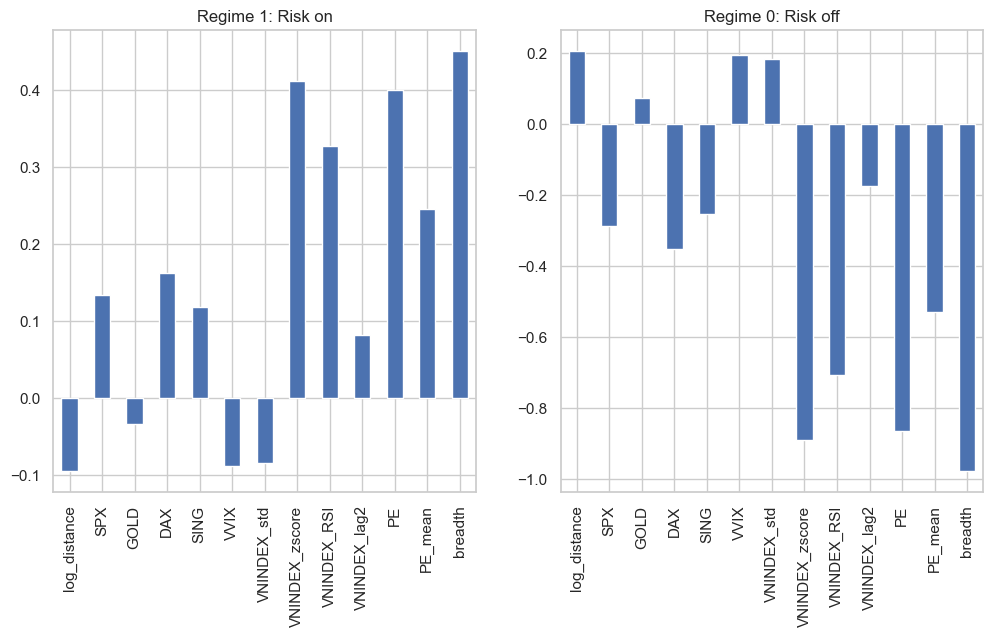
The regime results show two main states:
- Risk on: log_distance, Gold and VVIX have negative mean values (after normalisation with sklearn’s StandardScaler) and all other assets are positive. I call this state “Risk on” because it shows greater potential stability in interest rates (based on log_distance), with gold prices falling and the volatility of volatility (VVIX) also falling. At this point I can flip the switch to accept risk (risk on).
- Risk off: the opposite state, where the mean values of the variables above are positive and those of all other assets are negative. This may imply an unstable environment for short-term trading, so I cannot flip the switch to accept risk (risk off).
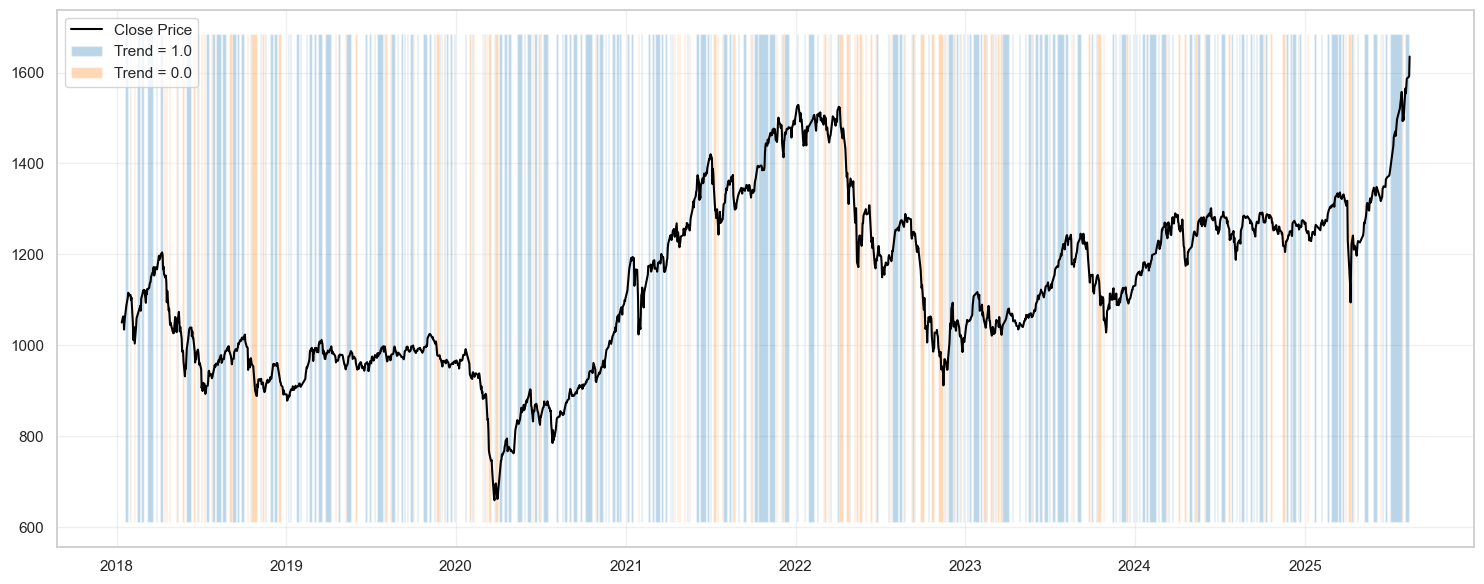
However, we still need to check whether this classification matches the actual movements of the VN-Index. Overlaying the regimes above on the VN-Index gives this chart:
Regimes and the VN-Index
Regimes and volatility
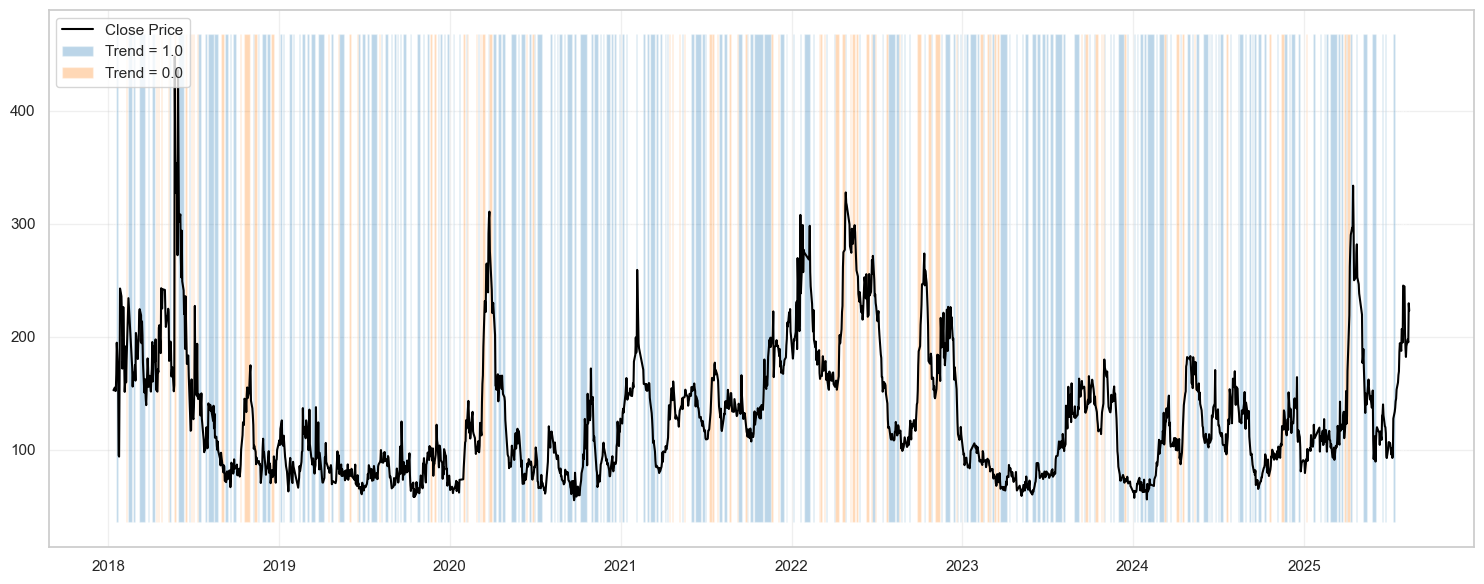
Green is risk-on and yellow is risk-off. You can see the clustering is fairly stable: mostly, during risk-on, volatility stays fairly low and the VN-Index trend is quite smooth and stable.
So the regime labelling is acceptable for now; I will move on to finding a model to forecast these regimes.
Problem 2: Finding a model
Model Pipeline:
As in previous posts, I will use these models, with brief explanations from ChatGPT (=]]):
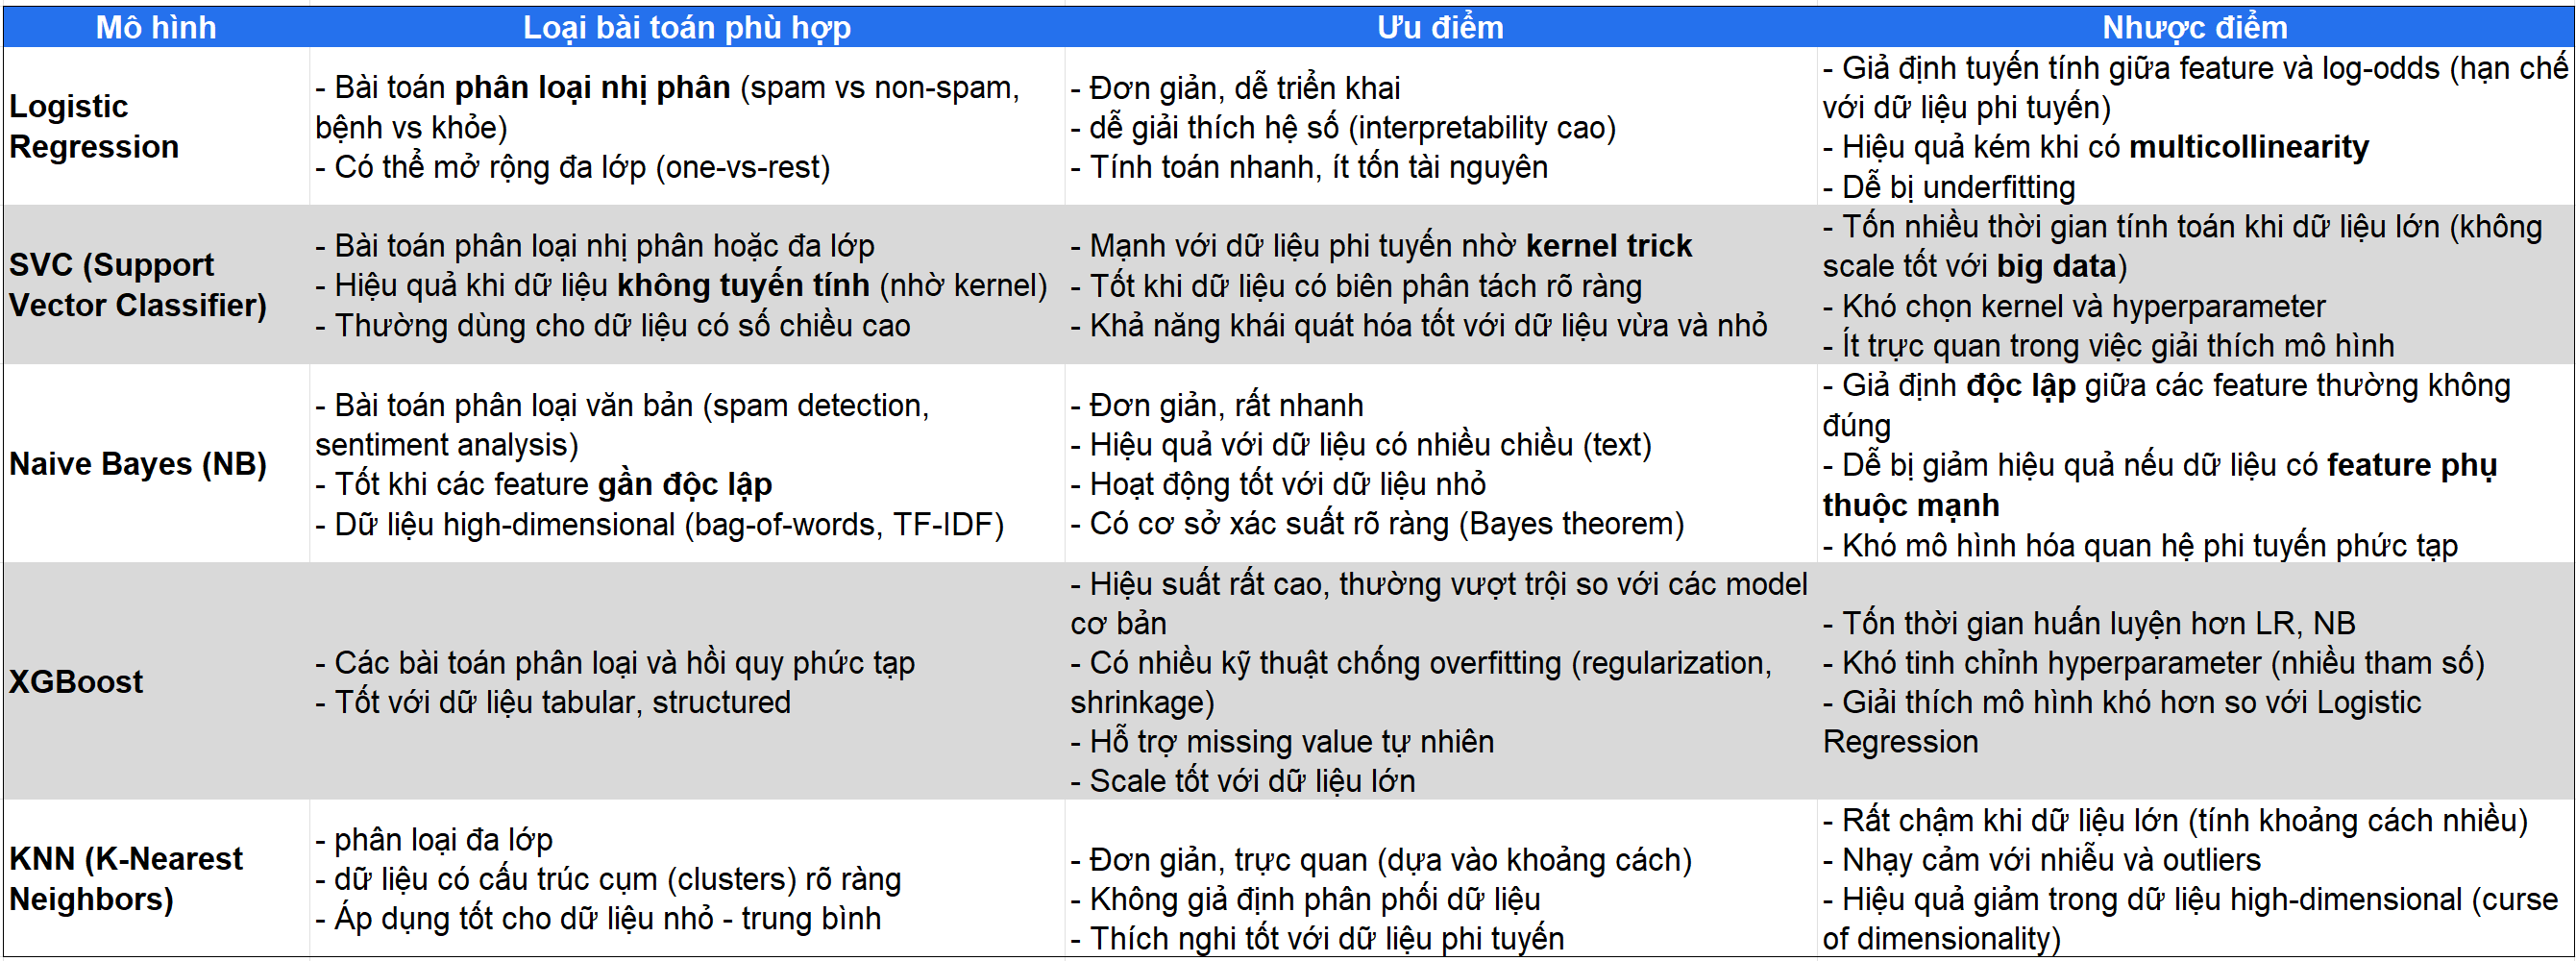
By using Elastic Net to find features with high explanatory power and little multicollinearity, the data preparation above has largely eliminated the main limitations of these models. However, forecasting needs more than that. To improve accuracy, I will use a cross-validation method better suited to financial data, including:
- First, I use TimeseriesPurgeKFold: sklearn’s built-in time series split plus purging. What is purging? It removes both ends of the overlapping segments (to avoid overfitting), as in this illustration:
- The pipeline for finding the optimal model in each loop is as follows:
- Basically, I think fitting the models through this pipeline limits data leakage during training, minimising overfitting. Then I loop through each model and get the following results in terms of prevalence edge: (lr, nb, svc, knn and xgb stand for logistic regression, naive Bayes, support vector classifier, k-nearest neighbours and XGBoost respectively)
So this time the beauty queen of classifiers is the SVC model, with the highest prevalence score and a predictive edge almost 10% above random (I explained prevalence in the post on fundamental factors affecting the VN-Index, Part 2).
However, once again I need to make sure my model is not overfitted when used for forecasting. So how do we determine whether a model is overfitted?
Overfitting
Splitting the training and test sets and trying many times can unintentionally introduce a bias called selection bias. This is the bias that arises when I have tried the model too many times and end up choosing the result I like most, not the most effective one. In other words, the more I test, the more likely I am to find strategies that fit the best PnL curve – but the best PnL curve does not mean the most effective signal; it may simply be the best fit to past values (with no explanatory meaning). So how do we solve this?
Lopez offers a method to address this, specifically:
- Use historical data to compute the Sharpe ratio in the past (or during the model training period) and fit the forecasting model, then compute the Sharpe ratio of the forecasting model. This gives a pair of Sharpe ratios: In-Sample (IS-Sharpe) for the training period and Out-of-Sample (OOS-Sharpe) for the forecast period.
- The data is randomly sampled with a method specific to time series called the “COMBINATORIAL PURGED CROSS-VALIDATION METHOD” (see chapter 12 of Lopez’s Advances in Financial Machine Learning). This algorithm takes progressive random samples, so it avoids the overfitting problem of traditional K-Fold sampling, and it can also increase the number of samples.
- Then we regress the OOS and IS pairs. If the slope (or Beta) is negative, IS-Sharpe moves inversely with OOS-Sharpe, i.e. the higher a model’s IS-Sharpe, the lower its OOS-Sharpe (overfitting). So, objectively, we are looking for a positive Beta for these pairs of IS and OOS Sharpe ratios.
Convoluted as it is, I understand it simply as taking progressive random samples of a dataset made up of train and test sets, fitting the model on the training set and predicting on the test set. Then, if the train and test Sharpe ratios move together, there is no overfitting, and vice versa.
OK! With the concept understood, using the combinatorial progressive random sampling above with 558 draws, I get the following distribution of OOS-Sharpe:
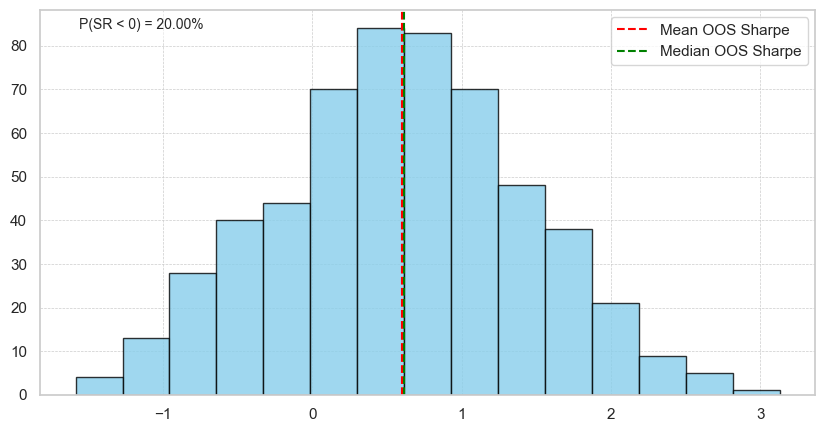
The distribution is fairly evenly spread and nearly balanced, with mean ~ median and mean > 0. In addition, the probability of a Sharpe ratio below 0 is under 20%. This is a fairly good sign for limiting overfitting; I will try to find a balanced OOS-Sharpe distribution with a positive mean and negative skew (values concentrated more on the right).
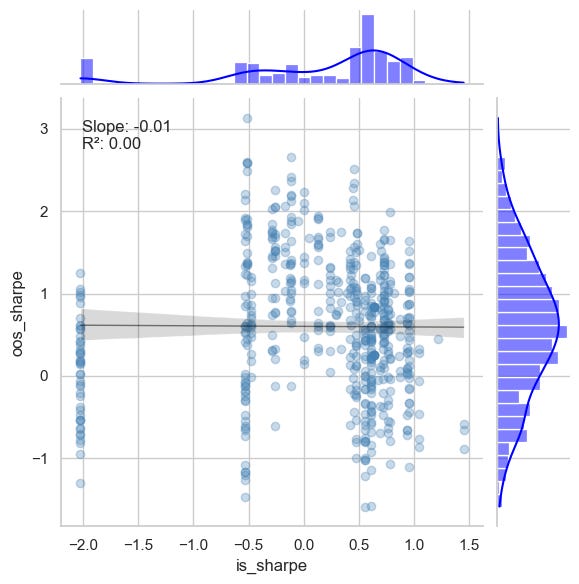
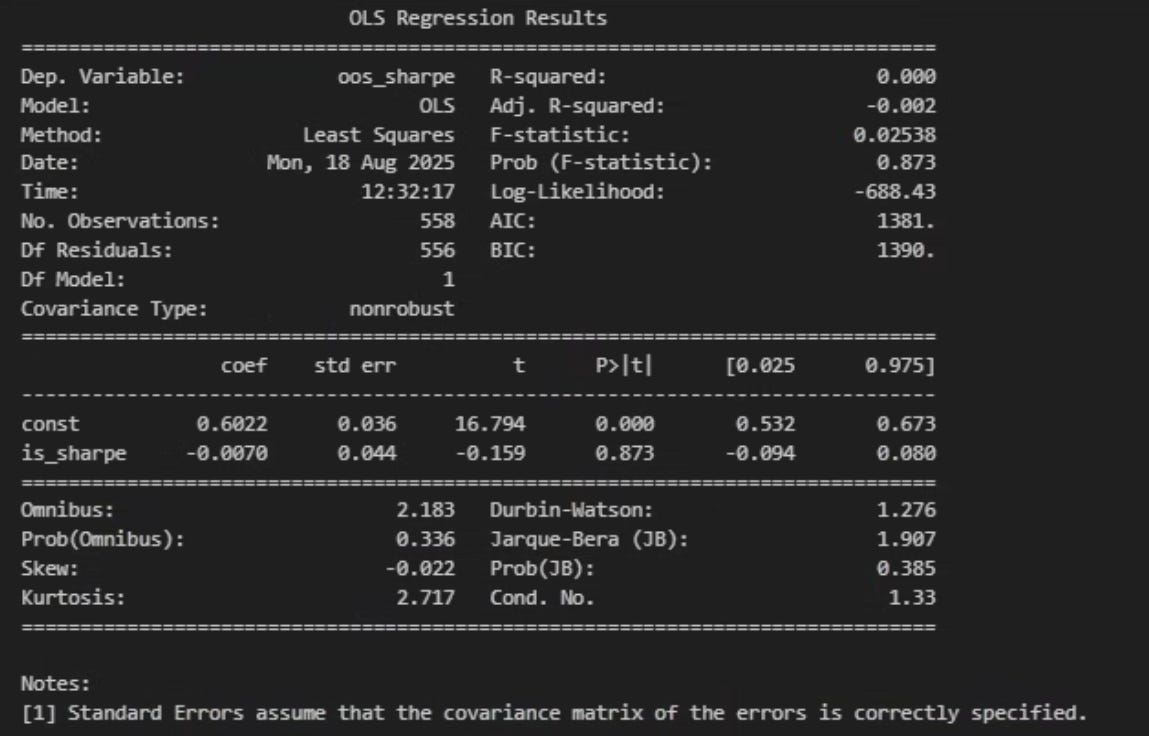
The regression on IS Sharpe also shows a slope Beta of almost 0, and the regression line moves fairly randomly (its trajectory is hard to determine). However, the slope’s p-value is quite high, showing that we cannot yet be confident it differs from 0. Based on this, overfitting has not been fully resolved, so the regime forecasts may still be somewhat similar to random.
Backtesting
The analysis above makes things somewhat clearer: our model still has lingering overfitting. Still, I will run a backtest to see the problem more clearly.
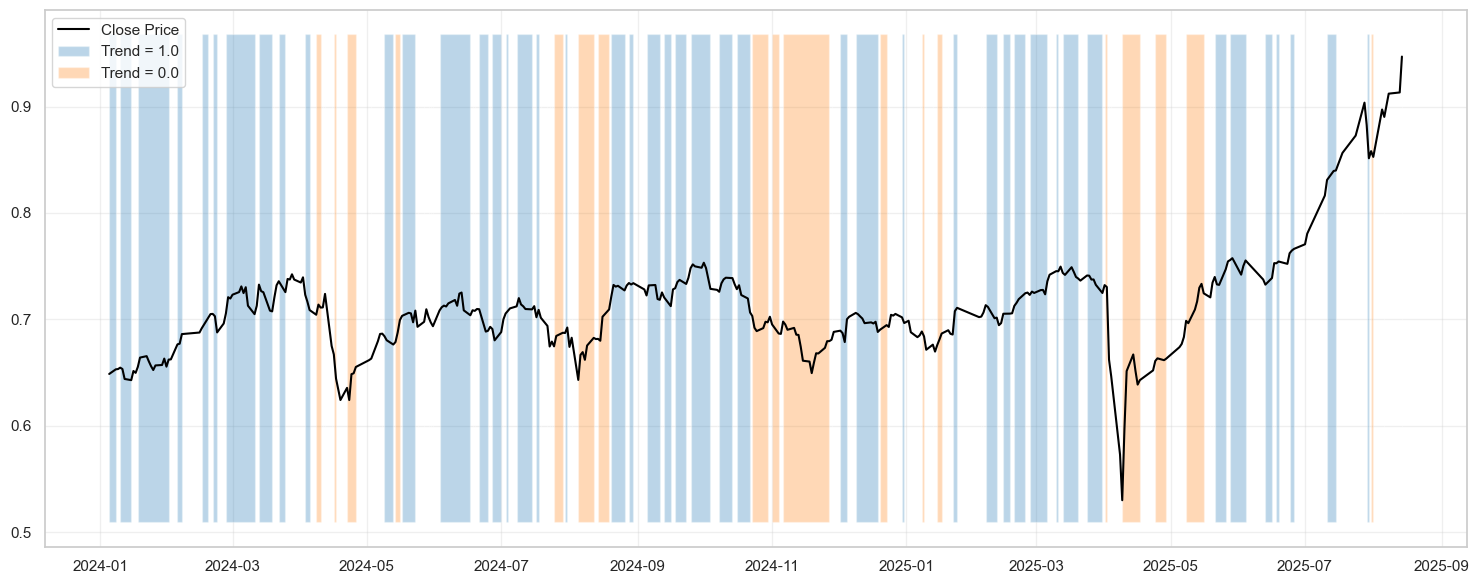
VNINDEX movement
Market volatility
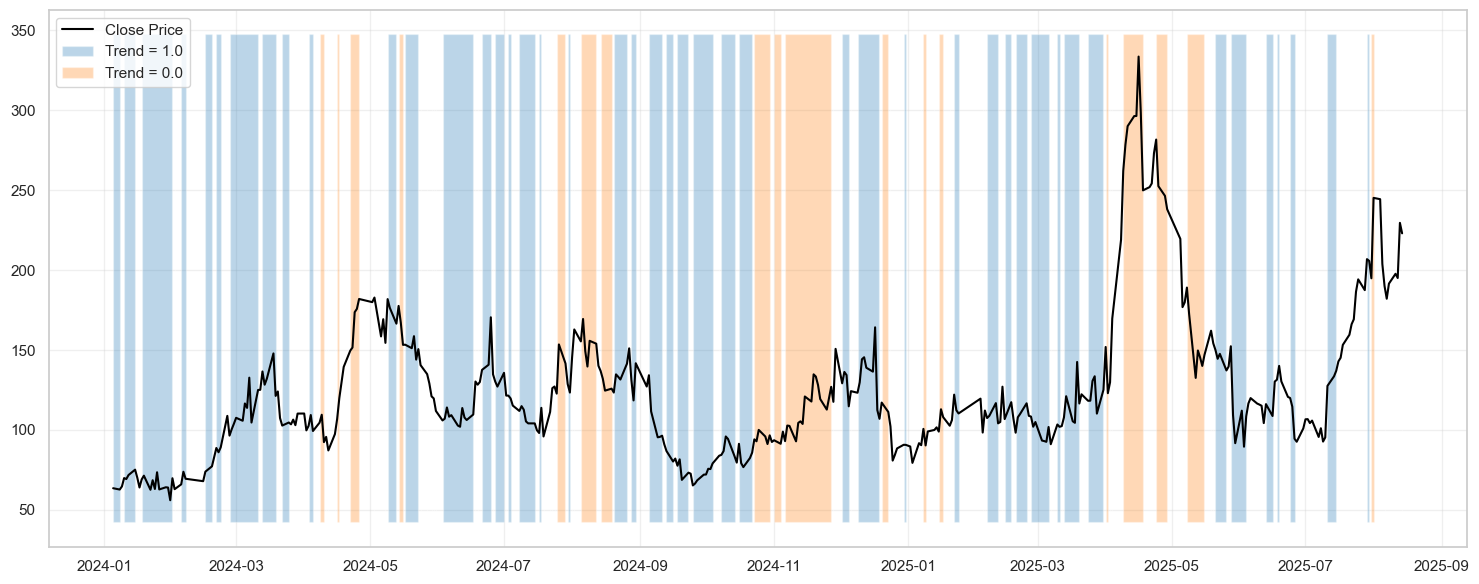
Forecasting the test set from 1 January 2024 to date, the model still predicts high-risk states (yellow zones) quite well, when market volatility was rising sharply. Even more remarkably, the model even predicted the tariff episode (=]], very suspicious). However, running a strategy of buy and hold during risk-on and staying on the sidelines during risk-off, the results are not very good:
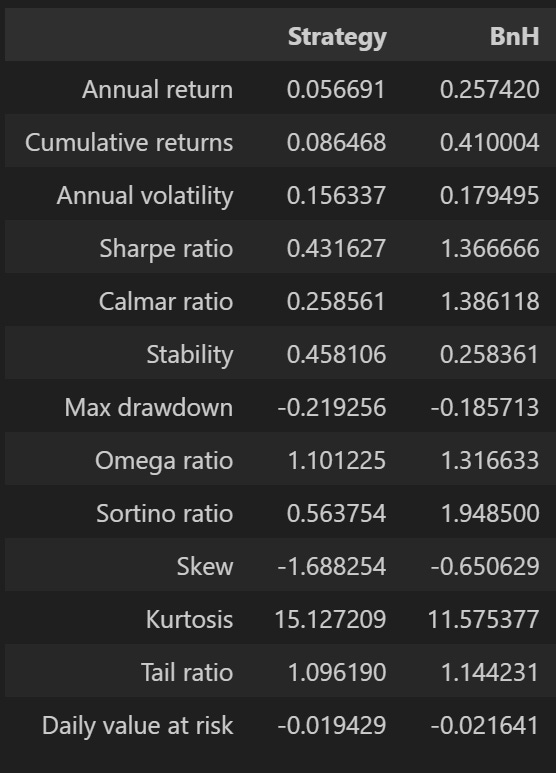
The Sharpe, Sortino and Calmar ratios are all much lower than for the buy-and-hold strategy. Bootstrapping these metrics gives the following results:
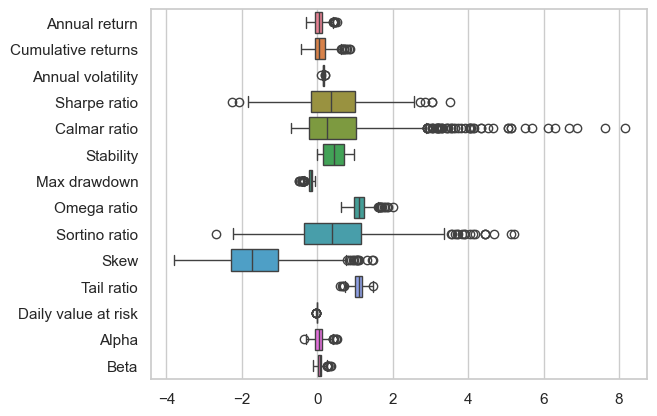
Alpha has a fairly wide distribution and is significantly larger than Beta, meaning the strategy may still have potential for further mining. The same goes for Sharpe and Sortino, although Sortino’s distribution is also very wide.
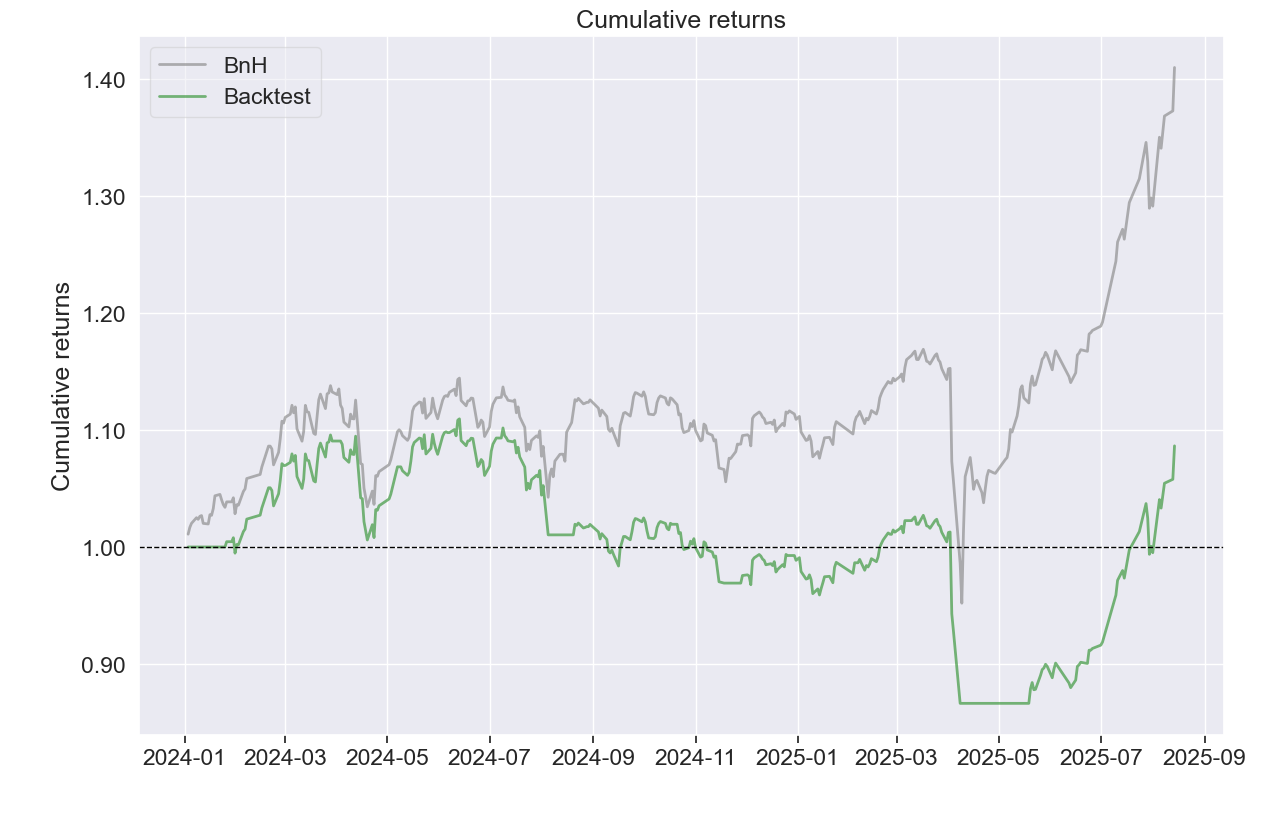
And although the strategy looked like it dodged the tariff shock, it didn’t (=]])!
Conclusion
- Market risk states can be identified, including risk-on (a stable state) and risk-off (a high-risk state).
- The model comes close to forecasting the regimes but is not yet effective (overfitting still cannot be ruled out).
- The backtest results also confirm a high degree of overfitting when trying to trade the strategy.
- The model still has potential for further mining, since the distribution of alpha looks fairly good relative to Beta. This also suggests we may be on the right track and can mine more data for better strategies.
This post has become quite long; I hope this analysis is useful to you.
Thank you, and best regards!
Technical Analysis Course – CMT Level 1
Green Chart designed this course specifically for candidates in Vietnam who want to study and prepare for the CMT Level I exam. The programme includes 28 sessions of theory, practice questions and mock exams. Students also receive the course textbook, question bank and mock exams free of charge for their exam preparation, and can retake the course for free for life.
See more details about the course here.