

Contents of this article
This post uses preliminary observations to assess the efficiency of the Vietnamese market before digging deeper into alpha mining. The approach is based on fundamental (FA) factors rather than OHLCV prices alone.
Conclusion
It appears that there is a correlation in which stock price movements can be explained by measures of profit or asset growth, specifically:
The stocks above were chosen as preliminary observations from different, distinctive sectors:
- ACB represents the banks, which are usually run through the familiar Excel model and valued on P/B or P/E. The correlation results show that profit-based methods are getting more attention from the market.
- SSI shows a fairly strong bias towards profit; in practice, SSI is also commonly valued using P/E or FCFE.
- HPG is similar, showing a higher correlation bias towards NPAT and profit measures; in practice, HPG is usually valued with FCFE or a sum-of-the-parts approach (based on its pipeline of plants).
- NLG, on the other hand, shows a higher correlation bias towards P/S, EV/EBITDA and ROIC. This is quite interesting because, when valuing real estate companies, methods such as RNAV or sum-of-the-parts are usually preferred (RNAV valuation of projects). ROIC measures the return on total invested capital (quite similar to calculating yield-on-cost in real estate).
So, as a quick shortcut, I can snapshot the valuation methods and bundle them into a pipeline that measures correlation coefficients (Spearman correlation) to identify the methods (or suitable metrics) that correlate most strongly with a stock. In the next part, I will gather these factors across all sectors to measure the distribution of these correlations and use that to assess how efficient the market is.
Introduction
I have been quite busy lately, so I have written less and have been tinkering with testing some new ideas. Now I will try to write notes as I test, to remember what is new and to systematise it.
From my student days to my working life, I have been very interested in how efficient the Vietnamese market is, mainly because it has several distinctive features, such as:
- How concentrated the market is in a few highly differentiated, large-cap sectors (financials and real estate).
- The settlement cycle (T+2.5 settlement) and long-only trading.
- The market’s fairly small capitalisation coverage.
This raises many questions, such as:
- What form of market efficiency does Vietnam have? How do we measure it?
- Is the market’s efficiency stable over time?
- If the market is strong-form efficient, is there really no way to earn profits from it?
In my view, Eugene Fama’s efficient market theory is a very elegant theory: it lays out a pivotal model of principles about prices and valuation and, from that, measures degrees of market efficiency. However, it is opposed by almost all investors (=]]), including Warren Buffett… Another scholar representing the behavioural finance school, Shiller, also rose up and published several papers against it, using behavioural finance as the pivot of his analysis.
Fama and Shiller are like the novel The Smiling, Proud Wanderer: two schools of martial arts within the same sect (=]]). If we think of finance as the Mount Hua sect, Fama represents the Qi faction with its Purple Mist Divine Skill (akin to corporate finance) – highly principled and anchored like the supreme discipline of corporate finance for valuation, showing deep inner strength. On the other side, Shiller represents the Sword faction with the Nine Swords of Dugu (akin to behavioural finance) – a branch that is very hard to learn, but broad in scope, concerned with people’s financial behaviour in order to respond to market scenarios.
This post will try to approach the question by first observing price movements against fundamental information to make a preliminary assessment of market efficiency, before moving on to testing and searching for alpha.
THE EFFICIENT MARKET HYPOTHESIS (EMH)
OK! Let me first review the efficient market. According to the CMT curriculum (Level I), an efficient market can be understood as follows: an efficient market is one in which all information is already reflected in prices, so it is very hard for investors to beat the market.
This means that if the market is always efficient and rational investors trade a large enough number of times, their average return will converge to a range equal to the market’s average. Their profits or losses can be regarded as noise in the market. This can be observed simply as follows:
Figure: Daily returns of gold prices from 2020 to date
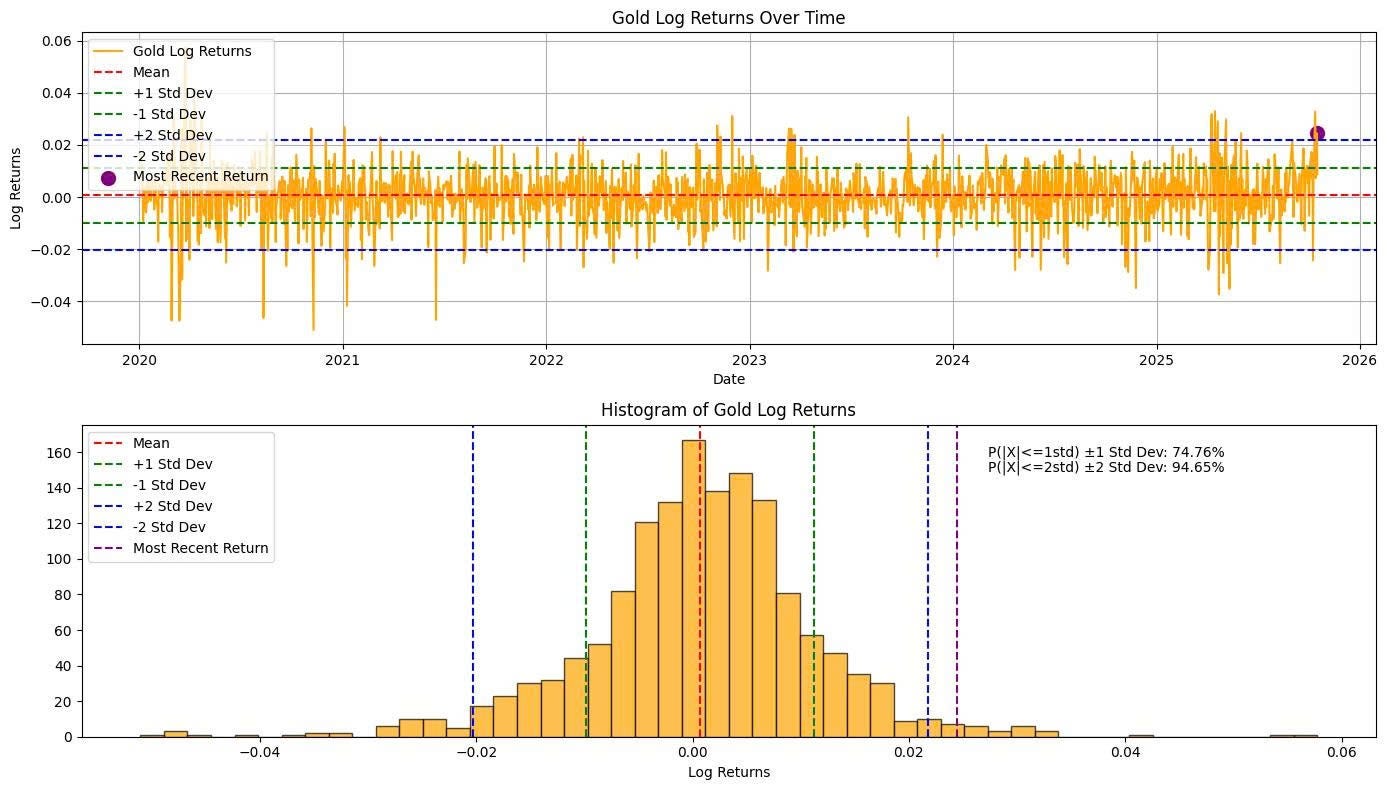
You can see that gold price returns oscillate around a mean of almost 0. Although there are periods of very large or quite small moves (known as volatility clustering), overall they oscillate around 0.
Fama explained this at length in his paper, but as I understand it, it is factors such as:
- Investors’ rational behaviour,
- Investors’ heterogeneous expectations (differences in risk appetite, holding periods and so on),
- The degree of information symmetry,
that pull price movements back to a long-term average (or one large enough to be stable). Mathematically, this can be called the law of large numbers, as values gradually converge on the average.
Some scholars did not rely entirely on this model. Jensen (the man behind the so-called Jensen’s alpha) dug deeper, especially into information asymmetry, and divided the market into three main forms:
- Weak-form efficiency: all past information is reflected in current prices —> here, price information can hardly be mined, i.e. technical analysis can hardly be mined.
- Semi-strong-form efficiency: all past information and public information (including financial statements, press releases and so on) —> here, fundamental information can hardly be mined.
- Strong-form efficiency: all past information, current public information and even insider information is reflected in prices —> here, information asymmetry hardly exists and almost nobody can beat the market.
To assess this, the CMT curriculum provides a framework, specifically:
- Weak-form EMH:
- Use public information sources for the assessment.
- Use strategies based on OHLCV to see how they perform against the market; if they can outperform, it shows the market has not yet reached weak-form efficiency.
- Semi-strong-form EMH:
- Data dependency: data plays a more decisive role in the assessment,
- Use public information in tests to assess how much of it is reflected in prices.
- Use FA-based strategies for the assessment.
- Strong-form EMH:
- Data dependency,
- Test every strategy, and you only need to show above-average returns!
What do I take away from this framework? Nothing at all (=]]). In practice, the CMT curriculum relies on proof by existing outliers such as Warren Buffett, AQR and so on, to show that the market still has anomalies investors can exploit.
OK! Enough preamble; now let me look at Vietnam.
APPLYING THE EMH IN VIETNAM
APPROACHING IT FROM OHLCV PRICES
With the CMT approach, it is very hard to pin down what exactly this framework asks me to do! Proving something scientifically requires me to reject rather than confirm. That means if I only test weak-form efficiency, I have to use whatever TA strategies I can to test it, with the goal of rejecting the null hypothesis H0 that returns are only equal to or lower than random returns!
It sounds complicated, but I can tackle it with the ARIMA model. This is a classic but very widely known model – so widely known that people have started to look down on it (=]]). In my view, it is a foundational model that gave rise to many meaningful forecasting methods later on, and it has many applications however much people disparage it!
The ARIMA(p,d,q) formula:

Where:
- y is the asset price
- e is white noise, a random variable that is independent across different times t.
ARIMA is a model with three main components:
- Autoregressive: this component explains the serial correlation of prices. If serial correlation exists, prices on previous days explain the price on the next day. By estimating the phi coefficients (the regression coefficient – the slope of today’s price on previous days’ prices), ARIMA determines how much previous days matter. Measuring AR reveals the momentum or mean reversion of prices through the phi coefficients!
- Moving Average: this is not a moving-average line; it is an average of white noise weighted by a theta coefficient. Why include it? Because the noise e at different times can still affect current or expected prices, and it is interpreted as the effect of short-term shocks on prices.
- Integration: this is simply the stationarity of the time series, used to choose the most suitable degree of differencing so that the values are best normalised.
This model and its variants (such as SARIMAX) mostly use only past price information to predict future prices. If I call my prediction model arima and the actual price after prediction y, I get an equation like this:

Where:
- y is the actual price; note that this is the price in the test period, not the period used to train the arima model.
- arima is the model that predicts price from past information,
- e is the residual between the predicted price and the actual price.
If past prices predict well, then e is random – what the theory calls white noise. White noise is simply a random variable.
If the equation is written this way and e is white noise, then price y is said to follow a random walk.
So simply by testing whether e is white noise, I can determine whether the market is weak-form efficient!
In fact, quite a few papers have used ARIMA to test market efficiency. Some models even add GARCH for greater generality (GARCH is a very powerful model for forecasting asset volatility), or use machine learning for the assessment.
If I kept going down this route, it would be nothing new! I will leave this part here for when I have time, or for anyone who wants to pick it up. I will take a different approach (because I like it) which I think is more necessary.
APPROACHING IT FROM FUNDAMENTAL FACTORS
I think this approach is more hardcore – not because the statistical model is more hardcore, but because the data is! It also depends on the user’s knowledge of corporate finance and valuation. Finance is vast, and my knowledge is fairly modest: I have plenty of hands-on experience, but I still need to work on the academic side. Still, I will try to draw first on the approaches of sources I consider the most authoritative and rigorous!
First, looking at charts of ACB, SSI, HPG and NLG (representing banks, brokerages, steel and real estate) and how their stock prices moved against measures such as book value (BV) or NPAT, I have the following observations:
ACB: quarterly TTM figures for NPAT
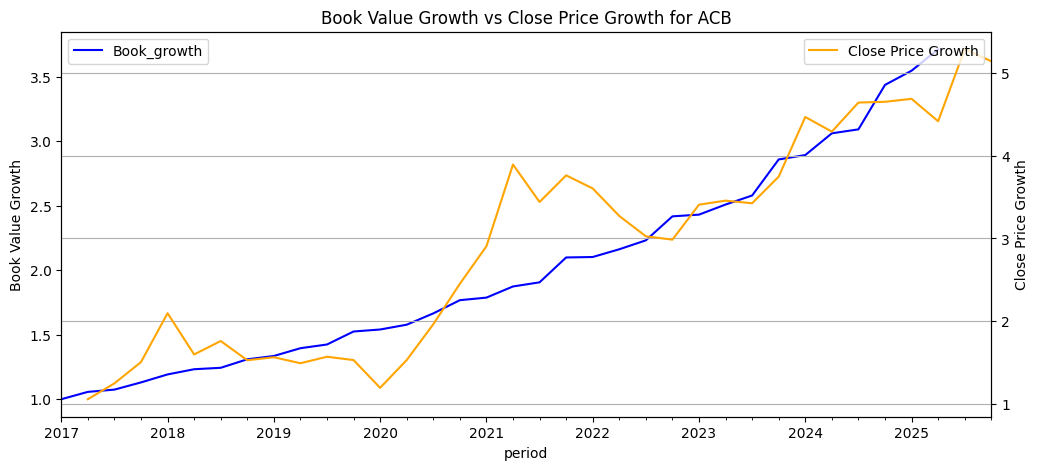

ACB seems to correlate quite closely with BV growth, while its profits move somewhat differently although in the same general direction.

More specifically, using Spearman correlation, changes in book value, NPAT, ROE (inversely) and NPL clearly have good explanatory correlation with the stock’s return in the same accounting period (same-quarter return).
SSI:


For SSI, NPAT clearly tracks the price expectations within the period very well, and significantly better than the factors above.
HPG:


HPG is similar to SSI, correlating quite well with changes in profit measures such as NPAT (or P/E, EV/EBITDA) compared with all the other factors.
NLG:


NLG is a rather special case: higher correlations with P/S, EV/EBITDA and ROIC (inversely) dominate, suggesting that price seems to be pricing in these factors more.
Conclusion
The stocks above were chosen as preliminary observations from different, distinctive sectors:
- ACB represents the banks, which are usually run through the familiar Excel model and valued on P/B or P/E. The correlation results show that profit-based methods are getting more attention from the market.
- SSI shows a fairly strong bias towards profit; in practice, SSI is also commonly valued using P/E or FCFE.
- HPG is similar, showing a higher correlation bias towards NPAT and profit measures; in practice, HPG is usually valued with FCFE or a sum-of-the-parts approach (based on its pipeline of plants).
- NLG, on the other hand, shows a higher correlation bias towards P/S, EV/EBITDA and ROIC. This is quite interesting because, when valuing real estate companies, methods such as RNAV or sum-of-the-parts are usually preferred (RNAV valuation of projects). ROIC measures the return on total invested capital (quite similar to calculating yield-on-cost in real estate).
So, as a quick shortcut, I can snapshot the valuation methods and bundle them into a pipeline that measures correlation coefficients (Spearman correlation) to identify the methods (or suitable metrics) that correlate most strongly with a stock. In the next part, I will gather these factors across all sectors to measure the distribution of these correlations and use that to assess how efficient the market is.
This post is already long; I hope it is useful to everyone. Thank you!
Technical Analysis Course – CMT Level 1
Green Chart designed this course specifically for candidates in Vietnam who want to study and prepare for the CMT Level I exam. The programme includes 28 sessions of theory, practice questions and mock exams. Students also receive the course textbook, question bank and mock exams free of charge for their exam preparation, and can retake the course for free for life.
See more details about the course here.