
Contents of this article
Moving closer to our goal of measuring a portfolio’s risk (variance), in this article we look at the correlation coefficient and the correlation matrix. In earlier articles, we learned how to calculate the variance–covariance matrix, although on its own it does not mean much. It is, however, one of the key inputs we use in this article.

What is the correlation coefficient, and what does it mean?
The correlation coefficient is a statistic that measures the strength of the relationship between two variables. Its value lies between -1 and 1. A negative correlation means the two variables move in opposite directions (perfectly inversely at -1); conversely, the two variables are positively correlated when the coefficient is positive (perfectly together at 1).
So the closer the absolute value of the correlation coefficient is to 1, the stronger the relationship between the two variables. When it equals 0, the two variables are completely independent of each other.
How is the correlation coefficient calculated?
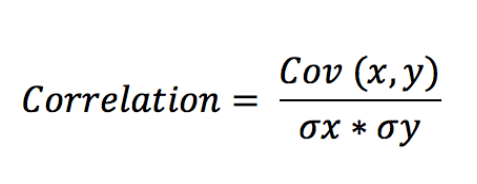
The correlation coefficient between any two variables is calculated with the following formula:
Where:
Cov(x,y) is the covariance of x and y
σx is the standard deviation of x
σy is the standard deviation of y
The formula above is easy to apply with two stocks. But how is correlation determined for a five-stock portfolio? Here we need to use matrix operations.
In that case, the portfolio’s correlations are expressed as a correlation matrix between the stocks, of size n × n. So for the five-stock portfolio from the previous chapter, we need a 5 × 5 matrix.
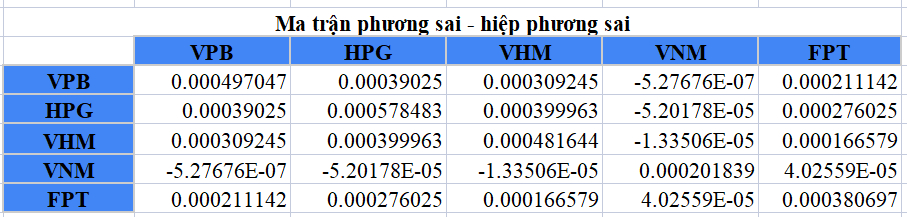
Using the same five stocks – VPB, HPG, VHM, VNM and FPT – we have the following variance–covariance matrix:
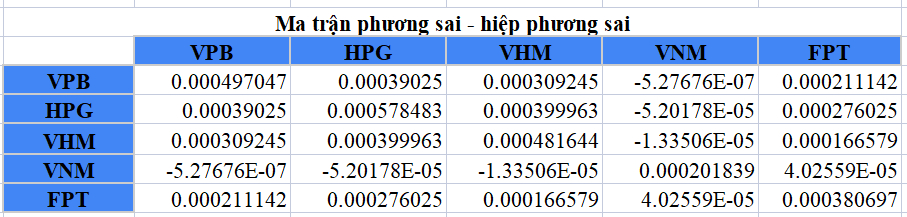
Based on the formula and the covariances already calculated in the matrix above, we now need the denominator: the product of the standard deviations of the stocks in the portfolio.
To do this, we first calculate the standard deviation of each individual stock. This is fairly simple, since the square root of the variance is the standard deviation. Just use Excel’s “STDEV()” function on a stock’s daily return series, and the result is the standard deviation of that stock’s returns.

The step above only gives us each stock’s own standard deviation; what we need now is the product of standard deviations for each pair of stocks in the portfolio. The most common way is to build a matrix by multiplying the column of standard deviations by its transpose (the same values laid out as a row). Specifically:
First, set up a 5 × 5 matrix as follows:

Next, multiply the column of standard deviations calculated earlier by its own transpose (turning the column into a row). The illustration below makes this step clear:

Always remember to use ‘Ctrl + Shift + Enter’ for matrix or array operations in Excel.

(1)
Looking back at the correlation formula:
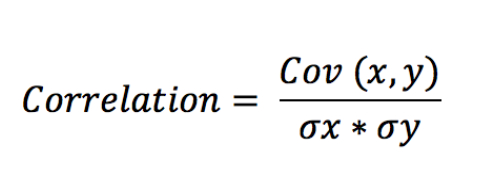
We can see that the numerator is the portfolio’s variance–covariance matrix (the result from the previous chapter) and the denominator is the standard deviation matrix we have just built.
(2)
So to get the correlation matrix, we simply divide matrix (2) by matrix (1), element by element.

The correlation matrix looks like this:

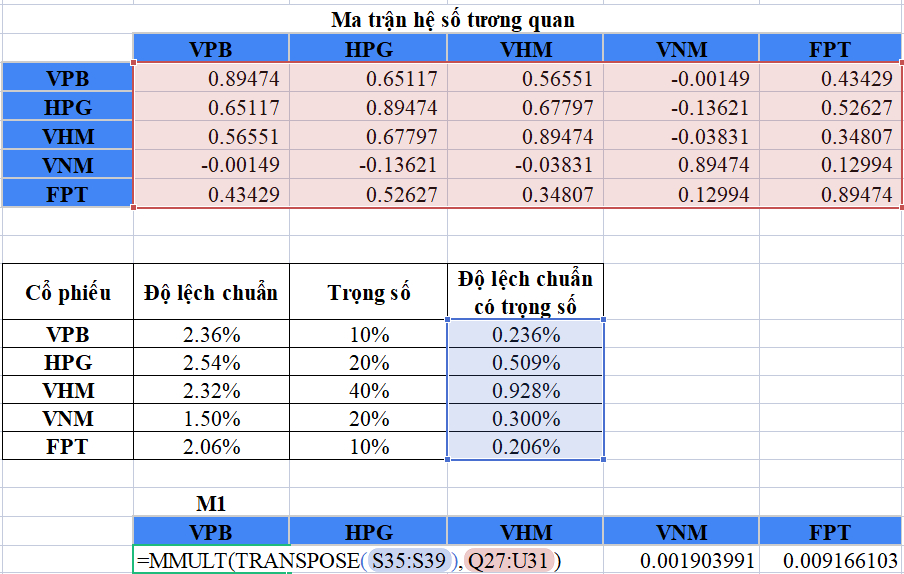
The matrix shows the correlation between each pair of stocks. For example, HPG and VPB have a correlation of 0.65117. This value is the same when we look at the pair VPB and HPG, which is why the matrix is symmetrical about its diagonal.
Normally, the correlation of a variable with itself, shown on the diagonal of the matrix, is always 1. In this example, however, because the data covers a relatively short period (the trading days in one month), the values are only high and do not reach the maximum of 1.
Portfolio variance
Having calculated the portfolio’s correlation matrix in the previous section, we now analyse the portfolio’s risk by calculating its variance.
First, we need the weight of each stock in the portfolio – how much money you put into each of the five stocks above. Suppose that with $1,000 of available capital, I allocate the portfolio as follows:
- VPB $100 (10%)
- HPG $200 (20%)
- VHM $400 (40%)
- VNM $200 (20%)
- FPT $100 (10%)
The next step is to calculate the weighted standard deviation. The weighted standard deviation is simply a stock’s weight multiplied by its standard deviation. For example, VPB’s standard deviation is 2.36%, so its weighted standard deviation is 10% × 2.36% = 0.236%
The results are as follows:

*Note: the weights of the stocks in a portfolio must add up to 100%
We now have everything we need to calculate the “portfolio variance“. The formula is:
Portfolio variance = Square root (transpose of the weighted standard deviations × correlation matrix × weighted standard deviations)
This is done in three steps:
Step 1. Multiply the weighted standard deviations by the correlation matrix, then transpose the result to get a matrix with five columns. Call this matrix M1; the calculation and result are as follows:
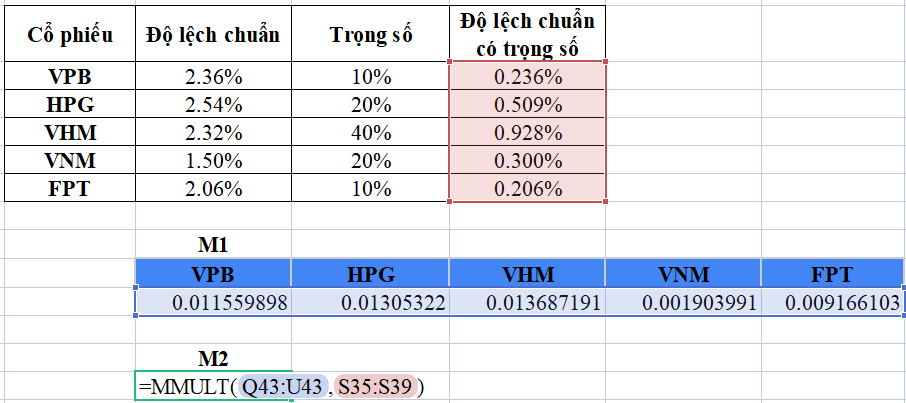
Step 2. Multiply this matrix by the weighted standard deviations; the result is a single number, M2:
Step 3. Take the square root of this number to get the portfolio variance
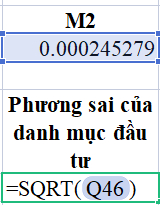
The result is 1.57%, the portfolio variance of the five-stock portfolio we were looking for.
We have now found the final value we set out to calculate in this series. In the next article, we will explain more clearly what this number means.
Happy Trading !
The “Stock Trading For A Living” Course
Green Chart designed this course to give students a solid foundation in fundamental analysis and stock valuation, and to show them how to integrate it effectively into their existing trading system, especially for traders who already use technical analysis. The programme includes five theory sessions and six months of hands-on trading practice in the real market with the lecturer.
See full course details here.