Contents of this article
Have you ever traded a stock that was falling sharply, then suddenly reversed and rallied for a short while? Right after that rally, your stock turned down again and plunged even lower than before it bounced. This is an example of a bull trap, which we will look at more closely below.
What is a bull trap in the stock market?
What is a bull trap? What is a bull trap in the stock market?
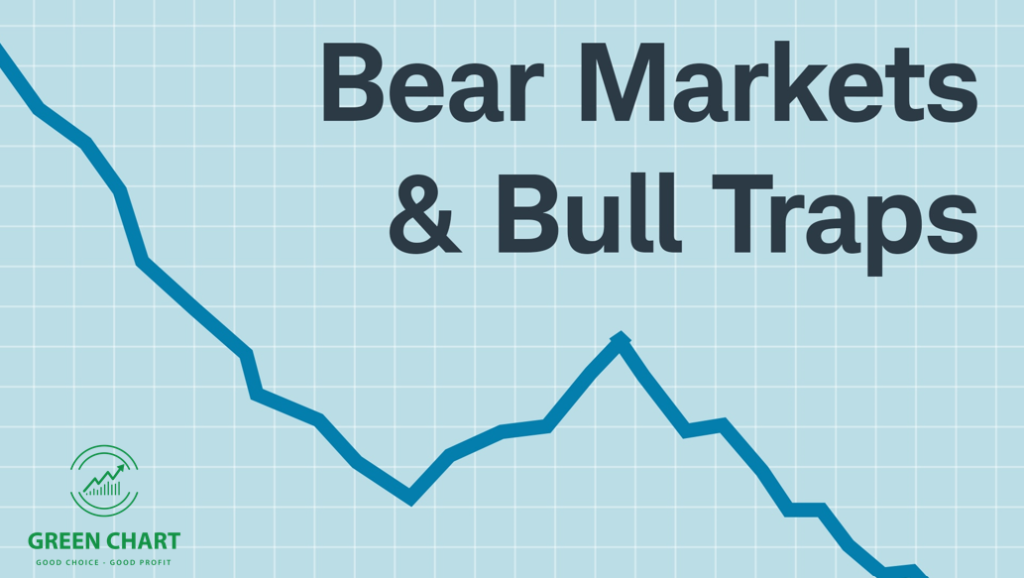
A bull trap is a false trading signal that misleads investors into believing that the market or a stock is likely to reverse from a decline into a rally, when in fact sellers are still firmly in control and the market keeps falling right afterwards.
Imagine stock XYZ is performing fairly well, with a market price of VND 50,000 per share. Then XYZ stalls and falls to VND 30,000 per share over a few months. After reaching VND 30,000, XYZ starts climbing again to VND 35,000. At this point, investors start buying, expecting XYZ to return to its previous high. But XYZ keeps falling, even making a new low at VND 20,000.
What is a bull trap? What is a bull trap in the stock market?
What causes a bull trap?
Here are some common causes:
Manipulation by “sharks”: investors with large amounts of capital keep placing buy orders to create the rising trend they want, drawing retail investors into the stock so that they can offload their shares. Small, inexperienced investors find it very hard to tell which signals are genuine and are easily pulled into this false trend. Once the sharks have unloaded their positions, they stop supporting the price and it returns to its downtrend.
Unexpected, misleading events or news: when unexpected but misleading or false news hits the market, many investors without firm convictions pile in, pushing the price up temporarily.
How to recognize a bull trap
Bull traps frequently appear at resistance zones. When price breaks above resistance, investors feel that the uptrend is resuming and are tempted to buy. But then price falls back below resistance, showing that at this point it no longer has the strength to go higher.
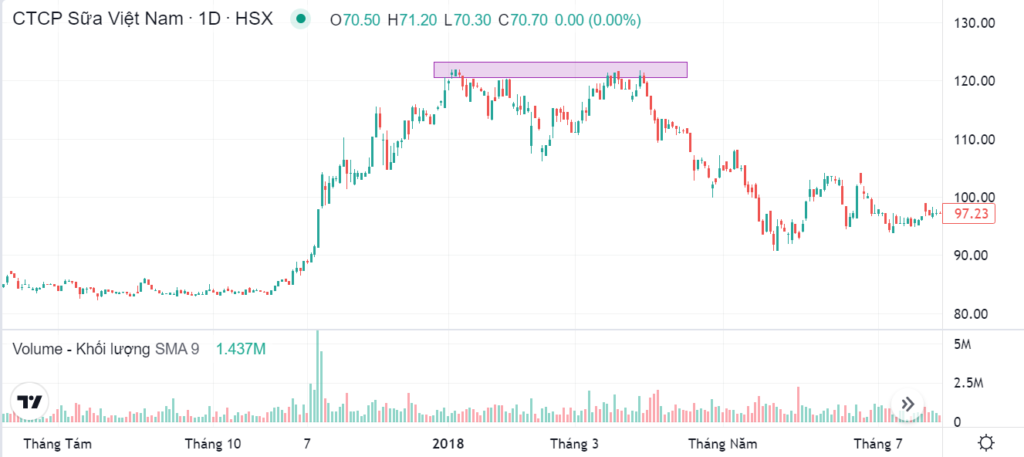
Bull traps frequently appear at resistance zones. Example: VNM stock
Above is an example from VNM: when price rose above resistance, many investors were fooled into buying, but when selling pressure returned, price resumed its downtrend. The stock was in a medium-term downtrend, yet several candles broke above the previous high. However, the first breakout candle came on very heavy volume, while volume on the second and third candles dropped very low. This shows that price no longer had the strength to keep rising, because money flow was weak. The next two sessions saw low volume because nobody was buying, so that high-volume up candle became the top.
A bull trap is often one of the reasons a double top forms, signalling a strong reversal.
Bull traps can also appear where price meets a downtrend line. When price crosses above a downtrend line, investors feel the trendline has been broken and the trend will turn from down to up. In reality, price turns back and continues its downtrend, leaving many investors stuck in the trap.
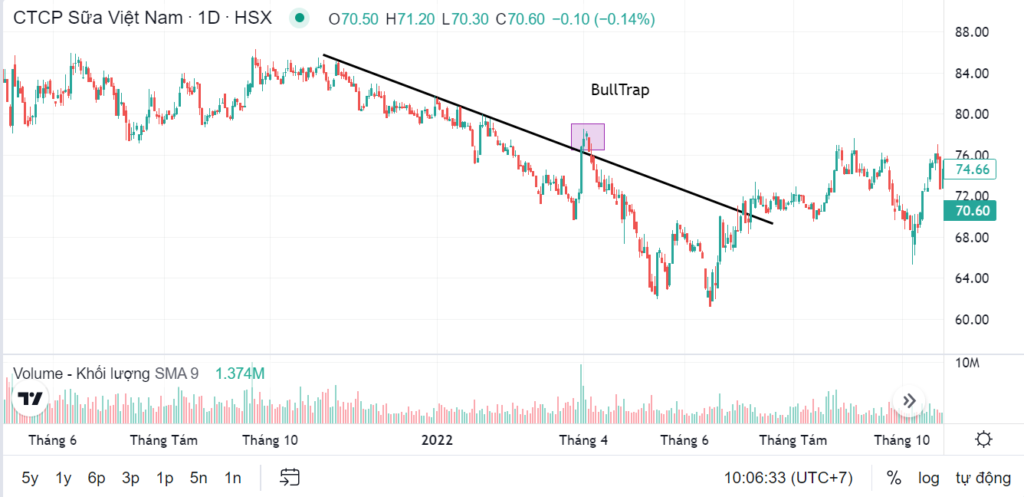
Bull traps can also appear where price meets a downtrend line.
How to avoid bull traps
Investors should build a solid knowledge of technical analysis. And never forget that technical analysis is, at heart, the analysis of crowd psychology and behaviour. Analyse the crowd; do not get swept along by it.
When you open a position, set your take-profit and stop-loss at the same time. Defining your exit points in advance like this will significantly reduce your losses if you do fall into a bull trap.
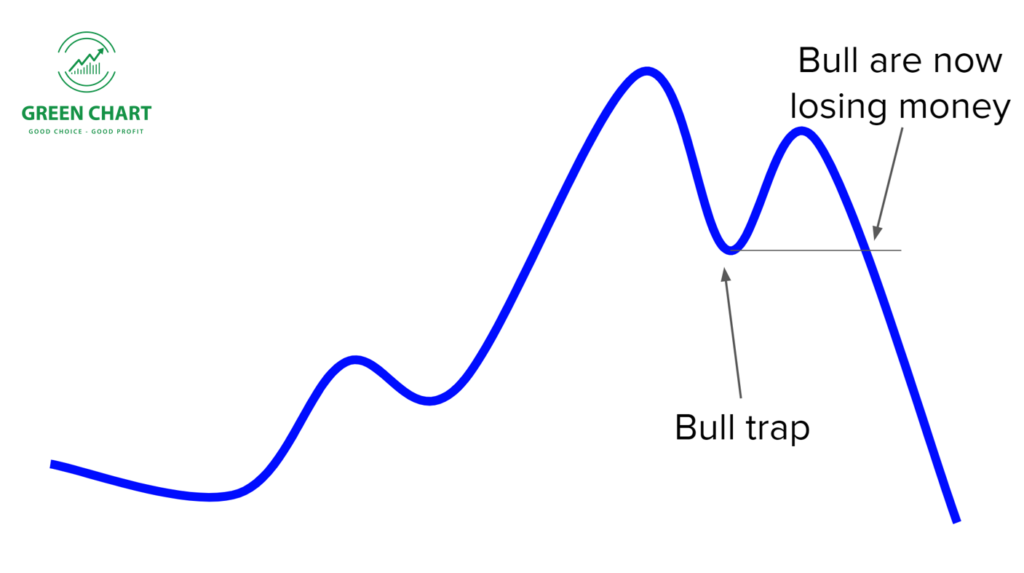
How to avoid bull traps
Investors can also avoid bull traps by looking for confirmation after a breakout, especially a clear volume signal before entering, followed by a candle that closes with a convincing signal; the candle pattern that breaks resistance should be a strong one. It can be very hard to tell a bull trap from a genuine reversal in a security’s price trend. We should analyse stocks together with other technical indicators, such as moving averages, to filter out the noise in price action.
For example, a trader might look for above-average volume and wait for confirmation from bullish candles after the breakout to confirm that price is likely to go higher. A breakout on low volume with indecisive candles, such as a doji, may be a sign of a bull trap.
Happy trading!
The “Stock Trading For A Living” course
Green Chart designed this course to give you a solid grounding in fundamental analysis & stock valuation, and to show you how to integrate it effectively into your existing trading system, especially if you already trade with technical analysis. The programme includes 5 theory sessions and 6 months of hands-on trading guidance in the live market with the lecturer.
Find out more about the course here.