Contents of this article
- What is the Fibonacci sequence?
- What is Fibonacci retracement?
- How to draw Fibonacci retracement
- Using Fibonacci retracement in trading
- Fibonacci retracement levels combined with reversal candlestick patterns
- Fibonacci retracement levels combined with barriers (support & resistance, trendlines…)
- Technical Analysis Course – CMT Level 1

Mathematics always has fascinating applications in everyday life. The stock market is no exception: movements in price, volume, time and so on are fertile ground for mathematical work. One of the most “familiar” applications of this dry subject is the Fibonacci sequence and its properties. Let’s explore with GreenChart how Fibonacci retracement is applied, and add a very useful mathematical tool to your investing toolkit.
What is the Fibonacci sequence?
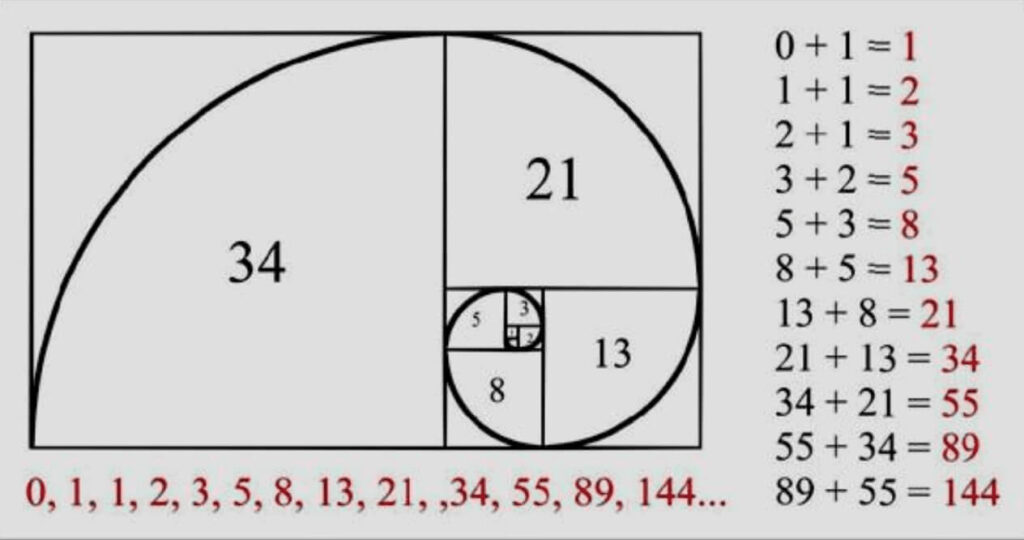
The Fibonacci sequence is found everywhere in nature. Even in stocks, and in financial markets in general, Fibonacci retracement is a fascinating topic. To fully understand and properly appreciate Fibonacci retracement, we need to understand the Fibonacci sequence. The origins of the Fibonacci sequence can be traced to ancient Indian mathematical writings, some dating back to 200 BC. Later, in the 12th century, Leonardo Pisano Bogollo, an Italian mathematician from Pisa known to his friends as Fibonacci, discovered the Fibonacci sequence.
The Fibonacci sequence is a series of numbers starting from 0, arranged so that each number is the sum of the two numbers before it.
A simple Fibonacci sequence looks like this:
0, 1, 1, 2, 3, 5, 8, 13, 21, 34, 55, 89, 144, 233, 377, 610…
Note the following:
233 = 144 + 89
144 = 89 + 55
89 = 55 + 34
The sequence continues indefinitely. And once the numbers in the Fibonacci sequence are large enough, a property emerges: divide any number in the sequence by the one before it and the ratio is always approximately 1.618.
For example:
610/377 = 1.618
377/233 = 1.618
233/144 = 1.618
The ratio 1.618 is known as the Golden Ratio, also called Phi. Fibonacci numbers are connected with nature. The ratio can be found in human faces, flower petals, animal bodies, fruit, vegetables, rock formations, galaxy formations and so on. Back to the main topic: for those who are interested, I recommend searching the internet for examples of the golden ratio – you will find many surprising things. Digging deeper into the ratio’s properties, there is a remarkable consistency when a number in the Fibonacci sequence is divided by the number immediately after it.
For example:
89/144 = 0.618
144/233 = 0.618
377/610 = 0.618
At this step, remember that 0.618 expressed as a percentage is 61.8%.
A similar consistency appears when any number in the Fibonacci sequence is divided by the number two places higher.
For example:
13/34 = 0.382
21/55 = 0.382
34/89 = 0.382
0.382 expressed as a percentage is 38.2%.
There is also consistency when a number in the Fibonacci sequence is divided by the number three places higher.
For example:
13/55 = 0.236
21/89 = 0,236
34/144 = 0,236
55/233 = 0,236
0.236 expressed as a percentage is 23.6%.
What is Fibonacci retracement?
First, recalling the article on Dow Theory, we need to understand that the term “retracement” means “a pullback”, similar to the term “correction”. That is, price temporarily corrects (moves against) the main trend.
Technical analysts believe the Fibonacci ratios – 61.8%, 38.2% and 23.6% – can be applied to stock charts. Fibonacci analysis can be applied whenever there is a notable move up or down in price. Whenever a stock rises or falls sharply, it usually tends to retrace before resuming the trend. For example, if a stock has risen from 50 to 100, it may pull back to perhaps 70 before rising to 120.
“Forecasting retracement levels” is a technique for identifying where a retracement is likely to occur. These retracement levels give traders good opportunities to find safe buy/sell entries in the direction of the trend. Fibonacci retracement, with the Fibonacci ratios of 61.8%, 38.2% and 23.6%, is a great tool to help traders identify price’s retracement levels. Traders can use these levels to look for buy/sell opportunities in line with the trend.
Look at the chart below: a daily chart of TCB

Now I identify TCB’s move from 39 -> 59: TCB moved by 20 price points, which we take as the Fibonacci upswing. According to Fibonacci retracement theory, after a rise one can anticipate the stock’s subsequent correction to the Fibonacci ratios. For example, the first level the stock may correct to could be 23.6%. If the stock keeps correcting, traders can watch the 38.2% and 61.8% levels.
Note that in the example shown below, the stock fell to 61.8%, which coincides with 46.8, before resuming its rise.
We can also arrive at 46.8 with a simple calculation
Total size of the upswing = 20
61.8% Fibonacci of the upswing = 61.8% * 20 = 12.3
61.8% retracement level: 59 – 12.3 = 46.7
Similarly, we can calculate 38.2% and the other ratios. However, there is no need to do this by hand, because charting tools do it for us.
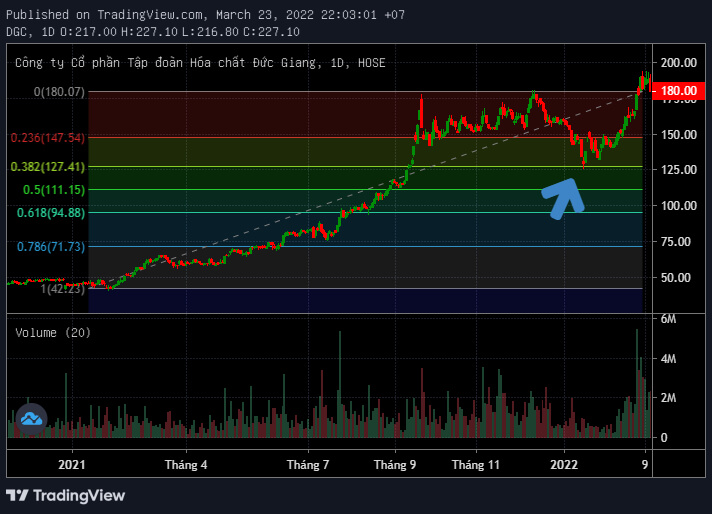
Here is another example in which the share price (DGC) rose from 42 to 180. The 138-point move therefore forms the Fibonacci upswing. The stock pulled back 38.2% to 127 before resuming its rise.
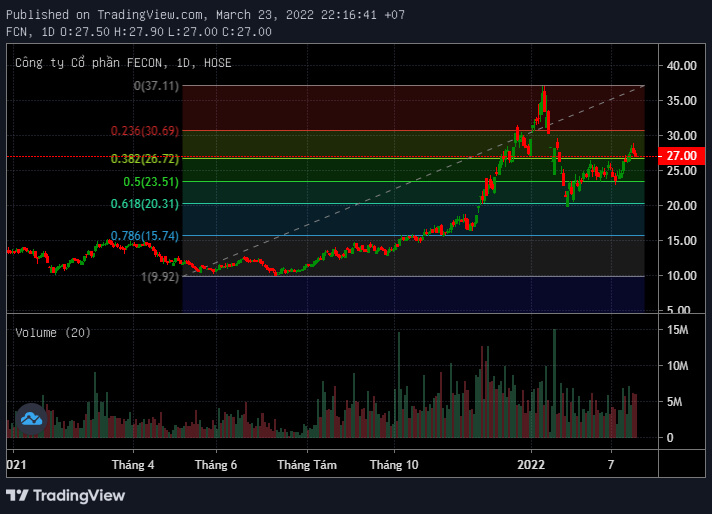
Fibonacci retracement lines can also be applied to falling stocks to identify levels to which the stock may rebound. In the chart below (FCN), the stock fell from 37 to 20, creating a 17-point Fibonacci downswing.
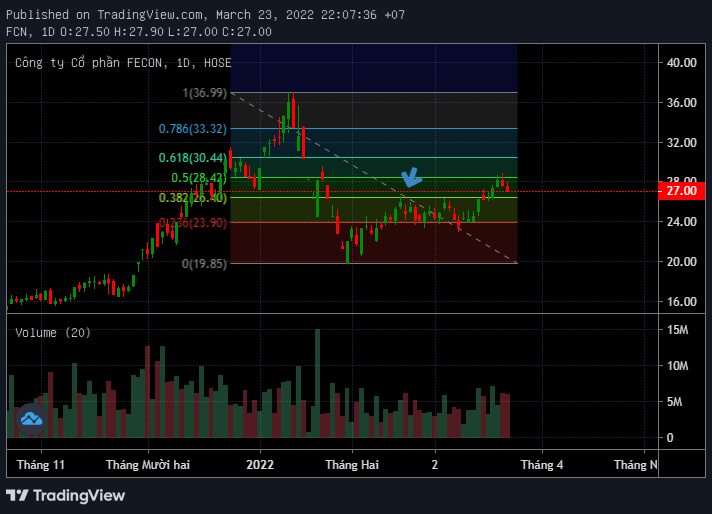
After the decline, the stock tried to recover and rebounded to 26.4, the 61.8% Fibonacci retracement level.
How to draw Fibonacci retracement
As we know, Fibonacci retracement levels are moves on the chart against the trend. To use Fibonacci retracement, we should first identify the 100% Fibonacci move. The 100% move can be a period of rising or falling price. To mark the 100% move, we pick the most recent peak and trough on the chart. Once these are identified, we connect them using the Fibonacci retracement tool available in most technical analysis software and in the online price boards of brokerage firms.
Here is a step-by-step guide:
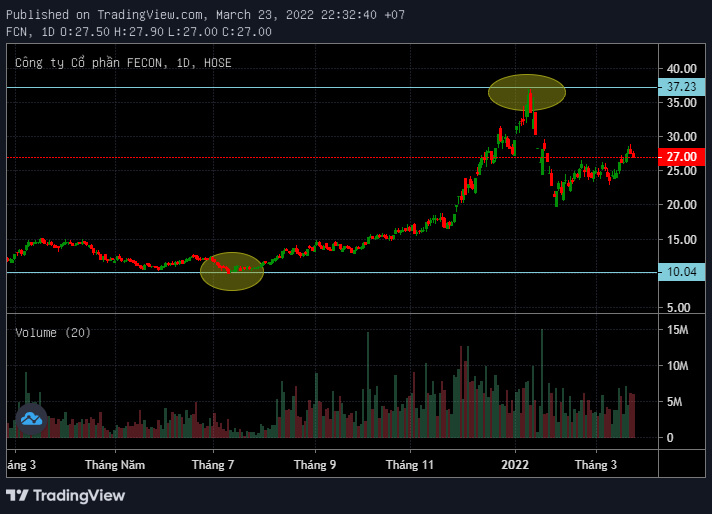
Step 1: Identify the starting and ending trough and peak. In this case, the trough is at 10 and the peak at 37. The 27-point rise corresponds to 100%.
Step 2: Select the Fibonacci retracement tool from the charting tools
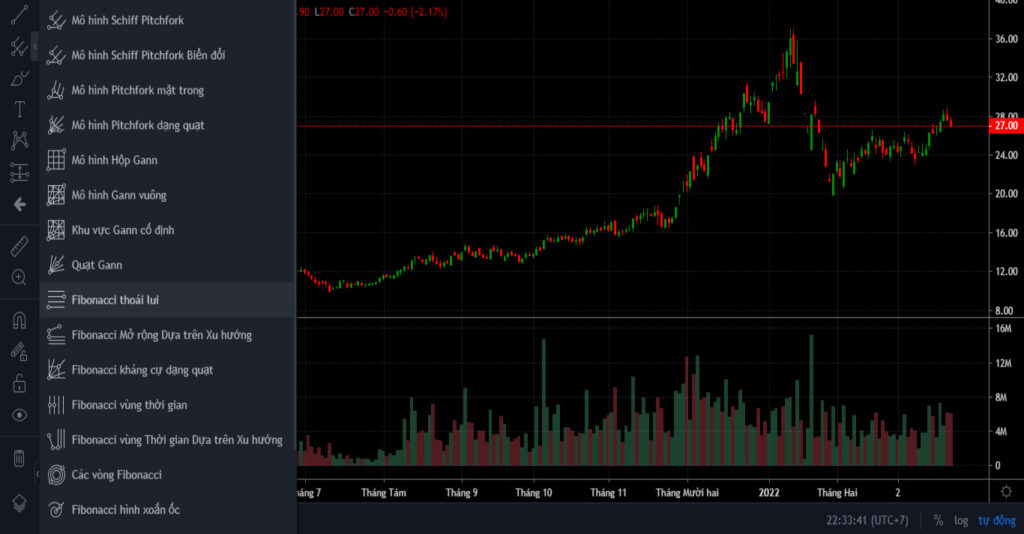
Step 3: Use the Fibonacci retracement tool to connect the trough and the peak.
Using Fibonacci retracement in trading
Imagine you want to buy a particular stock but couldn’t, because it rallied sharply. In that situation, the most prudent course is to wait for the stock to retrace. Fibonacci retracement levels such as 61.8%, 38.2% and 23.6% act as potential levels to which the stock may correct.
By drawing Fibonacci retracement levels on the chart, traders can identify price’s retracement levels and look for very safe buy/sell entries in the direction of the trend. However, note that, as with any indicator, Fibonacci retracement should be used as a tool that provides signals, not as the deciding factor.
Traders combine Fibonacci retracement analysis with other technical signals to make the most effective buy/sell decisions and increase accuracy and reliability. For example, traders tend to buy if price action shows:
- A Fibonacci retracement level combined with a reversal candlestick pattern.
- A Fibonacci retracement level combined with a barrier (support and resistance, trendlines…).
Or traders can combine even more factors to make buy/sell decisions.
Along with the points above, if the stop-loss also coincides with a Fibonacci level, I have the opportunity to set up a trade that fits well in every respect, and so I will buy. The word “strong” indicates the degree of confidence in the trade setup. The more confirming factors we use to study the trend and reversals, the stronger the signal. The same logic can be applied to short-term trading.
Fibonacci retracement levels combined with reversal candlestick patterns
When combining the Fibonacci retracement tool with Japanese candlesticks, the idea is to look for reversal candlestick patterns reacting at Fibonacci retracement levels.
When the buying or selling pressure of the correction is exhausted, as shown by the structure of the candlestick pattern, that gives a basis for when price ends its correction and resumes the original trend.


Fibonacci retracement levels combined with barriers (support & resistance, trendlines…)
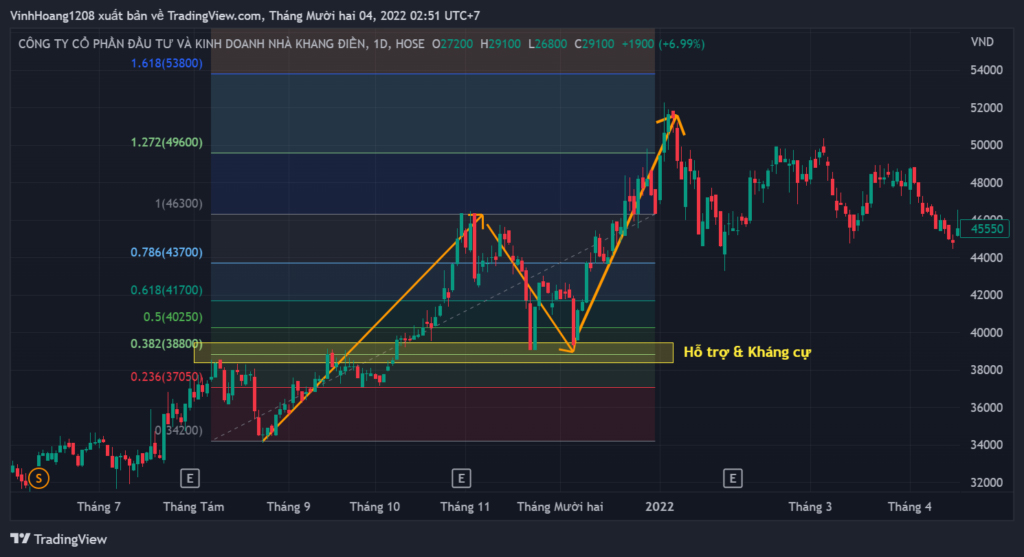
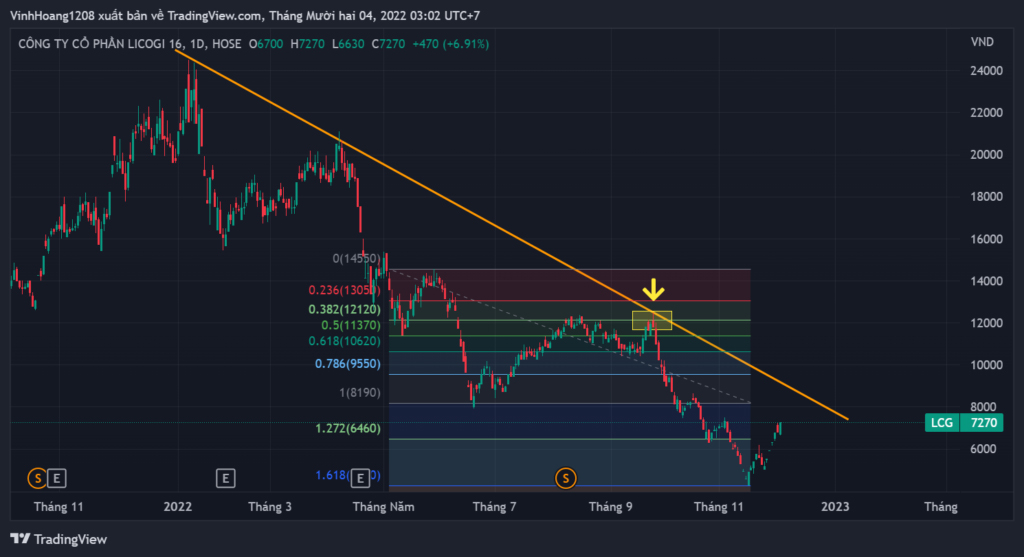
From the lesson on support & resistance, we know that price usually reacts at barriers such as support and resistance or trendlines. For example, in an uptrend, when price rises to a resistance level, it may meet selling pressure there. Whether or not the trend continues, there is almost always a reaction.
So combining barriers (support and resistance, or trendlines) with Fibonacci retracement is one of the best signals for finding price reversal points.
A confluence zone between a Fibonacci retracement level and a support/resistance zone or trendline is more likely to be a price reversal point than other levels.
Technical Analysis Course – CMT Level 1
Green Chart designed this course specifically for candidates in Vietnam who want to study and prepare for the CMT Level I exam. The programme includes 27 sessions of theory, practice questions and mock exams. Students also receive the course textbook, question bank and mock exams free of charge for their exam preparation, and can retake the course for free for life.
See more details about the course here.
Happy trading !