Contents of this article
Most experienced traders use the Fibonacci retracement tool at some point in their trading. Some use it only occasionally, while others use it regularly. But however often you use it, what matters most is using it correctly.

Applying technical analysis methods incorrectly leads to damaging results, such as suboptimal entries and a growing number of losing trades. In this article, we point out the mistakes traders make when applying Fibonacci retracements in financial markets. Understanding them can help you avoid these common errors and the unnecessary losses that come with them.
Don’t “mix” reference points when drawing
When drawing Fibonacci retracements, keep your reference points consistent. If you take the low of a trend from a candle’s real body, then the high to which you draw the retracement should be the real body at the end of the trend: draw from body to body. Likewise, if you take the low of a trend from a candle’s wick (shadow), then the high should be the wick at the end of the trend: draw from wick to wick.
If you mix reference points – drawing from a wick to a body – your analysis may be flawed. Let’s look at an example on the EUR/CAD currency pair (euro/Canadian dollar). The chart below shows the consistent approach: the Fibonacci retracement is drawn wick to wick, from the high at 1.3777 to the low at 1.3344. This produced a clear resistance level at 1.3511 (the 38.2% Fibonacci level); price reacted lower when it touched this retracement level and later broke through it as the pair kept rising.

The next chart, on the other hand, shows an inconsistent approach. The Fibonacci retracement is drawn from a body (1.3742) to a wick (1.3344). As a result, the Fibonacci resistance level is cut through by bullish candles before price starts to fall.
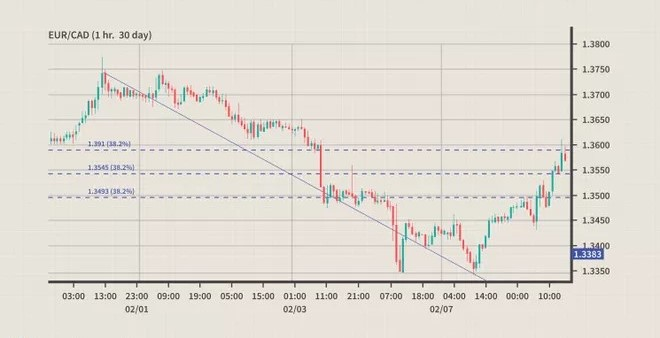
By drawing Fibonacci retracements consistently, the support and resistance levels based on the golden ratio become clearer to the naked eye, making your analysis and judgements more effective and accurate.
Don’t ignore longer-term trends
New traders often try to measure short-term price moves without considering the bigger, broader picture. This narrow view can make short-term trades go wrong, with a higher chance of ending in a loss. Recall our articles on Dow Theory and our detailed guide to Fibonacci retracements: we use Fibonacci retracements to measure the levels an intermediate trend may pull back to before price resumes moving with the primary trend.
By following the long-term trend, traders can apply Fibonacci retracement levels more accurately and effectively. In the chart below, we see that the long-term (primary) trend of GBP/NZD (British pound/New Zealand dollar) is up. Applying a Fibonacci retracement, we see that the pair’s first support level is 2.1015 (the 38.2% Fibonacci level). This is the perfect place to watch for other confirming signals before opening a long position.

The picture looks very different if we view it in the short term.

After the pair rallies, we might see a potential selling opportunity on the 5-minute timeframe. This is the trap. By not sticking with the long term, the short seller applied a Fibonacci retracement from the 2.1215 high down to the 2.1024 low (11 February), resulting in a short position at 2.1097 (the 38.2% Fibonacci level).
This short trade gave the trader a decent 50-pip profit. But without taking profit at that point, the trader would have paid for it with a 400-pip move the other way as price continued with the primary trend. A better trading plan would have been to go long GBP/NZD with short-term support at 2.1050.
Don’t rely on Fibonacci alone
Fibonacci retracements can provide reliable static support and resistance levels, but an effective trade setup needs other confirming signals as well.
Adding technical tools such as the MACD indicator or the Stochastic provides additional confirmation for trade setups, which can significantly raise the win rate of your trades.
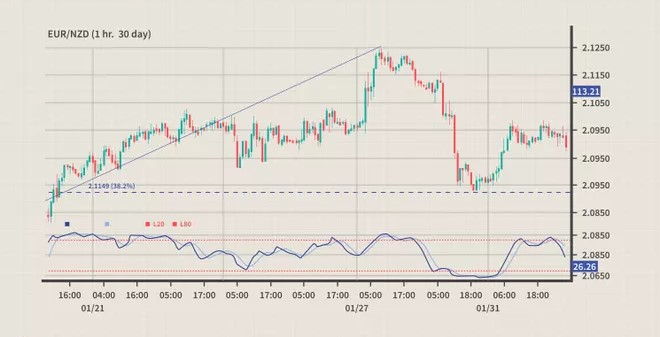
In the chart below, we see an intermediate-term corrective decline in the euro/New Zealand dollar pair. From 10 January 2011, EUR/NZD rose to a high of 2.1250 over nearly two weeks. Applying the Fibonacci retracement tool, we see price fall back to the 38.2% retracement at 2.1149 (from the 2.1250 high) on 30 January. After price touched the retracement level, the Stochastic also confirmed that momentum had dropped into oversold territory. A trader who went long at this point would have made a 50-pip profit as price rose from 2.1149 to 2.1200 over the next few days.
Using Fibonacci for short-term trading
Day trading the foreign exchange market is exciting, because the market is highly volatile. Along with that excitement, however, comes the risk of losses if you do not prepare thoroughly before entering a trade.
Because the market is so volatile, applying Fibonacci retracements on short timeframes is not effective. The shorter the timeframe, the less reliable the retracement levels. High volatility can easily distort Fibonacci support and resistance levels, making it very hard for traders to choose which level to trade. On top of that, liquidity sweeps (stop hunts) are very common in the short term. This can make placing a stop-loss or take-profit especially difficult, because market movement is so noisy. Just look at the Canadian dollar/Japanese yen example below.

In the chart above, suppose we try to apply a Fibonacci retracement to price moves on the 3-minute CAD/JPY chart. Volatility here is very high, producing candles with very long wicks, and the Fibonacci retracement levels are on average only 6 pips apart. That makes analysing price action at these support and resistance levels harder and less accurate.
Remember that, as with any other statistical study, the more observations you use, the more accurate and effective the analysis. Using larger timeframes when applying Fibonacci retracements can improve the reliability and effectiveness of the golden-ratio levels.
Happy trading !
Technical Analysis Course – CMT Level 1
Green Chart designed this course specifically for candidates in Vietnam who want to study and prepare for the CMT Level I exam. The programme includes 27 sessions of theory, practice questions and mock exams. Students also receive the course materials, question bank and mock exams free of charge, and can retake the course for free for life.
See full course details here.