Contents of this article

Charles H. Dow was the founder of the financial news service Wall Street Journal. He was the first to create a composite index to measure the price movements of the US stock market, known today as the Dow Jones Index. However, he did not directly develop the theories now known as “Dow Theory”. In his articles he only wrote analyses of stocks and the market based on the experience he had gained in the market; he never compiled his knowledge and experience into a complete theory.
The term “Dow Theory” was used by a friend of his, A.C. Nelson, who was also an analyst at the Wall Street Journal, in a book titled “The A B C of Stock Speculation”.
After Charles Dow died in 1902, William Peter Hamilton succeeded him as editor of the Wall Street Journal. For more than a quarter of a century, from 1902 until Hamilton’s death in 1929, all his articles in the paper were based on the core principles of Dow Theory. He introduced the basic principles of Dow Theory to the public in his book “The Stock Market Barometer”, published in 1922.
After Hamilton’s death, Robert Rhea refined, developed and popularised Dow Theory. In 1932 he wrote a book titled “The Dow Theory: An Explanation of Its Development and an Attempt to Define Its Usefulness as an Aid to Speculation“. In this book Rhea explained Dow Theory in detail. He set out three main hypotheses of Dow Theory:
- The primary trend cannot be manipulated: Rhea believed that secondary and minor trends, or the stock market’s intraday price moves, could be manipulated, but he insisted that the primary trend could not.
- Price discounts everything: This is because price is the result of market participants’ buying and selling based on their knowledge, information and expectations.
- Dow Theory is not the Holy Grail: This is a self-evident truth in every area of life. So, to invest and speculate successfully, everyone must make the effort to keep learning and researching.
Many studies have tested how effective Dow Theory is in practice when applied to trading. Although many people criticise its limitations, Dow Theory is regarded as a guiding principle and the foundational theory on which modern technical analysis is built.
Dow’s three key theories
Theory 1: An idealised market consists of the following phases: an uptrend, a top, a downtrend and a bottom. Along the way there are usually periods of retracement and of accumulation, consolidation or sideways movement (consolidations).
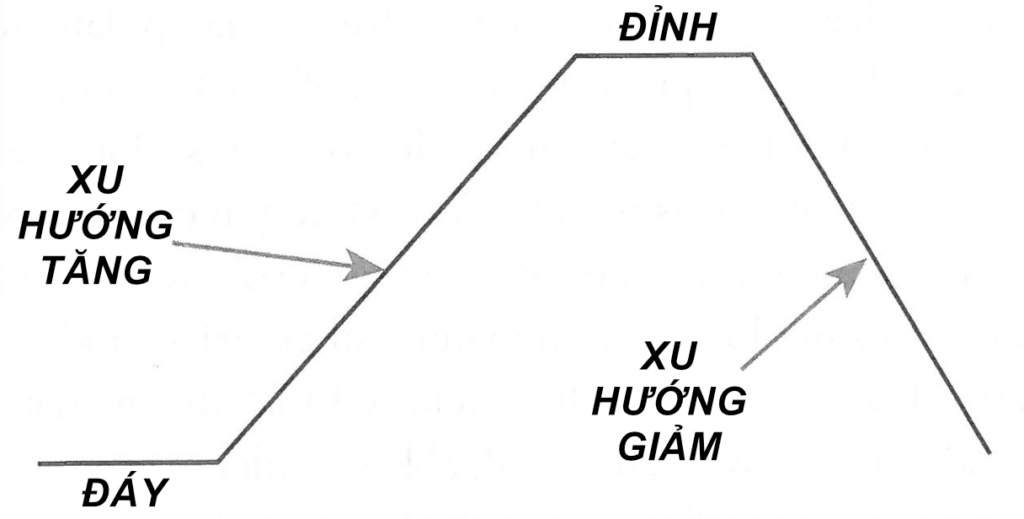
Figure 1 shows the components and structure of an idealised market; in reality, market structure is much more complex. Still, understanding what an idealised market looks like lets investors grasp the general structure of market behaviour and how price behaviour responds to the economic cycle. Every market (stocks, commodities, foreign exchange…) shares the same general, self-similar structure; markets differ only in the timing and amplitude of their moves.
Theory 2: Economic reasoning should be used to explain movements in the stock market
Charles Dow created two stock indices: the Industrial Average and the Railroad Average. He believed that industrial and railroad stocks would reflect the trend in profits and prospects of industry and the railroads in the economy as a whole. The profits and prospects of industry and the railroads should be closely linked.
If industry produces lots of goods but the railroads do not carry those goods across the country to be sold, the economy is growing slowly. If the Industrial index rises but the Railroad index falls, it shows that stock market expectations are irrational and that any uptrend will not last. If the Industrial index rises and the Railroad index rises too, expectations of growth in the economy and the stock market are entirely reasonable. In addition, the Railroad index can act as a “barometer” of the US economy, because when the economy is thriving, transport is one of the first industries to grow and take off.
Theory 3: Price moves in trends.
- A trend is a specific direction in which things move.
- Trends are the basic pattern of all price action in the market.
- A trend can be up (upward), down (downward) or sideways.
- Technical analysis is a method that helps investors anticipate market trends.
The market’s three trends
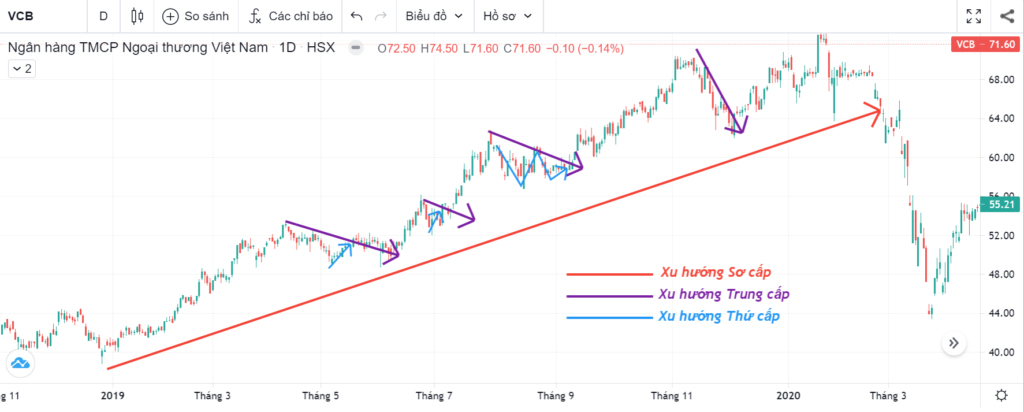
Primary trend – the long-term trend
The primary trend is the largest and longest-lasting of the three trends; it represents the main, overall, long-term trend in the price of an asset (stocks, gold, oil, cryptocurrencies…).
A primary trend can last for many years.
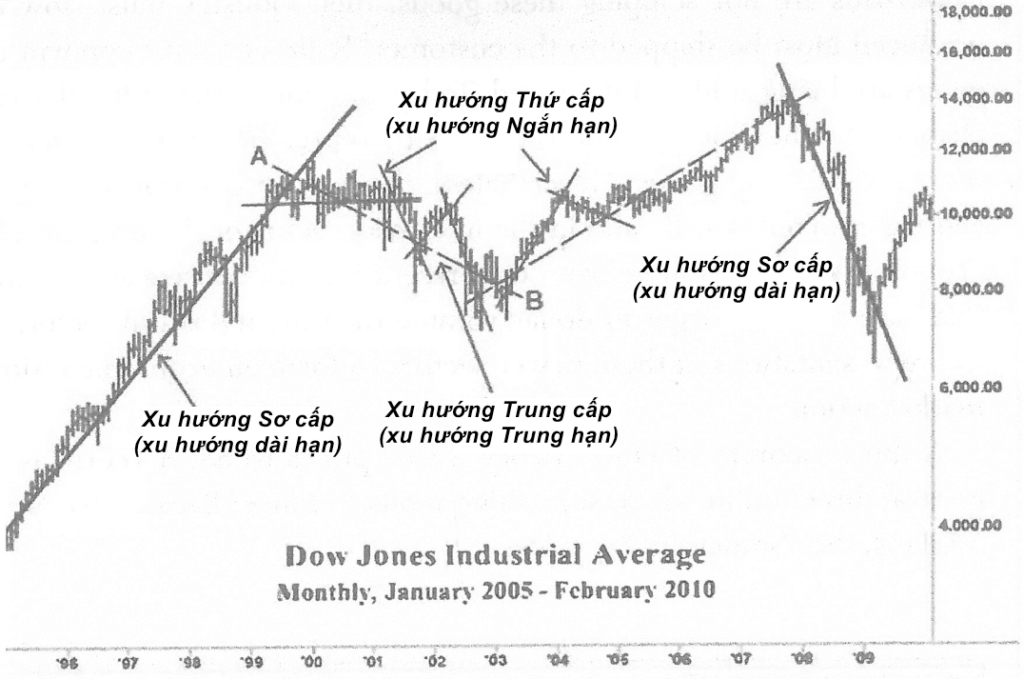
If the primary trend is up, we call it a primary bull trend. If the primary trend is down, we call it a primary bear trend. In Figure 2 further down this article, you can see that the long uptrend of the 1990s is an example of a primary bull trend.
A primary bull trend has three distinct phases:
- Phase 1: Market sentiment is still weighed down by the preceding primary bear trend.
- Phase 2: The market begins to respond to companies’ positive business results (revenue and profit growth).
- Phase 3: Speculation starts to dominate the market, and asset prices rise on “hopes and expectations”.
A primary bear trend is a long period of selling and market gloom. The downtrend continues until the worst news and business results have been fully reflected in price. A primary bear trend also has three phases:
- Phase 1: Investors still expect stock prices to rise, and stocks are still being bought.
- Phase 2: Investors panic and start dumping stocks as negative news emerges or business results deteriorate.
- Phase 3: The selling eases, and this is when the intrinsic (true) value of stocks (or other assets) is revealed. Institutional investors, or those who believe the worst is over, start buying, while those who are still doubtful and disillusioned with the market are forced to sell to cut their losses.
Secondary trend – the intermediate-term trend
The secondary trend runs against the main (primary) trend. For example, over several years of a rising market, there will be a few corrective declines lasting several weeks or months.
In a secondary downtrend, price retraces 33% to 66% of the wave created by the preceding primary uptrend. The move from point A to point B illustrates this intermediate trend. (Figure 2.1)
If investors can spot and catch the secondary trend, they can use it to enter the market and seek profits. However, according to Charles Dow, this is extremely dangerous, because primary and secondary trends share similar characteristics, so they can easily confuse investors trying to analyse and predict the trend.
Minor trend – the short-term trend
The minor trend is the smallest trend level, usually playing out within a day. As a result, the minor (or intraday) trend is very noisy and usually of little value. Even so, price action spanning several days may be worth studying, because price over many days builds chart patterns that are easy to recognise and have predictive value for the trend.
Sideways price moves lasting two to three weeks within a range of about 5% signal a zone of distribution or accumulation. (For example, if Bitcoin (BTC) is at USD 20,000, a 5% range is USD 1,000. If price only moves up and down within USD 1,000 of the reference price, it may be in accumulation or distribution.) A breakout from this sideways range gives investors a basis for judging price’s next direction.
Note that Charles Dow, Hamilton and Rhea all regarded short-term intraday trading (day trading) as very risky and hazardous, because short-term price moves are often illogical.
Confirmation in Dow Theory
The “concept of confirmation” is stated as follows: if a conclusion is based on only one index and has not been confirmed by the other, the conclusion is premature and we may fall into a trap.
Dow Theory places particular emphasis on this: Charles Dow would ignore trend signals if they appeared on only one index and not the other. This is known as the “concept of confirmation”.
“Confirmation” in Dow Theory is when both the Railroad index and the Industrial index close at a new high or a new low. They do not have to make the high/low at exactly the same time, but they must do so almost simultaneously, or within a few sessions.
Confirmation is the clue that tells us where the primary trend is heading. If one index’s secondary (intermediate-term) trend fails to make a new high or low as the other index does, the primary (main) trend of the whole market is likely not to continue but to reverse. This is called “non-confirmation”.


For example, in Figure 3.2 above, the Russell 2000 made a new high first, but investors should not rush to conclude that the US stock market has entered a new uptrend; we need to wait for confirmation from the S&P 500. A few weeks later, the S&P 500 also broke through resistance to make a new high. This is the moment we can confirm that “the market has turned to an uptrend!“
The importance of trading volume
Although trading volume does not help investors confirm a trend reversal, it is the second factor (alongside “confirmation”) that helps us confirm the trend.
If price rises and trading volume rises too, it shows that a bull market is in control. Likewise, if price falls and trading volume rises, it shows that a bear market is in control.
If price rises but trading volume is low, it shows that the uptrend is weakening and the market is becoming overbought. Likewise, if price falls but trading volume is low, it shows that the downtrend is weakening and the market is oversold.
The final phase of an uptrend is usually when trading volume rises very sharply, while the early phase of an uptrend is when trading volume is subdued.
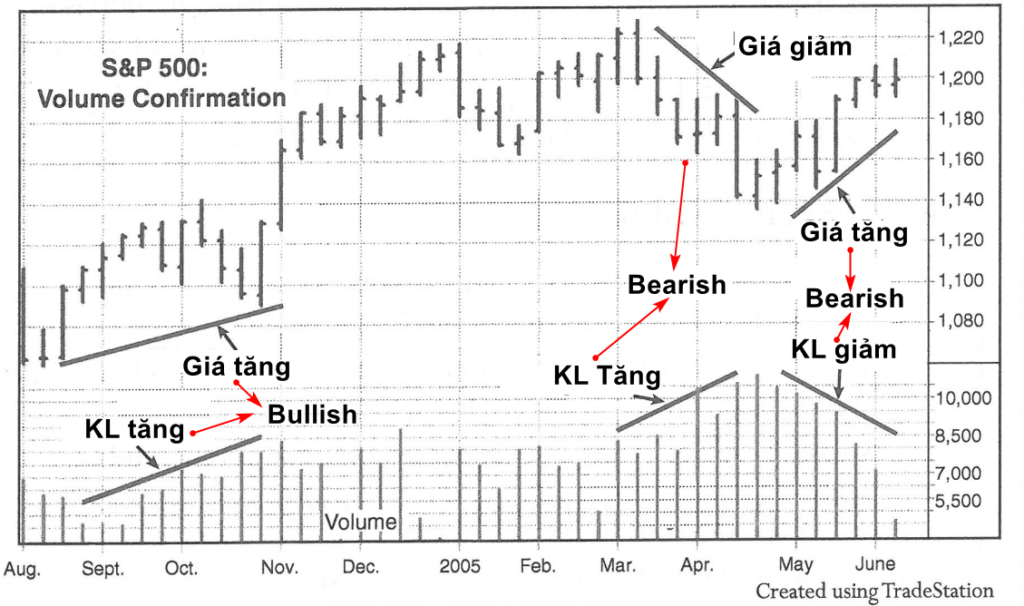
Although trading volume is not a critical factor in Dow Theory, do not underestimate it. Even so, do not treat volume as a priority: according to Dow Theory, the trend and confirmation matter most in analysis.
Technical Analysis Course – CMT Level 1
Green Chart designed this course specifically for candidates in Vietnam who want to study and prepare for the CMT Level I exam. The programme includes 27 sessions of theory, practice questions and mock exams. Students also receive the course textbook, question bank and mock exams free of charge for their exam preparation, and can retake the course for free for life.
See more details about the course here.
Happy trading !