Contents of this article
- What is the MACD indicator?
- Ways to use the MACD
- Identifying the trend with the MACD
- Identifying buy and sell signals with the MACD
- MACD divergence signals
- How to read the MACD histogram
- Histogram convergence
- Histogram divergence
- Identifying market tops and bottoms with the histogram
- Identifying potential entry signals with the histogram
- Technical Analysis Course – CMT Level 1

This article explains what the MACD line, or MACD (Moving Average Convergence Divergence) indicator, is and how stock traders use it in their trading strategies.
We will look at the components of the MACD on a chart and how to read them for trading.
What is the MACD indicator?
The MACD is one of the most widely used technical analysis tools, developed by Gerald Appel in 1979. Traders love the MACD because it provides “confirmation” of price action. Let’s dig into the details in the sections below.
The MACD indicator has three main components:
- The MACD line, calculated as the difference between two EMAs: EMA(12) – EMA(26).
- The signal line: the EMA(9) of the MACD line.
- The histogram: the difference between the MACD line and the signal line (MACD line – signal line).
Ways to use the MACD
The MACD is a versatile tool. There are three ways to use it:
- Identifying the trend and buy/sell signals with the MACD.
- MACD divergence/convergence (also called bearish/bullish divergence).
- The histogram.
We discuss all three uses of the MACD below.
Identifying the trend with the MACD
The main way to read the MACD is to use its moving average crossovers.
When the short-term EMA – EMA(12) – crosses above the long-term EMA – EMA(26) – this indicates an uptrend, and vice versa.
Remember that the MACD line (blue) is the difference EMA(12) – EMA(26). Therefore:
- When the EMA(12) crosses above the EMA(26), the MACD line crosses above the zero line. This signals an uptrend.
- When the EMA(12) crosses below the EMA(26), the MACD line crosses below the zero line. This signals a downtrend.

Identifying buy and sell signals with the MACD
Crossovers between the MACD line and the signal line are the most basic case traders need to watch to trade the MACD effectively.
- A potential buy signal appears when the MACD line (blue) crosses above the signal line (orange).
- A potential sell signal appears when the MACD line (blue) crosses below the signal line (orange).

MACD divergence signals
Divergence signals can tell traders to close long or short positions before their profits shrink or are wiped out.
Bearish (negative) divergence: occurs when the MACD signals that price may weaken (the MACD makes a lower high) while the price of the stock, commodity or currency pair keeps moving up (price makes a higher high). Bearish divergence shows that the MACD is not confirming the rise in price and signals that a bearish reversal may be coming.

Bullish (positive) divergence: occurs when the MACD signals that the price of the stock, commodity or currency pair may bottom or rise (the MACD makes a higher low) while price is still in a downtrend (price makes a lower low). Bullish divergence shows that the MACD is not confirming the decline in price and signals that a bullish reversal may be coming.

How to read the MACD histogram
The histogram is based on the difference between the MACD line and the signal line. When learning about the MACD histogram, there are two very important terms to understand: histogram divergence and convergence.
Histogram convergence
When the histogram converges, the MACD line moves closer to the signal line.
At the same time, the height of the histogram bars gradually shrinks. This happens when the price of a stock, commodity or currency changes trend or when an uptrend gradually stalls.

Histogram divergence
When the histogram diverges, the gap between the MACD line and the signal line widens.
At the same time, the height of the histogram bars increases (whether positive or negative). Histogram divergence confirms that the price uptrend (positive histogram) or downtrend (negative histogram) is getting stronger.

Identifying market tops and bottoms with the histogram
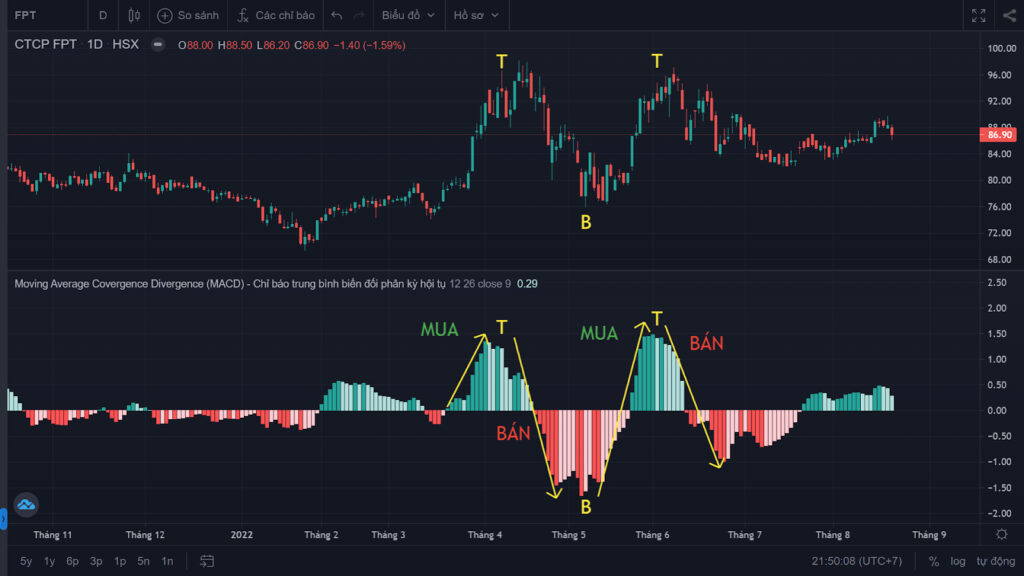
In Figure 7, the letter “T” marks a histogram top. Conversely, the letter “B” marks a histogram bottom.
Looking at the examples in Figure 7, we can see a close correlation between the histogram’s tops and bottoms and those of price.
Identifying potential entry signals with the histogram
A buy signal appears when the MACD histogram is below the zero line and starts to converge toward it.
A sell signal appears when the MACD histogram is above the zero line and starts to converge toward it.
Note: these signals carry high risk. Traders can wait until the histogram moves to zero, but by then the signal is the same as the MACD’s moving average crossover.
Besides generating buy and sell signals, the MACD can also warn of a potential trend reversal in the price of a stock, commodity or currency pair.
Technical Analysis Course – CMT Level 1
Green Chart designed this course specifically for candidates in Vietnam who want to study and prepare for the CMT Level I exam. The programme includes 27 sessions of theory, practice questions and mock exams. Students also receive the course materials, question bank and mock exams free of charge, and can retake the course for free for life.
See full course details here.
Happy trading !