Contents of this article
- The anatomy of a Japanese candlestick
- Types of patterns in Japanese candlestick charts
- Single-candle patterns
- Two-candle patterns
- Three-candle patterns
- What is a Marubozu candle?
- What does a Marubozu signal?
- Trading the Marubozu
- What is a Pin Bar?
- What is a Hammer?
- What is a Hanging Man?
- What is a Shooting Star?
- What is a Spinning Top?
- What a Spinning Top means
- Spinning Tops in a downtrend
- Spinning Tops in an uptrend
- What is a Doji?
- Technical Analysis Course – CMT Level 1

In this article we will look at the most important points about how to read Japanese candlestick charts, from how a candle is built to the types of candlestick patterns and what they mean. The article is fairly long, so make sure you have the patience before you start.
The anatomy of a Japanese candlestick
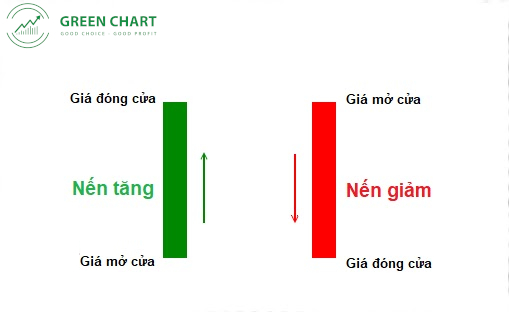
A Japanese candlestick has two main parts: the real body and the shadows (also called wicks). The lower shadow shows the lowest price in a session, while the upper shadow shows the highest price in the session. The body uses a pair of contrasting colours to distinguish bullish from bearish candles, usually green/red or white/black. For a green candle, the bottom of the body is the open and the top is the close. A red candle is the opposite, implying that price fell during the session.

Types of patterns in Japanese candlestick charts
Based on the length of the body and shadows, we can divide candles into many different patterns:
Single-candle patterns
- Marubozu: a candle with a long body and negligible shadows.
- Doji: a candle with a flat body.
- Spinning tops: a short body with two short shadows of similar length, so the candle looks like a spinning top.
- Hammer/hanging man: a short body, a negligible upper shadow and a long lower shadow.
- Shooting star: a short body, a long upper shadow and a negligible lower shadow.
Two-candle patterns
- Engulfing: a bearish candle followed by a bullish candle whose body completely engulfs the previous candle (bullish engulfing), or vice versa (bearish engulfing)
- Harami: a bearish candle followed by a bullish candle that is completely contained by the previous candle (bullish harami), or vice versa (bearish harami)
- Piercing pattern: a bearish candle followed by a bullish candle positioned about 1/3 lower than the previous candle.
- Dark cloud cover: a bullish candle followed by a bearish candle positioned about 1/3 lower than the previous candle.
Three-candle patterns
- Morning star: a bearish candle followed by a short-bodied candle and then a bullish candle. The second candle is the lowest.
- Evening star: a bullish candle followed by a short-bodied candle and then a bearish candle. The second candle is the highest.
Now let’s look at each pattern in detail:
What is a Marubozu candle?
In theory, a Marubozu is a candle with a long body and no shadows. In practice, however, such candles are very rare. So we can also treat candles with a long body and negligible shadows as Marubozu.
What does a Marubozu signal?
For example, when a Bullish Marubozu appears, it shows that investors were actively buying the stock throughout the session, regardless of whether the price was high or low. There was almost no selling pressure to push the price down, so the close coincides with the high and the open coincides with the low. A Bullish Marubozu reflects strong buying and almost no selling, which may push the stock higher over the next few sessions, regardless of the previous trend.
Conversely, a Bearish Marubozu shows that investors were selling the stock heavily throughout the session, at every moment and every price, with almost no buying, so the stock closed at the session low. When a Bearish Marubozu appears, it signals that the stock may fall over the next few sessions.

Trading the Marubozu
As mentioned, a Marubozu signals that the future trend will continue in the candle’s direction. Traders can therefore wait for a Bullish Marubozu to confirm a buy, with a basic setup: buy around the Marubozu’s close and place a stop-loss at its low.
If a Bearish Marubozu appears on a stock in your portfolio, the trend ahead is down, so you should sell. If you trade an asset that can be sold short (such as VN30 index futures), you can set up your order in the same way: enter after the candle has formed and place a stop-loss at its high. Remember that you need to wait for the close to confirm a completed candle – be patient.
A final note on trading the Marubozu: only trade candles of medium length, with a move that is neither too small (below 1%) nor too large (above 5%). A trend formed by Marubozu candles that are too short is not reliable, while with very long candles the stop-loss will be relatively far from the entry.
What is a Pin Bar?
A pin bar is a single-candle pattern with a short body and one long shadow, while the other shadow is very short or negligible. If a pin bar has a long lower shadow, we call it a Hammer (if it forms at a bottom) or a Hanging Man (if it forms at a top). Conversely, if a pin bar has a long upper shadow, we call it a Shooting Star (if it forms at a top) or an Inverted Hammer (if it forms at a bottom).

What is a Hammer?
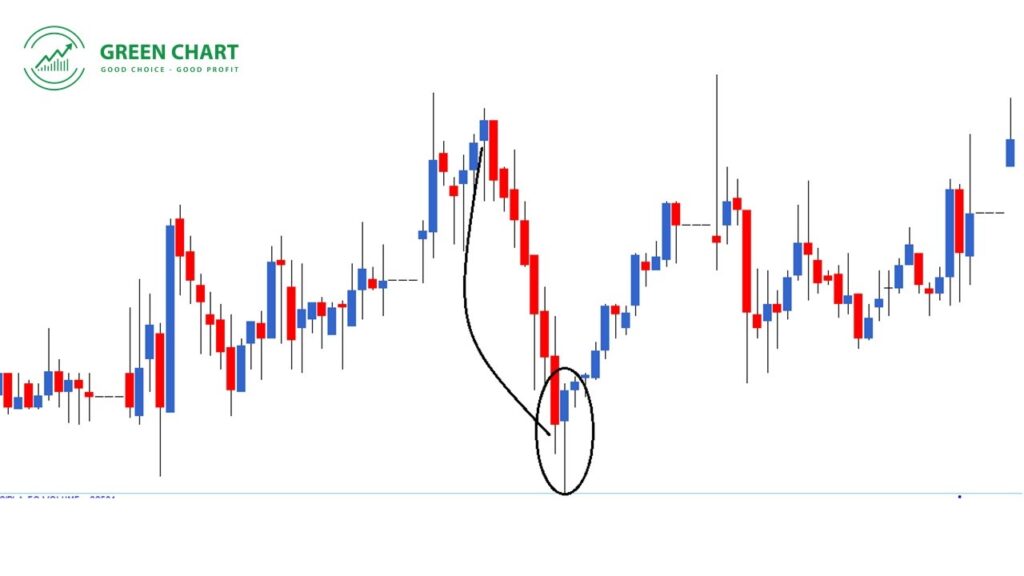
The Hammer is a type of pin bar with a short body and a long lower shadow, usually appearing at the end of a downtrend. In a downtrend, sellers are stronger, and a Hammer usually implies the following: early in the session, sellers still show their strength, pushing price down to the session low (the bottom of the shadow); then, at that level, stronger demand appears and pushes price back up to near the open by the end of the session. The Hammer therefore shows buyers returning after a long downtrend – in other words, a bullish reversal signal. A buy setup looks like this:
Risk-tolerant traders can enter as soon as the Hammer has formed, with a stop-loss at the Hammer’s low.
More cautious traders will wait for another green candle in the next session to confirm that the trend has truly reversed before entering. The stop-loss stays at the Hammer’s low.
Clearly, those who enter early get a lower purchase price and therefore a higher return. However, being cautious helps you avoid losses if price keeps falling in the next session. Here is an example.
What is a Hanging Man?
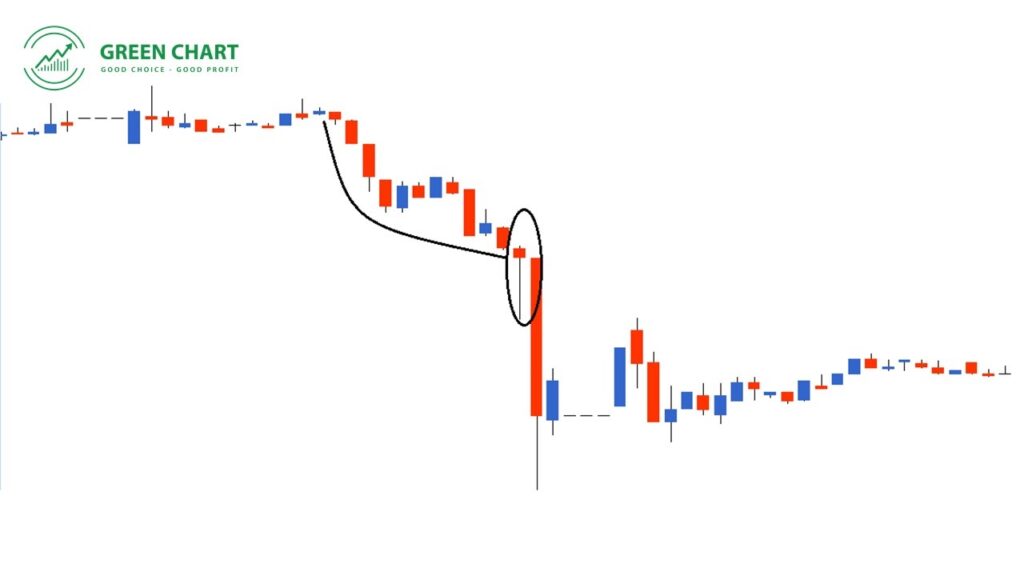
The Hanging Man is a type of pin bar with a short body and a long lower shadow, usually appearing at the end of an uptrend. It shows that strong selling returned during the session even though buyers had been in control, so it usually acts as a reversal signal. When you see a Hanging Man, you can sell to exit your position, or wait for another bearish candle the next day to confirm the reversal before acting. If you go short, the stop-loss for the short is the Hanging Man’s high.
What is a Shooting Star?
The Shooting Star has a short body, a long upper shadow and no lower shadow, and usually forms at the end of an uptrend; it is named for its resemblance to a shooting star. In an uptrend, buyers are stronger, and a Shooting Star usually implies the following: early in the session, buyers still show their strength by pushing price up to the session high (the top of the shadow); then, at that level, stronger supply appears and pushes price back down to near the open by the end of the session. The Shooting Star therefore shows sellers returning after a long uptrend. You trade a Shooting Star in the same way as a Hanging Man.

What is a Spinning Top?
As its name suggests, a Spinning Top looks like a spinning top: a short body with upper and lower shadows of almost equal length. A Spinning Top can have a green or red body; this does not matter much.

What a Spinning Top means
First, the body: it is not very long, showing that the open and close are roughly equal. The upper shadow shows that buyers were strong at one point but weakened by the end of the session. Likewise, the lower shadow shows that sellers could not sustain their strength during the session. So a Spinning Top shows indecision among both buyers and sellers, signalling uncertainty about the next move.
To analyse a Spinning Top, we need to place it in the market context at the time.
Spinning Tops in a downtrend
In a downtrend, sellers have the initiative and are stronger than buyers. However, when one or more Spinning Tops appear, they show that both buyers and sellers are hesitating. If the market has no new trend for a long time – usually due to a lack of fundamental news – several Spinning Tops will appear side by side and price will move sideways. Two outcomes are then equally likely: sellers return after a pause, or buyers rally and reverse the market.
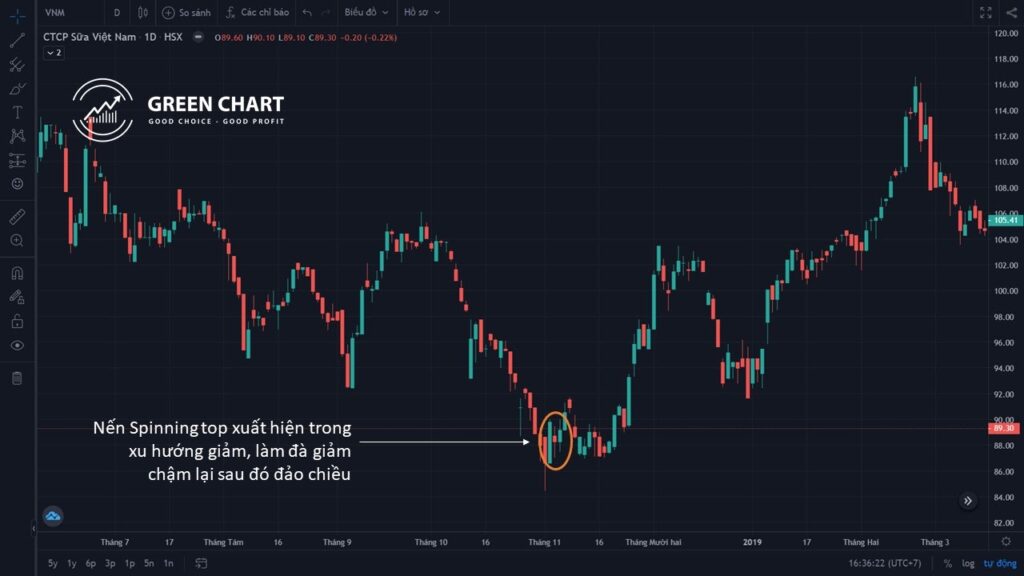
Traders therefore need to prepare carefully for both outcomes to set up a sensible trade.
A good way to buy when you see a Spinning Top in a downtrend is to split your position. For example, if you want to buy 1,000 shares, you can first buy 500 shares around the price where the Spinning Top appeared. Then wait for the trend to be confirmed: if the downtrend continues, cut your loss; if price reverses, you can buy the remaining 500 shares.
Spinning Tops in an uptrend
A Spinning Top in an uptrend shows that buyers are starting to hesitate after a strong advance, while sellers are not yet strong enough to reverse the trend. If the market has no new trend for a long time, several Spinning Tops will appear side by side and the market will move sideways. Two outcomes are then equally likely: buyers return after a breather and the uptrend continues, or sellers rally and reverse the market.

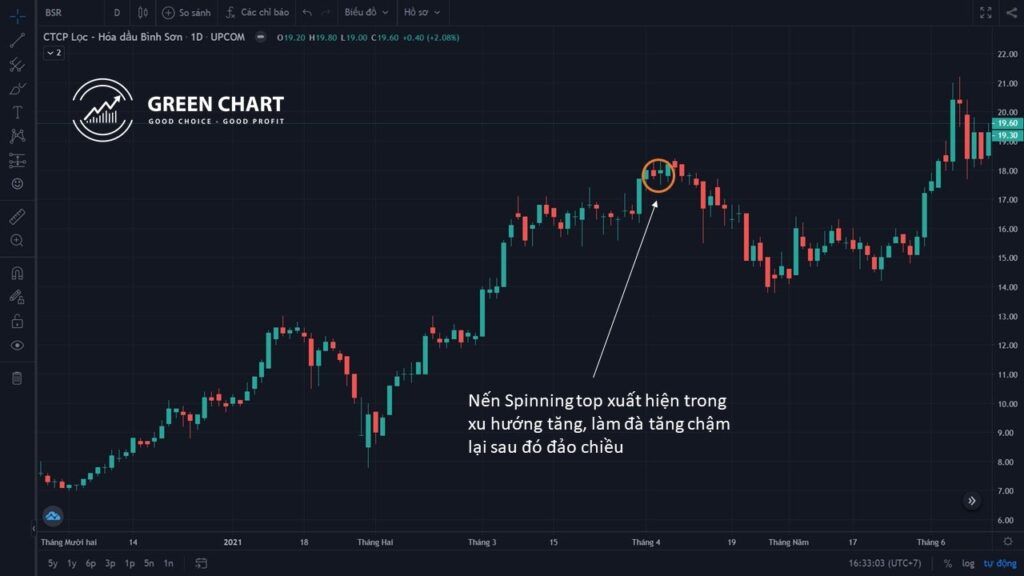
In that case, you can use the pullback to take profit on 50% of your position, then wait for the next trend to be confirmed before taking profit on the rest or buying back.
In short, a Spinning Top signals uncertainty in the current trend, and traders need to take note in order to have a sensible trading strategy.
What is a Doji?
A basic Doji is a candle with no body (the open and close are equal) or a very thin body, reflecting an open and close that are almost unchanged.

In essence, a Doji is a special form of the Hammer/Hanging Man if it has a long lower shadow and a short upper shadow, and it behaves like a Spinning Top if its upper and lower shadows are of similar length.


In How to read Japanese candlestick charts (Part 2), we will look at two-candle and three-candle patterns, which are slightly more complex than single-candle patterns.
Technical Analysis Course – CMT Level 1
Green Chart designed this course specifically for candidates in Vietnam who want to study and prepare for the CMT Level I exam. The programme includes 27 sessions of theory, practice questions and mock exams. Students also receive the course textbook, question bank and mock exams free of charge for their exam preparation, and can retake the course for free for life.
See more details about the course here.
Happy trading !