Contents of this article

What is a Point & Figure chart?
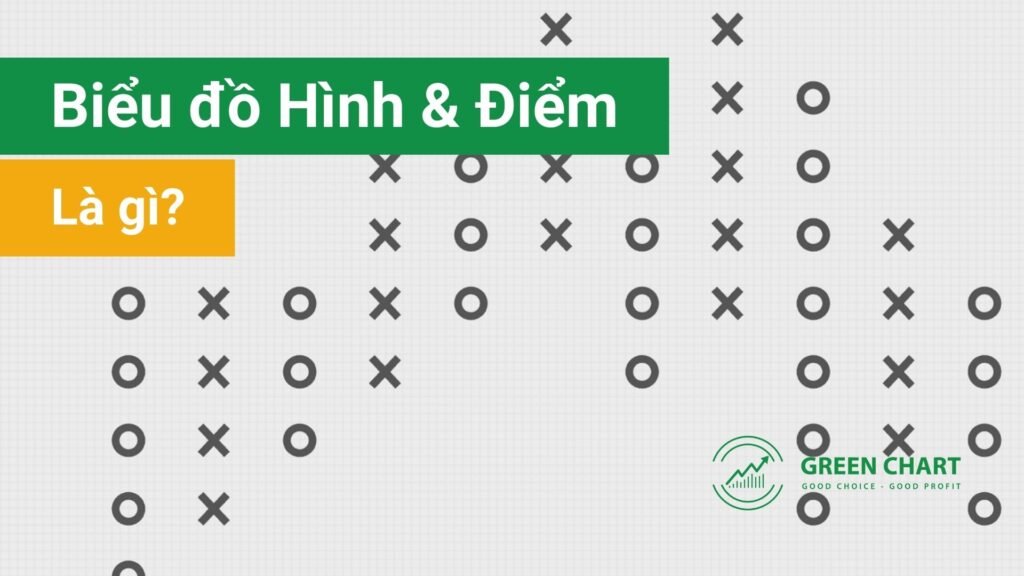
The Point & Figure chart is a very special type of chart, yet traders pay it little attention because Japanese candlestick charts dominate technical analysis in popularity and ease of understanding. Even so, the Point & Figure chart has a long history and is still used very effectively by some traders today.
The truly special feature – and strength – of the Point & Figure chart is that it ignores time and focuses only on price movement. As a result, the Point & Figure chart captures the “purity” of price and shows the shifting of supply and demand that today we call “price action“.
Inputs for a Point & Figure chart
There are two inputs to note for a Point & Figure chart:
- The box size.
- The reversal amount.
Let’s look at each in detail for a clearer picture.
What is the box size?
Each X and O plotted on a Point & Figure chart is called a “box”.
The box size is the price move needed before an X or an O can be plotted on the chart.
Normally, when price rises by one box, we plot an X. Conversely, when price falls by one box, we plot an O.
The trader decides how large or small the box size is. The box size determines the sensitivity and frequency of trading signals, so choosing it is especially important for trading Point & Figure charts effectively.

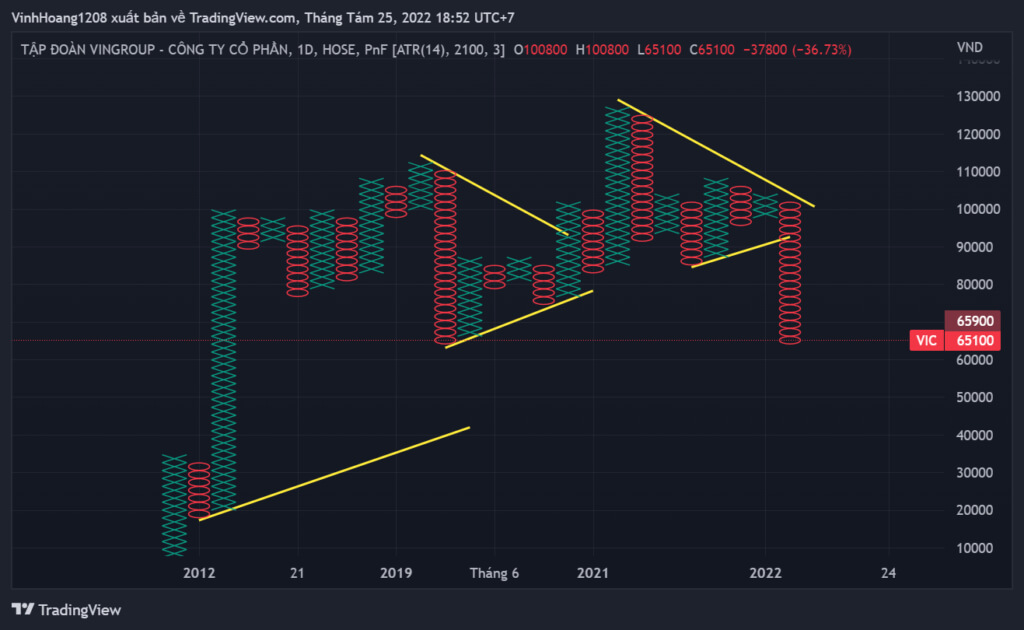
Example: In the image above, VIC (Vingroup) is shown on a Point & Figure chart with a box size of 2,100.
When VIC rises from VND 21,000 to VND 23,100 – that is, a rise of VND 2,100 – an X is plotted on the chart.
Conversely, when VIC falls from VND 126,000 to VND 123,900 – that is, a fall of VND 2,100 – an O is plotted on the chart.
What is the reversal amount?
The reversal amount is the number of boxes (X or O) that must be formed before a trend reversal is recorded (a new column of Xs or Os is added).
The reversal amount determines how quickly or slowly the Point & Figure chart detects a change in trend.
- A small reversal amount makes the chart react more to changes in the price trend, but trading signals are therefore noisier and fail more often.
- Conversely, a large reversal amount reacts more slowly to short-term trend changes. Noise on the chart is filtered out, and trading signals within a major trend are more accurate.
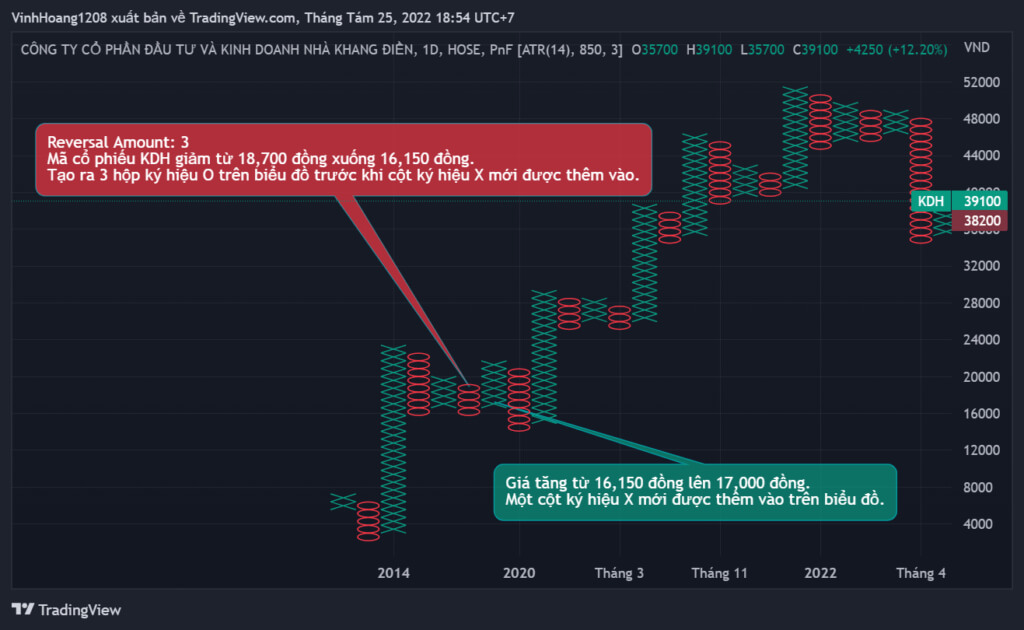
Example: If the reversal amount is 3 and the box size is VND 850, KDH must fall from VND 18,700 to VND 16,150, creating at least three O boxes, before a new column of Xs can be added.
Using Point & Figure charts in trading
One of the most common uses of Point & Figure charts is to help traders see classic chart patterns more easily.
Finding support and resistance on a Point & Figure chart
Point & Figure charts make it easier for traders to find support and resistance levels.
The more times a support or resistance level is “touched”, the stronger and more reliable the price reaction when it breaks.
Just as when trading support and resistance on conventional charts such as candlestick or bar charts, … a break above resistance on a Point & Figure chart gives a BUY signal. Conversely, a break below support gives a SELL signal.

Trendlines on a Point & Figure chart
One very special and interesting feature of Point & Figure charts is that they use 45° trendlines.
Why 45°? As we saw above with the concept of the “box”, a Point & Figure chart is symmetrical, with square cells formed by the boxes marked X or O.
Traders use the 45° trendline to confirm price movement and often to filter trading signals:
- Only open BUY positions when the 45° trendline slopes up.
- Conversely, only open SELL positions when the 45° trendline slopes down.
These are all the basic concepts of Point & Figure charts you need to master before moving on to more advanced topics. In part 2, we will go deeper into advanced Point & Figure topics such as chart patterns and calculating price targets…
Technical Analysis Course – CMT Level 1
Green Chart designed this course specifically for candidates in Vietnam who want to study and prepare for the CMT Level I exam. The programme includes 27 sessions of theory, practice questions and mock exams. Students also receive the course materials, question bank and mock exams free of charge, and can retake the course for free for life.
See full course details here.
Happy trading !