
Contents of this article

A recap
In the previous article, we looked at variance and covariance in connection with the two common types of risk, systematic and unsystematic risk. Having understood the basic difference between these two types of risk, we now turn to portfolio risk, also known as portfolio variance.
Specifically, variance measures how far a stock’s returns deviate from its own average return. Covariance measures how one stock’s returns vary relative to another stock’s returns.
In the examples so far, the formulas have only been applied to a pair of stocks, whereas in practice a portfolio contains many more. To estimate a portfolio’s variance, covariance and correlation, we therefore need the variance–covariance matrix.
In this chapter, we discuss how to estimate the variance–covariance of a portfolio using matrix multiplication and some related concepts. The resulting covariance matrix plays an important role in calculating the correlation matrix. This is the basis for calculating portfolio variance, and from there, how much risk you take on by holding a portfolio of stocks.
Along the way, we will also touch on “asset allocation” and how it affects portfolio return and risk. You will also get a quick introduction to “Value at Risk” (VaR).
Looking at risk in detail from a trader’s perspective, this chapter will help you identify trading risk and ways to reduce it.
The variance–covariance matrix
Before we continue, we need to clarify the phrase “variance–covariance matrix”. Does it mean one matrix containing both variance and covariance values, or two separate matrices, one of variances and one of covariances?
The answer is: a single matrix containing both variance and covariance values. If there are five stocks, for example, the matrix shows each stock’s variance and its covariance with the other four stocks. The following example will make this easier to picture. You will also need to know some basic matrix operations. If you don’t, this Khan Academy video will help you understand matrix multiplication here.
A well-diversified portfolio usually contains around 10–15 stocks. However, visualising a matrix of this size in Excel would be very complicated, and many beginners might feel overwhelmed by its size. I have therefore decided to use a five-stock portfolio so that the calculation is both clear and manageable for beginners.
Suppose the five stocks in my portfolio are: VPB, HPG, VHM, VNM and FPT
The covariance matrix for a five-stock portfolio is 5 × 5. In general, if there are “k” stocks in the portfolio, the covariance matrix is k × k (k rows and k columns).
The formula for the covariance matrix is as follows:
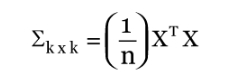
Where:
k is the number of stocks in the portfolio
n is the number of observations
X is the n × k excess return matrix, explained in detail below
XT = the transpose of matrix X
Specifically, we first calculate the n × k excess return matrix, then multiply its transpose by it. This matrix multiplication produces a k × k matrix. We then divide each element of this k × k matrix by the n observations. The result is the k × k covariance matrix.
To illustrate, I will use MS Excel to apply the matrix formula to the five-stock portfolio above. The data consists of the daily closing prices of these five stocks over the past month.
Step 1 – Calculate the daily return of each stock.
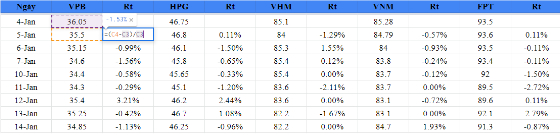
In the image above, you can easily see each stock’s daily return calculated right next to its closing price column.
Step 2 – Calculate the average daily return of each stock using the “AVERAGE” function.

Step 3 – Calculate the excess return matrix
The excess return matrix is defined as the difference between each stock’s daily return and its average return. If you remember, we did this in the previous chapter when discussing the covariance between two stocks.
The excess return matrix is calculated as follows:

Note that the resulting matrix is n × k, where n is the number of observations (19 in this example) and k is the number of stocks (5). So in our example the matrix is 19 × 5, denoted matrix X.
Step 4 – Perform the matrix multiplication XT × X to create a k × k matrix
XT is the transpose of X, created by swapping the rows and columns of the original matrix X. Note that this operation produces a k × k matrix, where k is the number of stocks in the portfolio. In our case, the matrix is 5 × 5.
List the stocks across the rows and columns as follows:
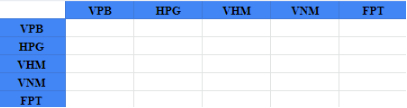
Use the function =MMULT(TRANSPOSE(X), X), where X is the excess return matrix

When applying this function, make sure you select the whole k × k range. Also note that after entering the formula you cannot simply press “Enter”; instead, press Ctrl + Shift + Enter.
Step 5 – Now divide each element of the XT X matrix by the total number of observations, n. Review the formula below for clarity:
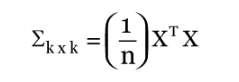
Instead of dividing each cell by 19, select the whole array holding the XTX matrix, divide by 19 and press Ctrl + Shift + Enter (because this is an array formula, not an ordinary calculation).
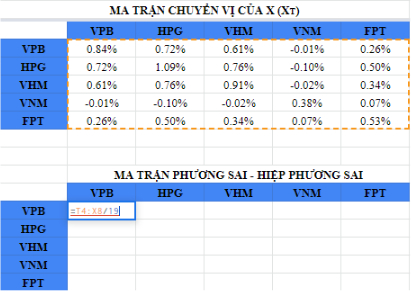
The result is the covariance matrix we are looking for:

In the results table above, the cells marked in red show that the covariance of HPG with VHM is the same as the covariance of VHM with HPG – there is no difference (both are 0.04%).
In addition, the blue cell shows that the covariance of VPB with itself is 0.04%. What does this value tell us? Simply that the covariance of a stock with itself equals its variance.
That is why this matrix is called the variance–covariance matrix: it contains both values.
You now know how to calculate the variance–covariance matrix. On its own, however, this matrix does not tell us much. What we really need is the “correlation matrix” – the key piece and the destination for estimating portfolio variance/risk. We will discuss it in the next chapter!
You can use the study data here.
Happy Trading !
The “Stock Trading For A Living” Course
Green Chart designed this course to give students a solid foundation in fundamental analysis and stock valuation, and to show them how to integrate it effectively into their existing trading system, especially for traders who already use technical analysis. The programme includes five theory sessions and six months of hands-on trading practice in the real market with the lecturer.
See full course details here.