Contents of this article
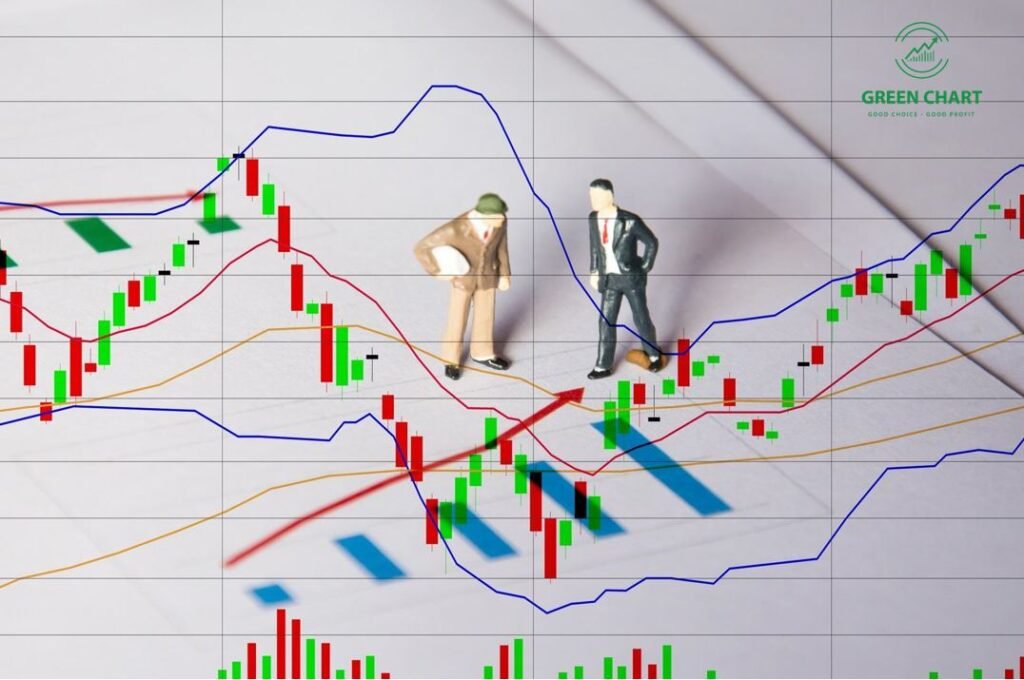
Technical analysis rests on one core assumption: the prices of freely traded assets generally move in trends.
Based on this assumption, traders and investors aim to buy a security or asset when a new uptrend begins at a low price, hold it, and sell when the trend ends at a higher price. Although this strategy sounds simple, carrying it out is extremely complex.
For example, what length of trend are we talking about? The trend in stock prices since the Great Depression? The trend in gold since 1980? The trend in the Dow Jones Industrial Average (DJIA) over the past year? Or the trend in Tesla stock last week? Trends can exist in every timeframe – from long-term trends lasting decades to short-term trends playing out minute by minute.
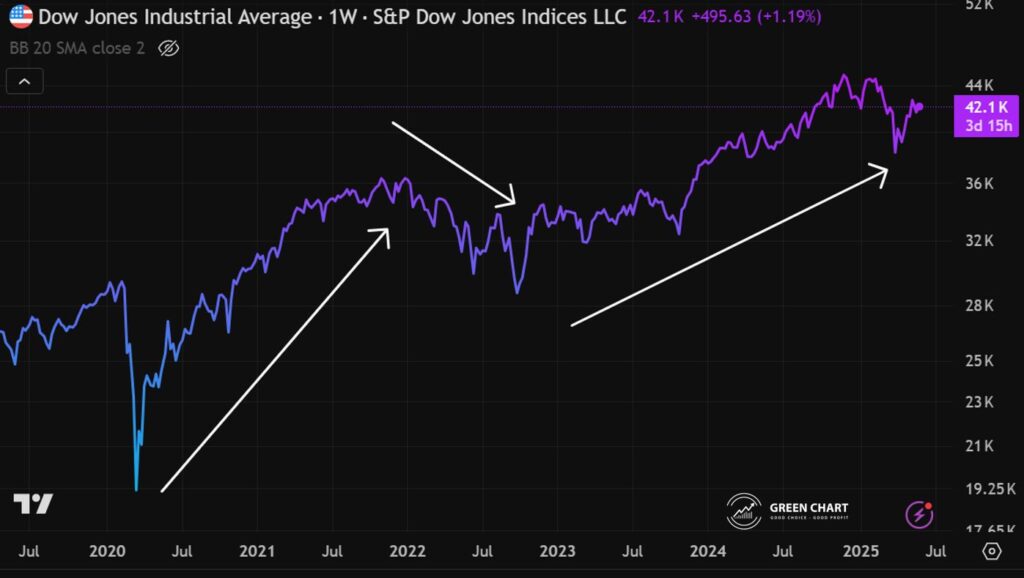
Trends in different timeframes tend to share similar characteristics. In other words, a trend in yearly data can behave much like a trend in five-minute data. Traders must choose the type of trend that best suits their goals, personal preferences and the time they can devote to watching price movements. One investor may be interested in the multi-year trend of the business cycle, another may focus on the trend over the next six months, and a third may care only about short-term intraday trends. Although investors and traders have different investment horizons, they can apply the same trend-analysis methods, because trends in different timeframes have significant similarities.
Trends are only obvious in hindsight, but what we want is to spot a trend as it begins and to recognise when it ends. Of course, this ideal almost never happens except by luck. The technical analyst always faces the risk of spotting a trend too late and missing the profit opportunity. In addition, if traders fail to recognise when a trend has ended, they may hold an asset long after price has peaked and give back potential profits. Conversely, if they believe a trend has ended when it is in fact continuing, and sell too early, they can also lose profits. Technical analysts therefore spend a great deal of time and effort trying to identify the beginning and end of trends as early as possible. That is why we need to study price charts, moving averages, oscillators, support and resistance zones and many other tools…
The fact that prices trend has been recognised for thousands of years. Academics once argued that markets are essentially trendless, because trends would contradict their theoretical models. However, recent academic research shows that traditional financial models run into many problems when applied to actual market behaviour. Meanwhile, academics and financial researchers have tended to treat technical analysis as taboo. An almost “religious” belief in the Efficient Markets Hypothesis has become dogma, with many scholars refusing to accept the growing body of empirical evidence against it. In practice, technical analysis is a skill forged through real market experience; many traders use it effectively, and it delivers substantial profits to those who know how to apply it properly.
How do technical analysts make money?
Turning pure technical analysis into profit requires certain conditions. The first and most important is identifying when a trend begins or ends. Trading profits come mainly from “jumping on” a trend as early as possible. In theory this sounds simple, but making profits consistently and steadily is anything but easy.
The indicators and tools technical analysts use to identify trends are not “crystal balls” that can predict the future precisely. In certain market conditions, these tools may not work well. Moreover, trends can reverse suddenly without warning. Technical investors therefore need to be fully aware of the risks and build strategies to protect their accounts from loss-making moves.
Tactically, the technical analyst must make decisions at two key points: (1) when to enter a position, and (2) when to exit it. Exiting has two possibilities: taking profit when price moves as expected, or cutting the loss when price moves against the forecast. A wise investor must recognise that the trend may not play out as expected. Defining the exit price and accepting the loss before entering the trade is one way to preserve capital against larger risks.
One of the greatest advantages of technical analysis – thanks to its focus on price movement – is that traders can set a price threshold at which they can tell whether the original analysis was wrong or the asset’s price behaviour is deviating unexpectedly. The risk of loss can therefore be quantified from the moment the position is opened, an advantage other investment methods lack. Finally, because the actual risk can be measured, money management principles can be applied to minimise losses and avoid the danger of “blowing up” the account.

In short, the basic strategy for profiting with technical methods is:
- “Trend is your friend” – trade with the trend.
- Don’t lose – control the risk of losing capital.
- Manage your money – manage risk to avoid “blowing up” your account.
Technical analysis is used to determine the trend, when the trend changes, when to enter, when to exit, and when to close a position because the original view was wrong. Put simply, that is all there is to it.
Technical Analysis Course – CMT Level 1
Green Chart designed this course specifically for candidates in Vietnam who want to study and prepare for the CMT Level I exam. The programme includes 27 sessions of theory, practice questions and mock exams. Students also receive the course materials, question bank and mock exams free of charge, and can retake the course for free for life.
See full course details here.