Contents of this article

Having covered delta, gamma and theta in three articles on the option Greeks, we now turn to the fourth and most interesting of the Greeks: vega. Vega measures the change in the option premium in response to a change in the volatility of the underlying asset.
So what does volatility of the underlying mean here, and how is it measured? Let us find out.
Calculating volatility
As you know, volatility in general is measured with the standard deviation. The steps to calculate a standard deviation are:
- Calculate the mean
- Calculate each deviation (= actual value – mean)
- Calculate the variance (= the average of the squared deviations)
- Calculate the standard deviation (= the square root of the variance)
Use Excel to calculate the standard deviation from the asset’s closing prices.
Step 1: Download the closing prices of the underlying asset
Step 2: Calculate daily returns = Ln (Today’s price / Previous day’s price)
Step 3: Use the STDEV function to calculate the daily standard deviation of returns
Step 4: Convert daily volatility to annual volatility = (daily STDEV) * (square root of time)
Volatility and the normal distribution
The normal distribution is something most of us learned at university

Illustration of the normal distribution
A quick refresher on the normal distribution and standard deviation:
- The probability of observing data within +/- 1 standard deviation is 68%; 68% is called the confidence level.
- The probability of observing data within +/- 2 standard deviations is 95%; 95% is called the confidence level.
- The probability of observing data within +/- 3 standard deviations is 99.7%; 99.7% is called the confidence level.

A chart of the normal distribution as described above.
The normal distribution and stock returns
In this section, we look at the relationship between stock returns and the normal distribution.
This is a chart of NIFTY’s daily return distribution. You can see that it follows a normal distribution.
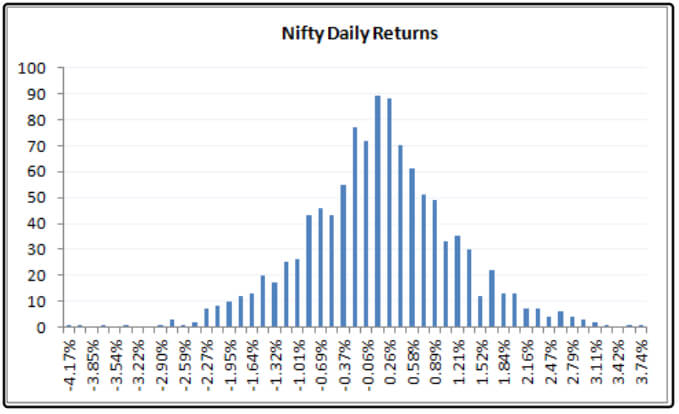
Average daily return = 0.04%
Daily standard deviation (volatility) = 1.046%
NIFTY spot price = 8337
So what range will NIFTY trade in over the next 30 days, or the next year? We will use 1 and 2 standard deviations, with confidence levels of 68% and 95%.
Case 1: NIFTY’s trading range over the next year
Mean = 0.04%
Standard deviation = 1.046%
Converting to annual figures, we get:
Annual mean = 0.04%*252 = 10.08%. (Note: by convention, a year has 252 trading days)
Annual standard deviation = 1.046%*Sqrt(252) = 16.61%
- At a 68% confidence level (1 standard deviation), NIFTY will trade over the next year within a range of
= 10.08% (+/-) 16.61%
= -6.53% -> 26.69%
From this, over the next year the price will trade between:
- Upper bound = 8337 * e^(26.69%) = 10887
- Lower bound = 8337 * e^(-6.53%) = 7809
Conclusion: over the next year, there is a 68% probability that NIFTY will trade between 7809 and 10887.
- At a 95% confidence level (2 standard deviations), NIFTY will trade over the next year within a range of
= 10.08 (+/-) 2*16.61% = -23.14% -> 43.3%
From this, over the next year the price will trade between:
- Upper bound = 8337 * e^(43.3%) = 12854
- Lower bound = 8337 * e^(-23.14%) = 6614
Conclusion: over the next year, there is a 95% probability that NIFTY will trade between 6614 and 12854.
Case 2: NIFTY’s trading range over the next 30 days
The calculation is the same as in case 1:
30-day mean = 0.04%*30 = 1.2%
30-day standard deviation = 1.046%*Sqrt(30) = 5.73%
- At a 68% confidence level (1 standard deviation), NIFTY will trade over the next 30 days within a range of
= 1.2% (+/-) 5.75% = -4.53% -> 6.93%
From this, over the next 30 days the price will trade between:
- Upper bound = 8337 * e^(6.93%) = 8935
- Lower bound = 8337 * e^(-4.53%) = 7968
Conclusion: over the next 30 days, there is a 68% probability that NIFTY will trade between 7968 and 8935
- At a 95% confidence level (2 standard deviations), NIFTY will trade over the next 30 days within a range of
= 1.2% (+/-) 2*5.75% = -10.26% -> 12.66%
From this, over the next 30 days the price will trade between:
- Upper bound = 8337*e^(12.66%) = 9462
- Lower bound = 8337*e^(-10.26%) = 7524
Applying volatility
Next, we will look at using volatility to decide which options to buy or sell and to set an accurate stop-loss. Once we have estimated the price range over an expected period, we can compare it with the option’s current strike price and make better decisions about whether to trade that option.
An effective way to set a stop-loss when you enter a trade is to use the stock’s volatility. Let us work through the following example.

Applying volatility
You buy stock X at 395, with a stop-loss at 385 and a price target of 417.
The risk here = 395 – 385 = 10 points
The target profit = 417 – 395 = 32 points
Reward/risk ratio = 32/10 = 3.2
Is a stop-loss at 385 reasonable?
- Step 1: calculate the daily volatility of stock X from market data. Suppose you calculate a daily volatility of 1.8%.
- You plan to hold the position for five days, so five-day volatility = 1.8%*Sqrt(5) = 4.01%.
- Calculate a stop-loss level based on five-day volatility = 395*(1 – 4.01%) = 379. So over the next five days, stock X could fall as low as 379. That means you could well be stopped out, so you should place your stop below 379, say at 375; your expected loss if the stop is hit is then 20 points.
Types of volatility

Types of volatility.
- Historical volatility: uses the closing prices of the underlying asset to calculate past volatility.
- Forecasted volatility: a forecast of volatility over a defined period.
- Implied volatility: reflects market participants’ expectations of volatility
- Realized volatility: used when you want to compare today’s implied volatility with implied volatility in the past.
Happy trading!