
Contents of this article
Maximising profit is always one of a company’s top goals. Profit is generated when a company’s capital or assets are used sensibly. To measure a company’s success, we therefore have to look at two things: the profit, and the assets needed to generate that profit. The larger the profit relative to the total assets used, the more efficiently the company is considered to operate.

What is ROA?
Return on assets (ROA) is the ratio that shows the net return on a company’s average total assets, which are financed by both shareholders’ equity and creditors. It is usually calculated over one year or one business cycle of the company.
The ROA formula
ROA is calculated with the formula:

Many analysts also use the following formula to calculate ROA:

We can calculate a company’s financial ratios from the figures in its financial statements. For example, if Company A has profit after tax of VND 10 billion, total assets of VND 90 billion at the start of the year and VND 110 billion at the end, then average total assets = (90+110)/2 = VND 100 billion. Company A’s ROA is therefore 10/100 = 10%.
Calculating ROA yourself
You can easily calculate a company’s ROA from the financial statements it publishes every quarter and every year.
Example: calculating the ROA of Digiworld Corporation (ticker: DGW) for 2021
Step 1: Find profit after tax
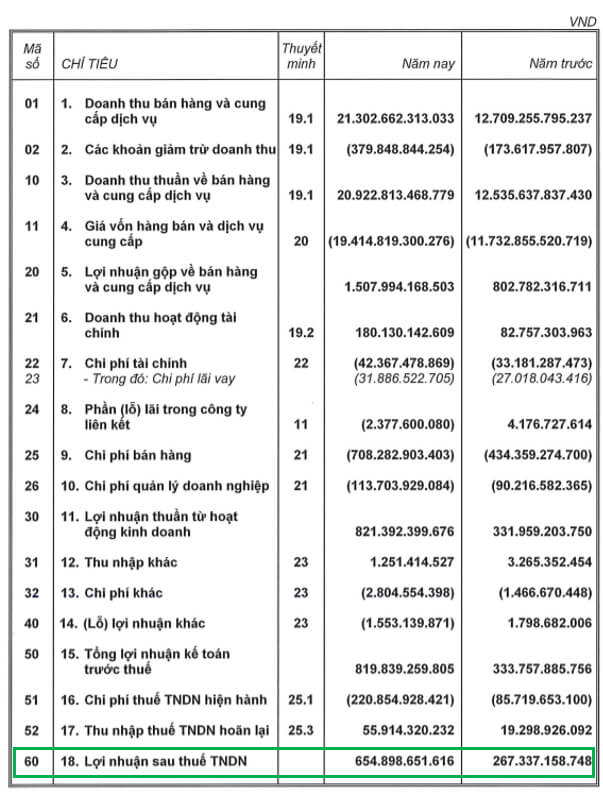
From the income statement, we take DGW’s 2021 profit after tax (current-year column): VND 654 billion.
Step 2: Find average total assets
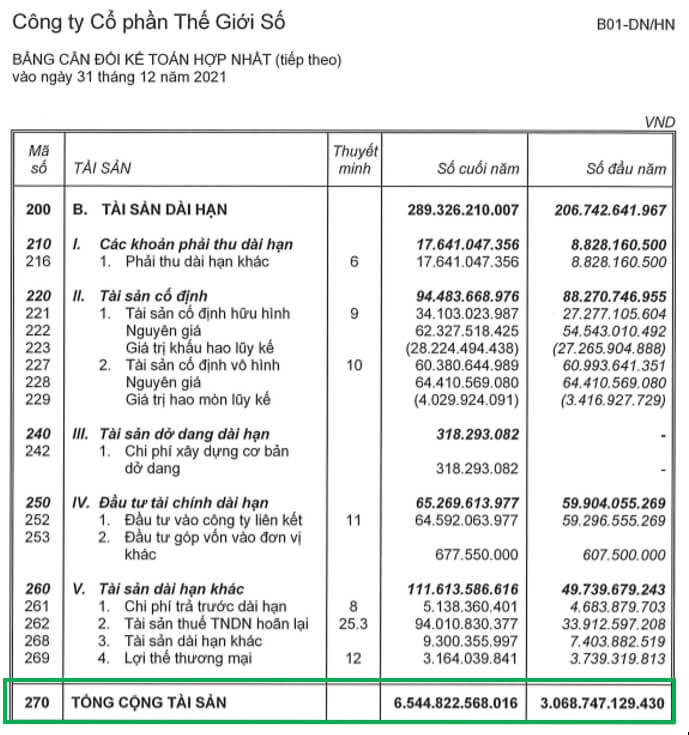
The income statement, and specifically profit after tax, reflects the company’s results over a whole period (a full quarter for quarterly reports, a full year for annual reports). The balance sheet, and specifically total assets, is a point-in-time figure. Taking total assets at a single point in time therefore does not accurately reflect the company’s assets over the whole period. To improve accuracy, we use average total assets to calculate ROA:
Average total assets = (Opening total assets + Closing total assets)/2
In this case: DGW’s average total assets = (6,545 + 3,069)/2 = VND 4,807 billion
Step 3: Calculate ROA
So ROA2021 (DGW) = Profit after tax / Average total assets = 654/4,807 = 13.61%
Looking up ROA from available sources
Another way to save time is to look up a company’s ROA for free on financial news sites such as Vietstock, Cafef and Cophieu68, or in data from brokerage firms.
Here is an example using data from the Vietstock website
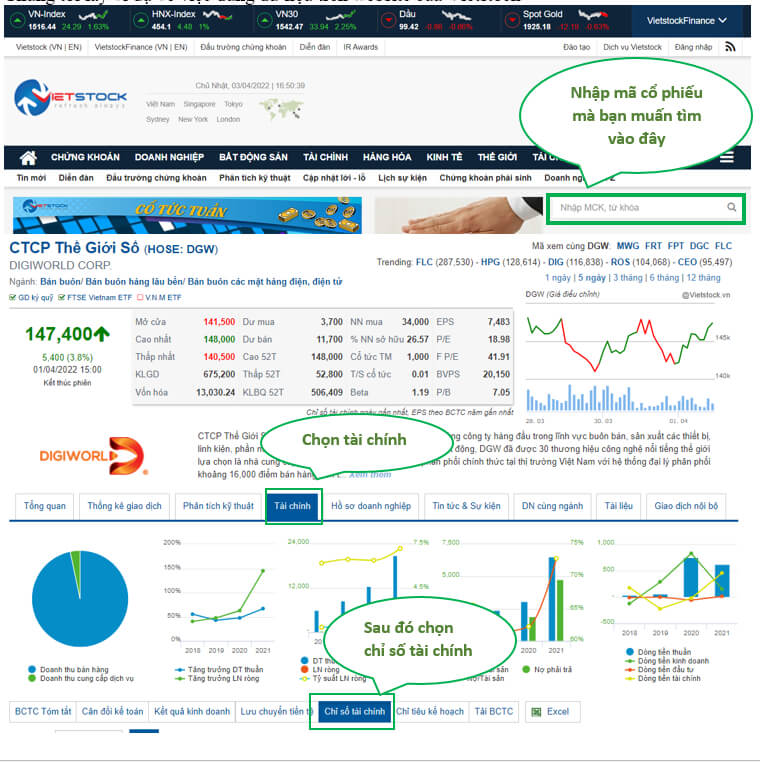
Scroll down and you will see that most financial ratios have already been calculated for you, which is very convenient.
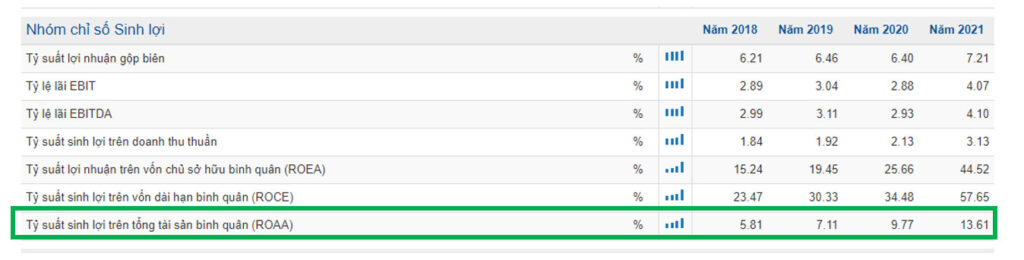
What ROA tells you
This ratio tells you, on average, how many dong of profit after tax each dong of assets generated during the period. A positive ROA is a solid launch pad for a company to grow from its own resources. The higher the ratio, the more efficiently the company uses its assets, and vice versa.
Analysing ROA with DuPont

Return on assets depends on asset turnover and the return on sales. In practice, these two factors always coexist as opposites in every company’s operations: a company with high asset turnover usually has a very low operating margin, and vice versa.
The main reason lies in the nature of each business model: manufacturers usually earn large margins on each product and have high operating margins, but they also have to invest heavily in fixed assets, which keeps asset turnover low. Conversely, trading and service businesses earn low margins on their products and services, so their operating profitability is low, but they do not need to invest much in fixed assets, so their asset turnover is usually faster than that of manufacturers.
What is a good ROA?

Unlike ROE, ROA cannot be amplified through leverage. That is why a company’s ROA is very rarely higher than this range.
So what is a good ROA?
Of course, we all understand that the higher the ROA, the better. A very low ROA shows the company is using its assets inefficiently. However, a ratio means little on its own. To know whether a company’s ROA is good, we need to compare it with the industry average or with similar companies in the same industry, and also compare it with the company’s own history to see whether it is improving.
You can easily find the ROA of companies in the same industry on various websites. Below is how to find the ROA of DGW’s industry peers on the Wichart website


An ROA above that of its industry peers is a good sign that the company is managing its capital well.
We can also compare the company with its own past, because sometimes a company’s ROA may still be high but trending downwards, and vice versa.

In the example above, DGW’s ROA is not only higher than that of its industry peers but also higher than its own past levels.
What can cause a company’s ROA to be low?
A low ROA may be because the company cannot sell its products, or because poor cost control lets expenses eat into profit. It may also be because the company has invested in fixed assets to expand capacity (so assets rise), but those assets are not yet complete and still sit under long-term assets in progress, so they cannot yet generate profit (net profit unchanged). A falling ROA can also result from inefficient investment: new projects with low profitability that make up a large share of total assets.
The difference between ROA and ROE
ROA can be described as an excellent complement to ROE
The ROE formula:
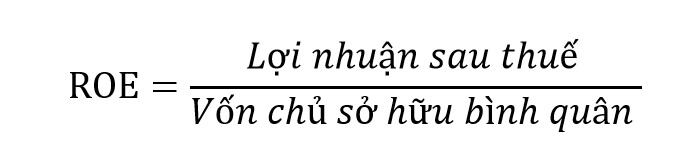
From this formula we can see that ROE does not reveal the company’s capital structure (debt + equity).
Many analysts also use the following formula to calculate ROA:

Example comparing the 2021 ROA and ROE of Masan Group Corporation (ticker: MSN) and Vietnam Dairy Products JSC – Vinamilk (ticker: VNM):

If we used ROE alone, it would be hasty to conclude that MSN and VNM are equally efficient.
When we add ROA, however, we see that MSN is using borrowed money to fund its operations. MSN’s asset management is weaker (its ROA is lower than VNM’s), and its capital structure carries more risk than VNM’s.
By combining these two ratios, we can assess not only how efficient a company’s operations are, but also get a clearer view of its capital structure.
Happy trading!