
Contents of this article
Among financial ratios, ROE is the leading measure of a company’s profitability and a long-time favourite of investors. So what is ROE, how is it calculated, and how do you use it in stock analysis and trading? Let’s find out.

The ROE ratio and how to use it in stock analysis
What is ROE?
ROE (return on equity) is a company’s rate of return on shareholders’ equity, usually calculated over 1 year or the most recent 4 quarters. It is calculated using the formula:
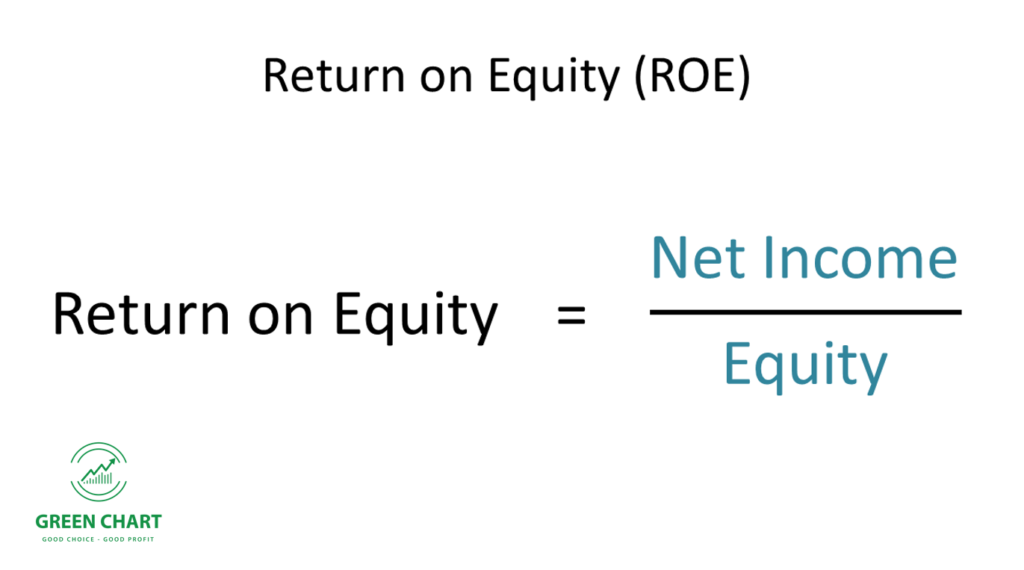
You can easily calculate a company’s ROE from the information in its financial statements. For example, Company X has profit after tax of VND 10 billion, opening equity of VND 30 billion and closing equity of VND 50 billion, so average equity = (30 + 50)/2 = VND 40 billion, and using the formula above you can easily work out that Company X’s ROE is 25%.
To save time, however, you can also look up ROE for free on stock news sites such as cafef and vietstock.
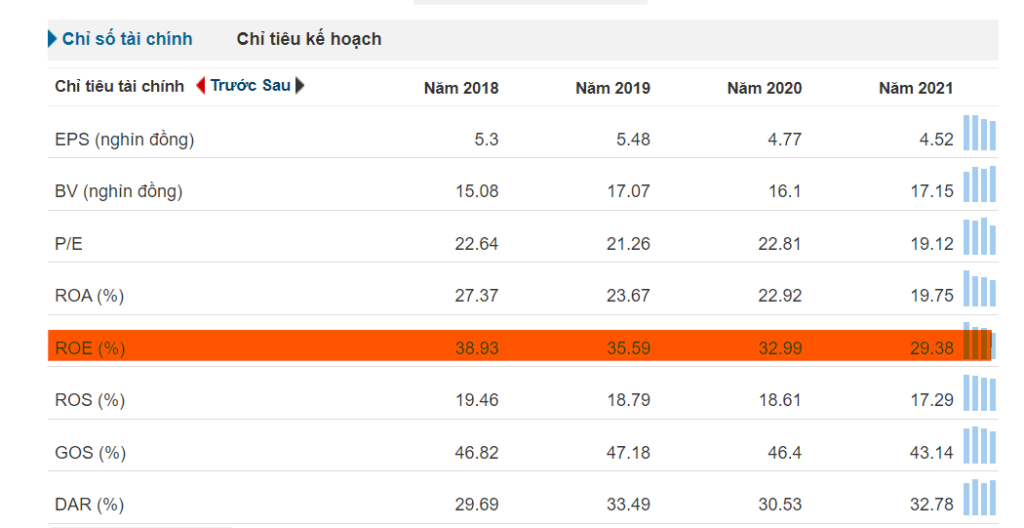
The formula shows that ROE reflects how profitably a company uses its equity – the capital invested by shareholders. It is the most basic profitability measure for any business.
Put simply, a company’s ROE is like the rate of return on an investment portfolio. If your brokerage account holds VND 1 billion and you make a profit of VND 200 million over a year, your annual return is 20%. Here, your net asset value plays the role of shareholders’ equity, and your profit plays the role of the company’s profit after tax. Companies likewise use capital contributed by shareholders to invest in production and business and generate profit, and their rate of return is ROE.
Like many other financial ratios, ROE is used to compare profitability across companies, as well as against the company’s own history. For example, within the same industry, a company with an ROE above the industry average is more attractive than companies with a low ROE.
What is a good ROE?
Obviously, the higher the ROE the better. If ROE is too low, say 5%, below the banks’ deposit rates (6–7%), it shows that the company’s business is not efficient.
Because different industries have different characteristics, ROE levels vary across companies. For example, consumer retail businesses always have to carry large inventories, so ROE in that industry may be low, around 10%. Technology companies, on the other hand, can generate profit without investing heavily in assets, so they can have a high ROE. A good company should have an ROE above its industry average.
In the steel industry, for example, you can see that companies such as HPG, HSG and NKG have ROE (trailing 4 quarters) above the industry average, and they all hold large market shares. A high ROE gives a company more drive to produce, and also grows its capital base for reinvestment and expansion, giving it a stronger competitive advantage. Conversely, companies with a low ROE, such as TVN, POM and TDS, hold little market share in the industry.
As an investor, though, you should look at ROE in more detail: is the ROE high, and can the company sustain it? Is it low, but likely to improve? For example, if a company’s ROE has stayed at 10–15% for the past 5 years but reaches 40% this year, you should first assess whether the drivers of that increase are positive, and whether the company can maintain ROE at that level in future.
A company can certainly manipulate ROE, for instance by changing accounting policies to boost profit, or by borrowing to buy back treasury shares (a cardinal sin).
Using ROE to estimate a company’s growth rate
All of a company’s profit after tax belongs to shareholders and increases shareholders’ equity, so ROE is also a measure of a company’s growth. If all profit after tax is retained, ROE equals the company’s growth rate. Companies usually pay part of their profit out as dividends, however, so the company’s growth rate is adjusted using the formula:
Company growth rate = ROE * Retention ratio
This is known as the company’s sustainable growth rate, an input used in stock valuation, for example in the Gordon Growth Model or the discounted cash flow model. Roughly speaking, if a stock’s growth rate is lower than the company’s growth rate, the stock may not yet be fully valued by the market, or the market may see the company as riskier.
Analysing ROE with the DuPont model
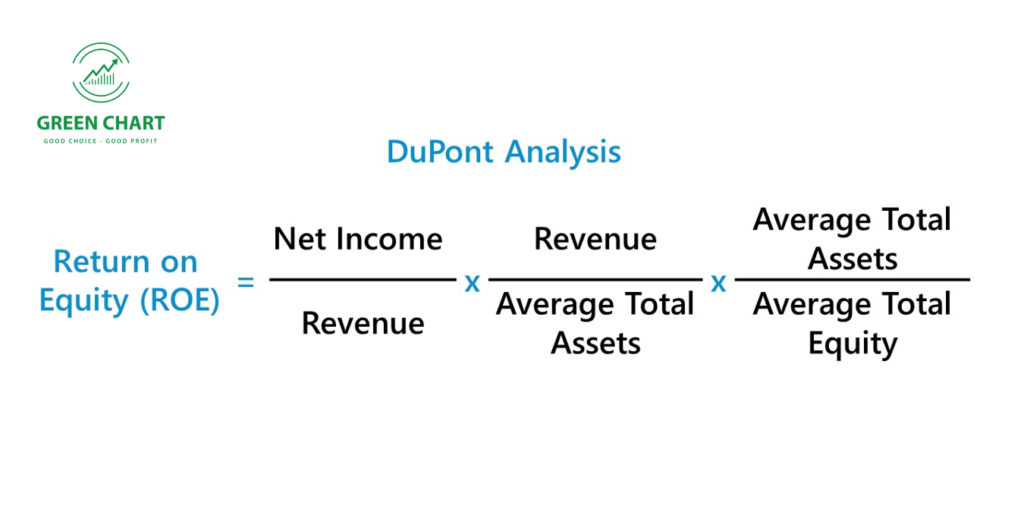
The DuPont model is used to break down ROE, showing why ROE is high or low and what the company needs to improve. DuPont analysis is also very important for comparing companies in the same industry or assessing improvements in a company’s ROE.
The 2-factor DuPont model
We rearrange the ROE formula as follows:
In other words, ROE depends on 2 factors: ROA and the company’s financial leverage. ROA measures how efficiently the company uses its assets, while financial leverage reflects its capital structure: the higher the leverage, the more debt the company uses.
A company can therefore raise its ROE by improving ROA, that is, by allocating assets as efficiently as possible to generate profit: investing in modern, low-cost, high-productivity equipment, hiring rigorously, automating production lines to cut costs, and so on.
Once ROA is optimised, the company can use leverage to lift ROE by borrowing more and using the borrowed capital to expand production. However, high leverage also comes with high risk if the company does not generate enough cash flow to repay its debts on time.
This is just like using a margin loan to boost the return on your portfolio: both profit and risk are magnified.
Take the steel companies below as an example:

We can see that industry leaders such as HPG and HSG have higher ROE than others such as VIS and TIS because they use their assets more effectively, as reflected in their higher ROA. Although HSG’s ROA is lower than HPG’s (showing less efficient use of assets), it has improved its ROE by using more debt. VIS and TIS cannot generate a high ROA, so they use higher leverage to partly make up their ROE.
TNS is a special case: it produces a very high ROE by using a lot of leverage, despite being a company with a small market share and a low ROA. Using too much leverage, however, carries considerable risk.
The 3-factor DuPont model
Rearranging the ROE formula further:

Here we have split ROA into the product of two important ratios: total asset turnover and net profit margin.
Total asset turnover measures how efficiently the company uses its assets to generate revenue. A company with high asset turnover typically shows signs such as production facilities running at high productivity and strong sales and marketing strategies.
Net profit margin reflects the company’s ability to manage costs. A company with a strong market position can use it to negotiate lower input prices with suppliers, improving gross profit. It can also raise profit after tax by cutting other costs, such as staff and management salaries or interest expense (by using less debt), although these approaches are not always optimal (employees lose motivation when their pay is cut, and reducing debt lowers financial leverage).
Look at the example below. The differences in ROE among steel companies in 2020 come from net profit margin. HPG has the lowest cost structure and therefore the highest ROE, and this is the area where companies such as HSG, VIS and TIS need to improve. Moreover, as the leader of the steel industry, HPG may have the bargaining power to negotiate lower input prices with its suppliers.

The 5-factor DuPont model
Rearranging the ROE formula once more:

This formula breaks down the drivers of the company’s net profit margin. A company can improve its net margin by raising its EBIT margin, its interest burden ratio and its tax burden ratio.
EBIT is earnings before interest and taxes, which can be thought of as the net profit from the company’s core operations. EBIT margin therefore improves if the company can cut its operating costs.
The higher the interest burden ratio, the lighter the company’s interest burden. The company needs to limit its borrowing, negotiate lower interest rates on bank loans, or generate enough profit to cover its borrowing costs.
The higher the tax burden ratio, the lighter the company’s tax burden. This ratio is usually hard to change, as the state’s tax policy tends to stay fixed for long periods.
Looking more closely at the 4 companies above, HSG, VIS and TIS all have weaker EBIT margins, reflecting higher operating cost structures. In addition, because VIS and TIS use a lot of leverage, they carry a heavier interest burden (a lower interest burden ratio).

In this article, you have learned the concepts, calculations and meaning of ROE and ROA, as well as how to analyse ROE with the DuPont model. We will meet again in other interesting articles on analysing a company’s key financial ratios.
The “Stock Trading For A Living” course
Green Chart designed this course to give students a solid foundation in fundamental analysis & stock valuation (Fundamental Analysis), and to show them how to integrate it effectively into their existing trading system, especially for traders who already use technical analysis (Technical Analysis). The program consists of 5 theory sessions and 6 months of hands-on guided trading in the live market with the lecturer.
See full details of the course here.
Happy trading!