Contents of this article
What is the Price Rate of Change (ROC) indicator?

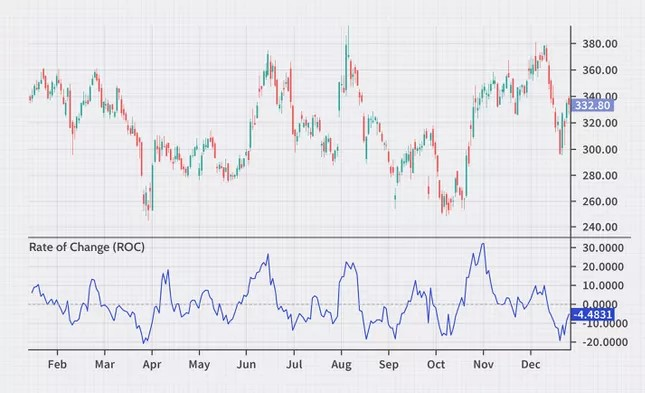
The Price Rate of Change (ROC) is a technical indicator based on price momentum. It measures the percentage change between the current price and the price at a specific point in the past (for example, the price nine sessions ago compared with the current price). The ROC oscillates around a centerline at zero. When the indicator moves above zero (positive territory), the current price is higher than the past price; conversely, when it moves below zero (negative territory), the current price is lower than the past price.
(Note: the “past price” is the price a given number of trading sessions before the current session. Investors can adjust that number of sessions to suit their own approach.)
The indicator can be used to spot divergences, overbought and oversold conditions, and centerline crossovers.
The ROC formula
The Price Rate of Change is calculated as follows:
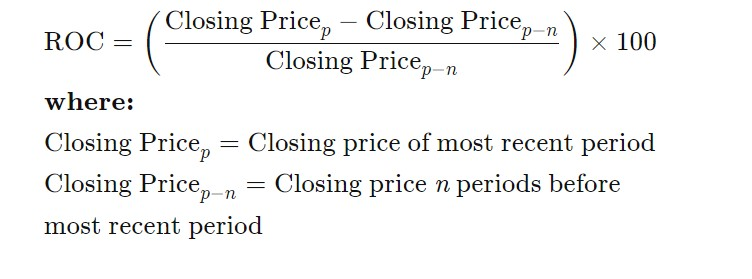
The key step in calculating ROC is choosing the value of “n”. The value of “n” is the number of trading sessions, or the period, counted back from the current session. Short-term traders may choose a small “n”, such as the previous nine sessions. Long-term investors, by contrast, may choose a larger value such as 200 sessions. Smaller values of “n” make the ROC react faster and more sensitively to price changes, but this also means the indicator will produce more false signals. A larger “n” means the ROC reacts more slowly, but its confirmation signals are more reliable when they appear.
- Choose a value for “n” – the number of trading sessions. It can be any number, such as 9, 12, 25 or 200. Short-term traders usually use a smaller “n”, while long-term investors use a larger one.
- Find the closing price of the current trading session.
- Find the closing price “n” sessions before the current session.
- Calculate ROC using the formula above:
ROC = [(Current close – Close “n” sessions ago) / Close “n” sessions ago] × 100%. - Calculate a new ROC value as each new trading session closes.
What does the ROC indicator tell you?
The Price Rate of Change (ROC) is classed as a momentum or velocity indicator because it measures the strength of price momentum through the rate of change. For example, if a stock closes today at VND 10,000 and its close five sessions ago was VND 7,000, the 5-day ROC is 42.85. More precisely, it is calculated as follows:
[(10,000 − 7,000) ÷ 7,000] × 100 = 42.85
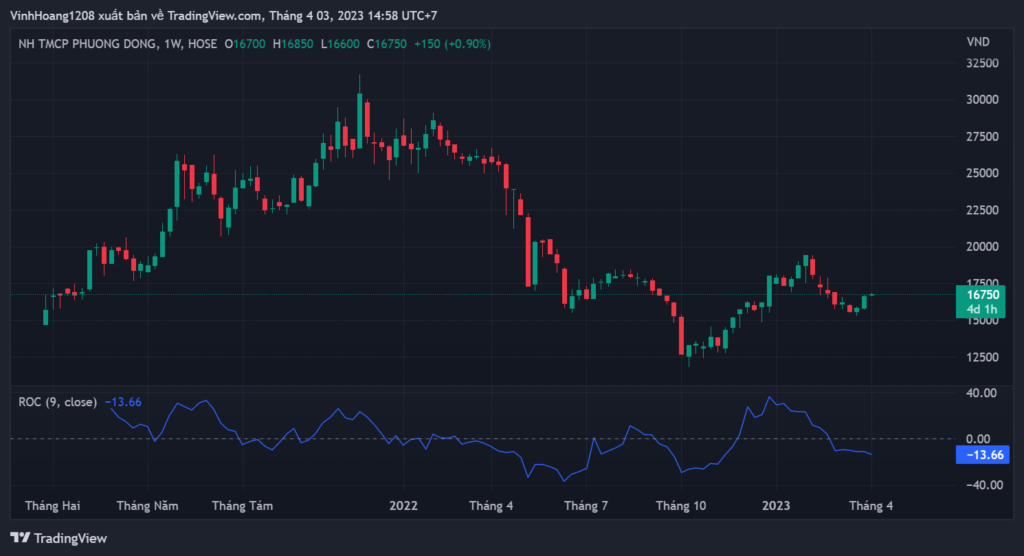
Like most momentum indicators, ROC is plotted in a separate window below the price chart. It uses zero as its centerline, separating positive and negative values. Positive values indicate growing bullish momentum (buying pressure); negative values indicate growing bearish momentum (selling pressure). In short, when ROC rises in either direction, positive or negative, the momentum of the trend is increasing; when the indicator turns back toward zero, momentum is fading.
Crossovers between the ROC line and the zero line can be used to signal a change in the price trend. Depending on the value of “n”, ROC can warn of a trend change early (low n) or very late (high n). ROC is prone to whipsaws, especially around the zero line. For that reason, its signals are usually not used to pick buy or sell points, but simply to alert traders that the price trend may be about to change.
ROC can also be used to identify overbought and oversold zones. Unlike RSI (with its 30–70 or 20–80 bands), however, ROC has no fixed bounds; the levels vary with the asset and the trader’s experience. Traders using ROC need to test historical data themselves to see which ROC values have preceded price reversals in the past. They will usually find both positive and negative levels at which price has reversed with some regularity, and from these they can define the upper and lower boundaries of the overbought and oversold zones. When ROC reaches those levels again, traders become more cautious and watch price action for an entry opportunity.

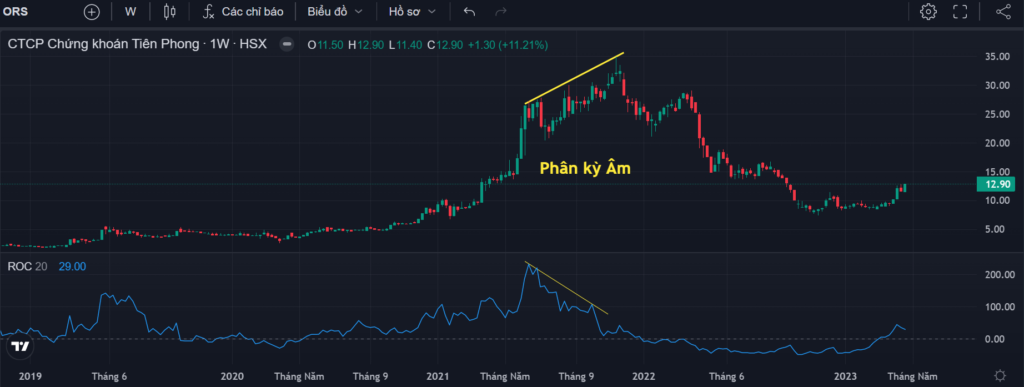
Like RSI and MACD, covered in earlier articles, ROC is also commonly used to identify divergence and convergence that signal a reversal in the price trend. Divergence occurs when the price of a stock or other asset moves in one direction while ROC moves in the opposite direction. For example, a negative (bearish) divergence occurs if a stock’s price rises over a period while ROC is falling, signalling that the current uptrend is likely to reverse. Conversely, a positive divergence (or convergence) occurs if price falls but ROC rises. This may signal a bullish reversal. Keep in mind that divergence is a “non-confirmation” signal that warns traders to be careful; divergences can persist for a long time and do not always lead to a price reversal.
The difference between the ROC and Momentum indicators
These two indicators are very similar and give similar results if you use the same value of “n” for each. The main difference is the formula. ROC divides the difference between the current price and the price “n” sessions ago by the price “n” sessions ago (see the formula at the start of the article), so its values are expressed as a percentage. The Momentum indicator, by contrast, divides the current price by the price “n” sessions ago and multiplies by 100. Both indicators tell the same “story”; however, because they read slightly differently, individual traders may prefer one over the other.
Limitations of the ROC indicator
One potential problem with ROC is that its formula gives equal weight to the current price and the price “n” sessions ago, even though some technical analysts believe that the most recent price action matters more when analysing and forecasting future price moves.
The indicator is also prone to whipsaws (noise), especially around the zero line. When price consolidates sideways, volatility narrows and the indicator keeps hovering around zero. Such periods can produce many false signals for trend-following trades, but on the other hand they help confirm that the market is range-bound and consolidating.
Although ROC can be used for divergence signals, these signals often appear too early. When ROC starts moving against the price trend, price may still continue in the current direction for some time. Divergence should therefore not be used as a trading signal on its own; instead, use it to confirm a trade setup when other indicators and methods are also giving reversal signals.
Conclusion
- The Price Rate of Change (ROC) is an “unbounded” momentum indicator (its values have no fixed upper or lower limit) used in technical analysis.
- A positive ROC rising above zero usually confirms an uptrend, while a negative ROC falling below zero points to a downtrend.
- When price consolidates sideways, ROC moves toward zero. In that case it is important for traders to use other techniques and methods to follow the overall price trend (is price in an up-wave or a down-wave? Is it in a primary or an intermediate trend?), because ROC provides very little information beyond confirming that price is moving sideways.
Happy Trading !
Technical Analysis Course – CMT Level 1
Green Chart designed this course specifically for candidates in Vietnam who want to study and prepare for the CMT Level I exam. The programme includes 27 sessions of theory, practice questions and mock exams. Students also receive the course materials, question bank and mock exams free of charge, and can retake the course for free for life.
See full course details here.