Contents of this article
Fibonacci trading methods can improve performance for both short-term and long-term positions by identifying hidden support and resistance levels. Traders use Fibonacci in combination with other forms of technical analysis to build a solid foundation for their trading strategies, delivering better performance in all kinds of market conditions and levels of volatility.

Leonardo of Pisa – a 12th-century monk and mathematician – discovered a sequence of numbers that appears in nature and in classical works of art. Although his research was purely theoretical, Fibonacci numbers have shown profitable applications in modern financial markets: Fibonacci describes the relationship between the wave structure within a trend and the distance a wave will travel before the trend reverses.
The retracement ratios of 0.382, 0.50 and 0.618 are the golden ratios of the basic Fibonacci structure, found in countless fields such as art, biology, architecture, music, botany and even finance. In addition, traders also use the 0.214 and 0.786 levels to add depth to their market analysis. These secondary golden-ratio levels (0.214 and 0.786) have become increasingly important since the 1990s, as investment funds sought to draw in traders using these criteria in their trade setups, breaking the conventional way of thinking about Fibonacci in technical analysis. As a result, the main Fibonacci levels (0.382, 0.50 and 0.618) have become easier to break, but the structural harmony remains intact.
For example, traders often think that when price reaches the 0.618 Fibonacci retracement level, it will meet “resistance” there and reverse. Today, however, that level is often broken easily, and the 0.786 level instead provides stronger support or resistance. Traders have adapted to this slow evolution, changing their strategies and setups when using Fibonacci to keep up with market movements.
How do you draw Fibonacci correctly?
Fibonacci offers many different trading strategies that help traders make profits, but drawing Fibonacci incorrectly reduces the predictive power and accuracy of this fascinating tool. Traders are often discouraged when their first attempts at trading with Fibonacci don’t work out as well as they imagined, and they abandon the tool for more familiar technical analysis methods and tools. What those who give up easily don’t realise is that consistency, precision and persistence are needed to build a lasting trading edge with Fibonacci.
Many traders who succeed with Fibonacci “cast a net”, or grid, of Fibonacci retracements to analyse pullbacks, reversal points and other price action within the main (primary) trend. A Fibonacci “grid” (described below) can identify whether the trend will reverse or break out through barriers to continue. This analysis forms the basis for a trading strategy, including entry and exit points.
Using Fibonacci retracement
It takes plenty of skill and experience to build a Fibonacci “grid” properly and choose the right anchor points, because the start and end points of a Fibonacci drawing directly affect trading performance by generating buy or sell signals at meaningless prices. The process also requires traders to build a multi-trend grid, with retracement levels placed on both short-term and long-term timeframes, while identifying the price zones likely to be in play (to affect the price trend) for as long as the position is open.
Start building the Fibonacci grid by switching the chart to the weekly timeframe and finding the main (primary) trend. Draw the Fibonacci retracement from the bottom to the top in an uptrend, and from the top to the bottom in a downtrend. Set it to display the 0.382, 0.50, 0.618 and 0.786 levels. The first three ratios act as compression zones in which price can bounce around like a pinball, while 0.786 marks a limit or boundary that may make price reverse.
Now switch to a shorter timeframe and draw a new Fibonacci retracement for that timeframe. Once you are done, your chart will show a series of Fibonacci golden-ratio retracement levels, like “a grid” carefully and tightly aligned. These tight alignments identify support and resistance levels that can stop a pullback and signal that price will keep moving in its main trend (whether higher or lower) – especially when Fibonacci retracement is combined with moving averages (MA or EMA), trendlines or gaps.

An example of applying a Fibonacci retracement “grid”
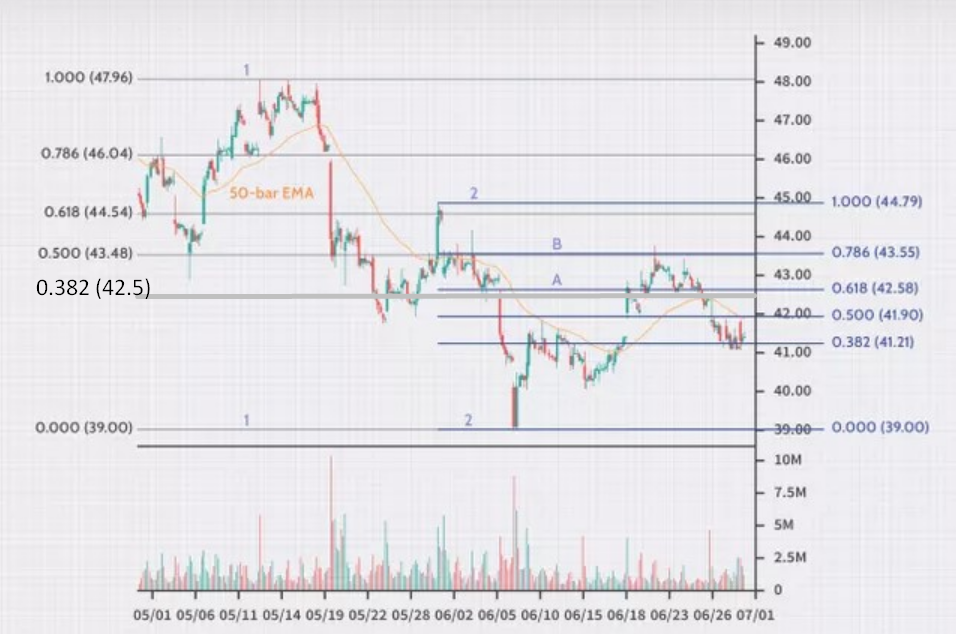
The Fibonacci retracement “grid” method works well in both bull and bear markets and on every timeframe. The chart above shows Delta Air Lines (DAL): the share price fell from $48 to $39 in two downward waves. We can draw a Fibonacci retracement on the long-term downtrend to highlight potential resistance (retracement) levels, while drawing another Fibonacci retracement on the final downward wave to complete the “grid” and find confluence zones of key retracement levels.
The 0.382 retracement of the long-term wave coincides with the 0.618 retracement of the short-term wave (point A), and the 0.500 retracement of the long-term wave coincides exactly with the 0.786 retracement of the short-term wave (point B). You can see that price’s recovery from the bottom in early June slowed when it met point A, before breaking through and rising to point B; there, however, price reacted to the hard resistance at point B and reversed sharply lower.
Drawing Fibonacci extensions
The Fibonacci extension tool works best when pullbacks and breakouts are clearly defined, because that is when the extension can be drawn most accurately. In an uptrend, start the Fibonacci extension at the beginning of the uptrend, extend it to the high that was broken, then drag the third point to the low of the corrective wave.
Conversely, in a downtrend, start at the beginning of the downtrend, extend it to the low that was broken, then drag the third point up to the high of the corrective wave.
For a clearer picture of how to draw Fibonacci extensions, see the example figures below.
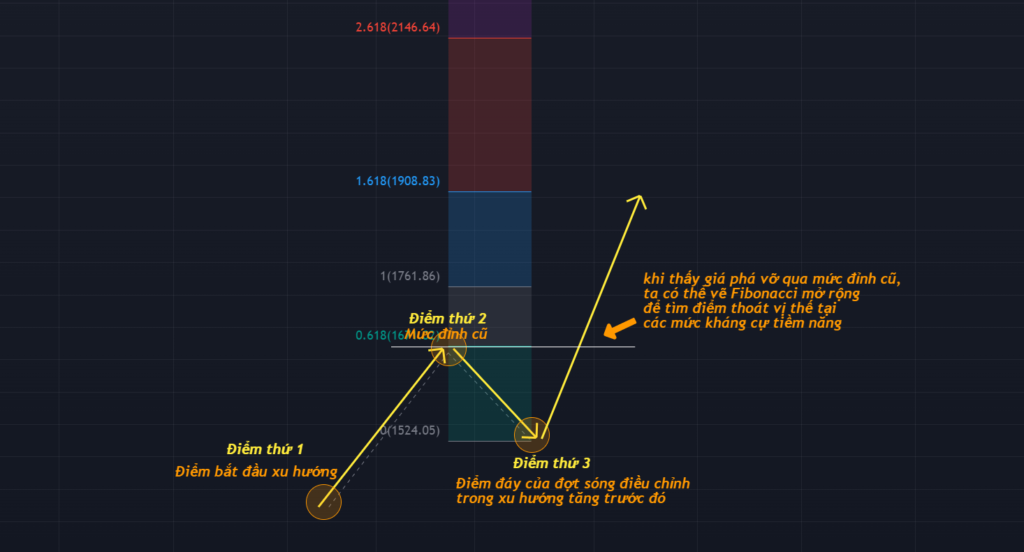

Examples of using Fibonacci extensions in analysis

After a historic rally to $101 (point B), Apple Inc. (AAPL) made an all-time high and entered a corrective decline. Two years later, price bottomed at point A and entered a new explosive rally. At this point, a technical analyst could draw a Fibonacci extension using points A and B to identify potential resistance levels. The extension levels showed potential resistance at $130 (0.618), $145 (1.00) and $173 (1.618). The stock peaked a few months later right at the 0.618 extension level and fell back to $101 – the support zone at the old high.
Another example: applying Fibonacci extensions to analyse HAH (Vietnamese stocks).
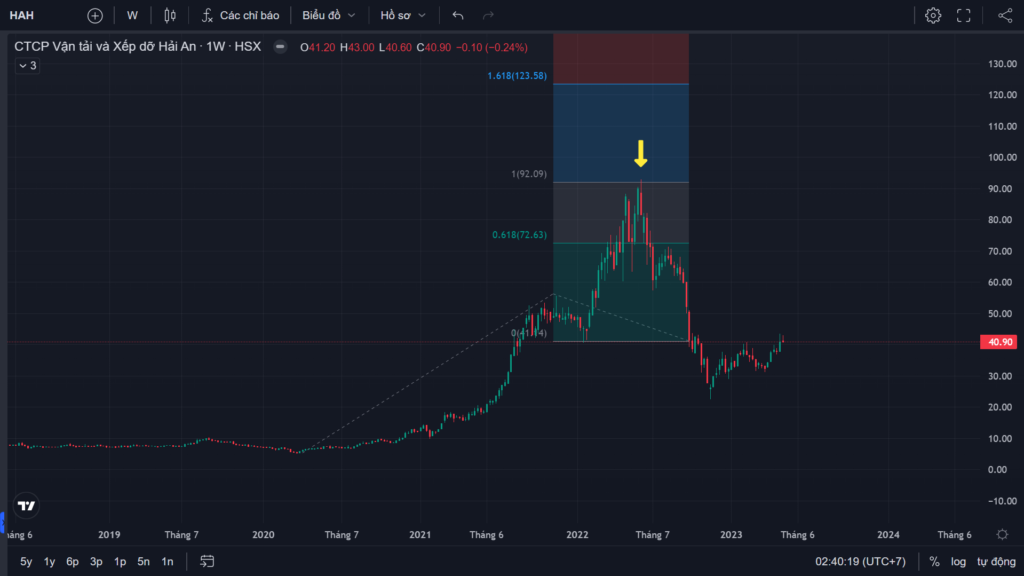
You can see that, with the Fibonacci extension drawn correctly, after a very large rally that broke the old high in 2022, HAH’s advance ran into the 1.0 Fibonacci extension level and has reversed sharply lower since then.
Combining Fibonacci with other technical indicators
How reliably retracement levels “stop” the price trend and generate profits correlates directly with the number of technical factors in confluence with them. These factors can include Fibonacci retracements on other timeframes, moving averages, trendlines, gaps, support and resistance levels, and momentum indicators in overbought or oversold zones…
For example: adding a 50- or 200-period moving average adds to each position’s “edge”.
This approach also applies to exits: traders can take profit when price reaches hard barriers defined by the confluence of a retracement level and other technical factors.

EURJPY fell from 133.75 to 131.05 in just six hours, creating a very strong, near-vertical downtrend that is ideal for Fibonacci retracement. The counter-trend wave rose for four days and finally reached the 0.618 retracement in confluence with the EMA(200); after that, the rate fell sharply to lower levels. Traders who sold EURJPY short around 132.80 had a very profitable trade.
Happy trading !
Technical Analysis Course – CMT Level 1
Green Chart designed this course specifically for candidates in Vietnam who want to study and prepare for the CMT Level I exam. The programme includes 27 sessions of theory, practice questions and mock exams. Students also receive the course textbook, question bank and mock exams free of charge for their exam preparation, and can retake the course for free for life.
See more details about the course here.