Contents of this article
When analysing a stock, investors look not only at price but also at data on the stock’s trading volume. So what exactly is volume, what does it mean and how is it determined? To answer these questions, we explore the topic in the rest of this article.
What is trading volume?
Trading volume is the number of securities traded over a given period (per trading session), which can also be understood as the liquidity (reflecting money flow) of that security.
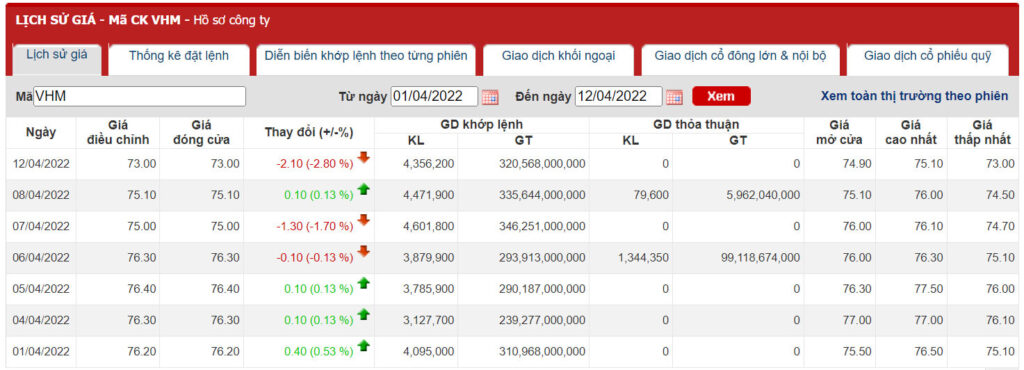
For example, in the trading session on 12 April 2022, 4,356,200 VHM shares of Vinhomes JSC were successfully bought and sold (matched), so 4,356,200 was VHM’s trading volume that day.
What does trading volume tell you?
By following a stock’s trading volume, investors can draw several conclusions:
First, trading volume helps show how much demand there is for the stock in the market. A stock with high trading volume is attracting more investor interest.
If selling volume dominates, we need to ask why – has some negative news hit investor sentiment and caused them to dump the stock? Conversely, if buying volume dominates, investors may well be “accumulating” in strong expectation that the price will rise.
Second, through trading volume, investors can make predictions about the price trend and choose suitable investment strategies. If supply exceeds demand – that is, selling demand rises – the stock price tends to fall in order to attract buyers. Conversely, when buying demand exceeds selling demand, the stock price tends to be pushed higher.
Where can you find trading volume statistics?
To find trading volume statistics for stocks, a simple option is to use a financial and stock market information website widely used in Vietnam: Vietstock. Here is how:
In the Market section, choose “Trading results“


Here, you can adjust the filters to suit your search, including:
- Exchange: HOSE/HNX/VN30/HNX30/UPCoM
- Ticker/index, including the VN-Index, covered warrants and every stock in the market.
- Period: choose the timeframe over which you want to see trading volume
Once you have filled in all the fields above, you can read the trading volume in the table below, in the Total Volume column – total trading volume, including both order-matched and negotiated (put-through) trades.
In the example above, total trading volume on HOSE for all securities from 13 March 2022 to 13 April 2022 was 82,566,400, of which 58,261,200 was traded through order matching and 24,305,200 through negotiated deals.

If you want trading volume data for a particular stock, you can look it up and see all the details – dates, trading volume, trading value, market capitalisation and so on. For example, choosing VHM to follow its trading volume from 1 April 2022 to 13 April 2022 gives the following result:

You can save this data as an Excel file for your own analysis. You can also add or remove data columns as needed using the “Customise columns shown in the grid” option.
In this article, we have looked at what trading volume is and how to look up trading volume data. It is one of the key pieces of information that helps investors understand a stock’s liquidity and form views that shape future buy/sell decisions.
Next, we will look at a more detailed article on analysing and applying volume in trading decisions.
Technical Analysis Course – CMT Level 1
Green Chart designed this course specifically for candidates in Vietnam who want to study and prepare for the CMT Level I exam. The programme includes 27 sessions of theory, practice questions and mock exams. Students also receive the course materials, question bank and mock exams free of charge, and can retake the course for free for life.
See full course details here.
Happy trading !