Contents of this article
- What is the Bollinger Bands indicator?
- Bollinger Bands parameters
- How is the Bollinger Bands indicator calculated?
- Characteristics of Bollinger Bands
- How to trade with Bollinger Bands
- Bollinger Squeeze
- Bollinger Bounce
- W-Bottoms
- M-Tops
- John Bollinger’s 22 rules for using Bollinger Bands
- Technical Analysis Course – CMT Level 1

What is the Bollinger Bands indicator?
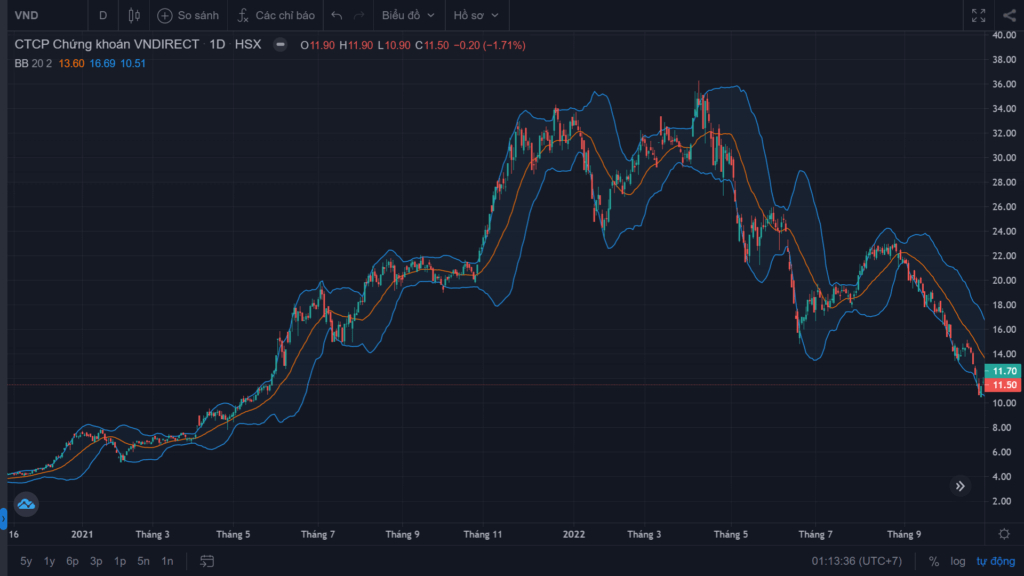
Bollinger Bands – BB for short – is a very popular technical indicator today. It was developed by John Bollinger, CFA, CMT and is used to measure market volatility. The indicator consists of three lines: a moving average in the middle and two bands above and below the MA, each set an equal distance from the MA equal to a multiple of the standard deviation (SD) of price. The three lines never cross, so the upper and lower lines move together like a “band”.
Bollinger Bands parameters
Bollinger Bands is a technical indicator that combines a simple moving average (SMA) with standard deviation. BB has three main components:
- Upper Band: the middle band plus, typically, 2 standard deviations.
- Middle Band: the 20-period simple moving average (SMA 20).
- Lower Band: the middle band minus, typically, 2 standard deviations.

How is the Bollinger Bands indicator calculated?
Like many other indicators, BB can be customised with two variables (m, n). First, the base component of the Bollinger Bands is a moving average MA(m), the middle line; traders usually use the SMA(20). Next, at any given point, we calculate the standard deviation of the set of prices over m candles, consisting of the current candle and the m – 1 most recent previous candles. If you have studied probability and statistics, you will remember that standard deviation is calculated with the formula below (if you have not, you only need to remember this formula):

From the MA and the standard deviation, we can then build the “upper and lower Bollinger Bands” using the formulas below:
- Upper Band = MA + nσ
- Lower Band = MA – nσ
Most commonly, the upper and lower bands are calculated by adding or subtracting 2 standard deviations (i.e. n = 2). In that case, about 90% of prices fall within the Bollinger Bands.
In short, the Bollinger Bands indicator is calculated simply as follows:
- Upper Band = SMA(20) + 2 x standard deviation (of the 20-day SMA values)
- Middle Band = the average of closing prices
- Lower Band = SMA 20 – 2 x standard deviation (of the 20-day SMA values)
Note: the SMA setting (the Bollinger Bands middle band) can be changed according to each trader’s own view.
Characteristics of Bollinger Bands
Bollinger Bands is one of the best-known and most popular technical indicators among traders. Many traders believe that the closer price moves to the Upper Band, the more overbought the market is, and the more price hugs the Lower Band, the more oversold the market is.
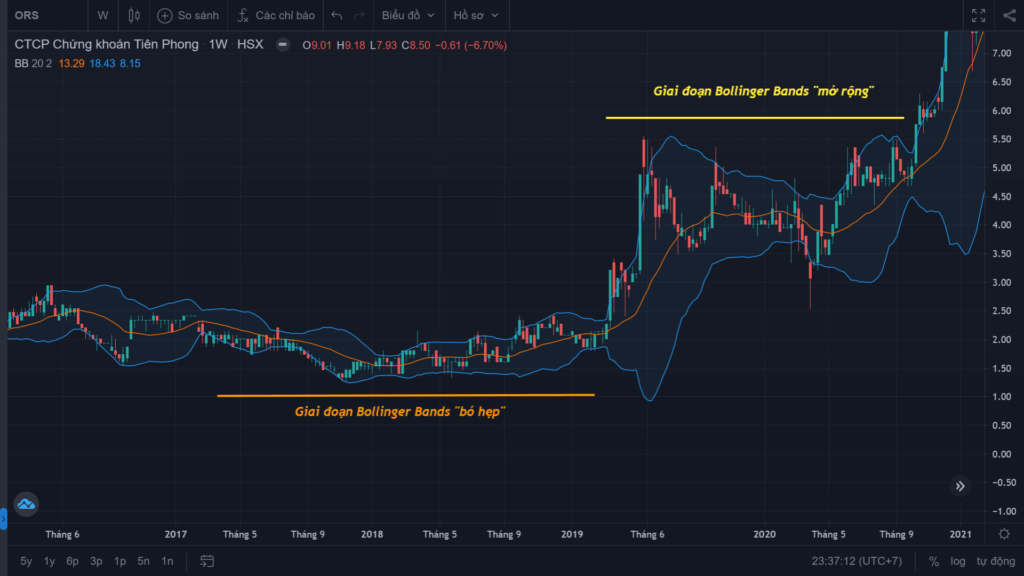
Standard deviation is used to build the BB indicator. Roughly speaking, standard deviation measures how volatile price is: the larger the standard deviation, the more volatile price is, and the wider the Bollinger Bands become. Conversely, the Bollinger Bands contract during periods of low market volatility.
The BB indicator is built from a moving average, and like a moving average, Bollinger Bands are classed as a lagging indicator.
How to trade with Bollinger Bands
Let’s look in depth at the two most effective trading applications of Bollinger Bands.
Bollinger Squeeze
This is the traditional, simplest and most popular strategy for using Bollinger Bands: when price breaks out through a band (the Upper or Lower Band), you should open a position in the direction of the breakout. This is because BB is usually used to identify the start of a new trend, not to define a trading range, as many investors mistakenly believe.
When the bands contract, an explosive phase usually follows and price escapes very quickly. If a candle starts to break out above the upper band, price will usually keep rising. If price breaks below the lower band, it is likely to keep falling.
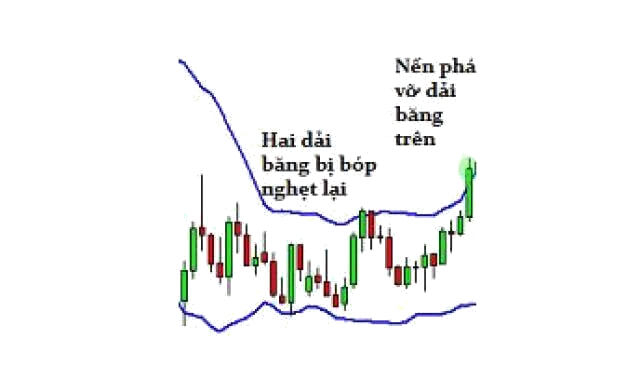
In the example above, you can see the bands squeezing. Price has just started to break above the upper band. Can you predict where price will go next?
If you answered “up”, you are right again! That is a basic example of how a band squeeze works. This trading strategy is designed to help you catch volatility quickly. Only 10% of price data falls outside the bands, so these price signals can be noteworthy. However, these breakouts are not considered reversal signals; many traders treat them as trend-following buy or sell signals.

In addition, when the Bollinger Bands narrow, it signals that market volatility has fallen and price is entering a consolidation phase. At this point many investors expect the bands to widen again and the market to enter a trend. Even so, this is hard to treat as a buy or sell signal, because BB tells you nothing about when volatility will return or which direction price will move.
Bollinger Bounce
The commonly used BB (20, 2) contains about 90% of price data. So price tends to return to the centre of the bands. That is the main idea behind the Bollinger Bounce – trading when price touches and bounces off the upper or lower band. Look at the example below and predict what price will do next.
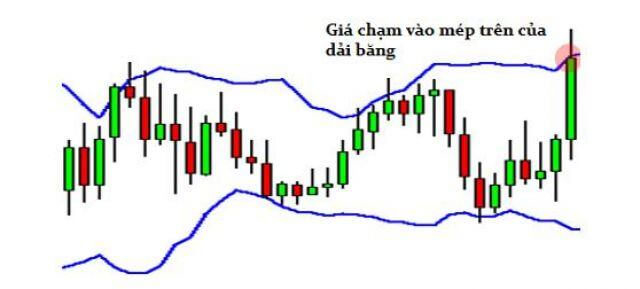
If you answered “down”, you are right. As you can see, price bounced back down towards the centre of the bands.

What you have just seen is the basis of trading bounces off the Bollinger Bands. The bounces happen because the bands act as dynamic support and resistance. The higher the timeframe you use, the stronger the support and resistance from the bands. Many traders have developed trading systems based on this. Such systems work best in a sideways market.
The figure below is a real example: you can anticipate a stock’s direction in a sideways market after price touches the Bollinger Bands.
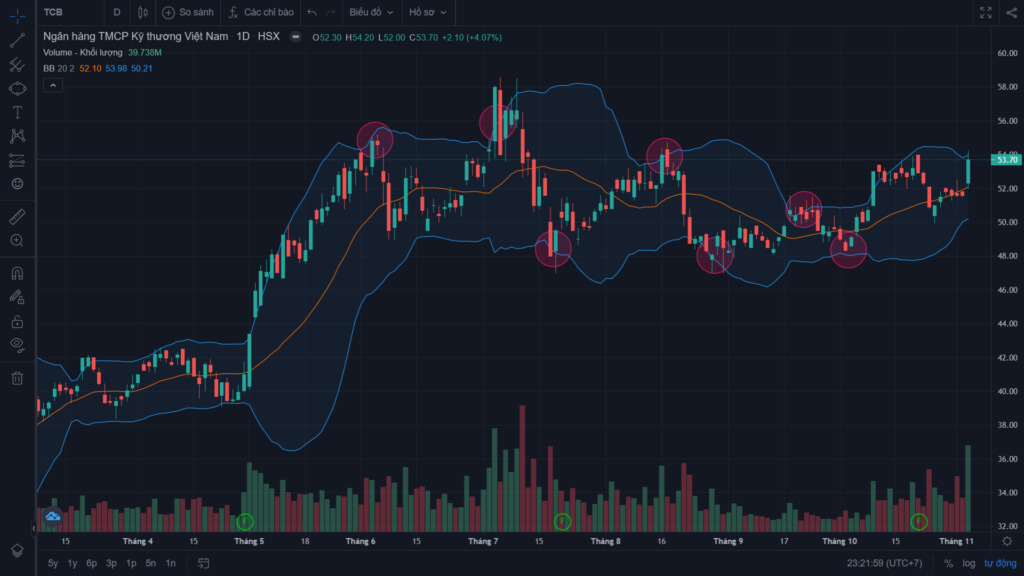
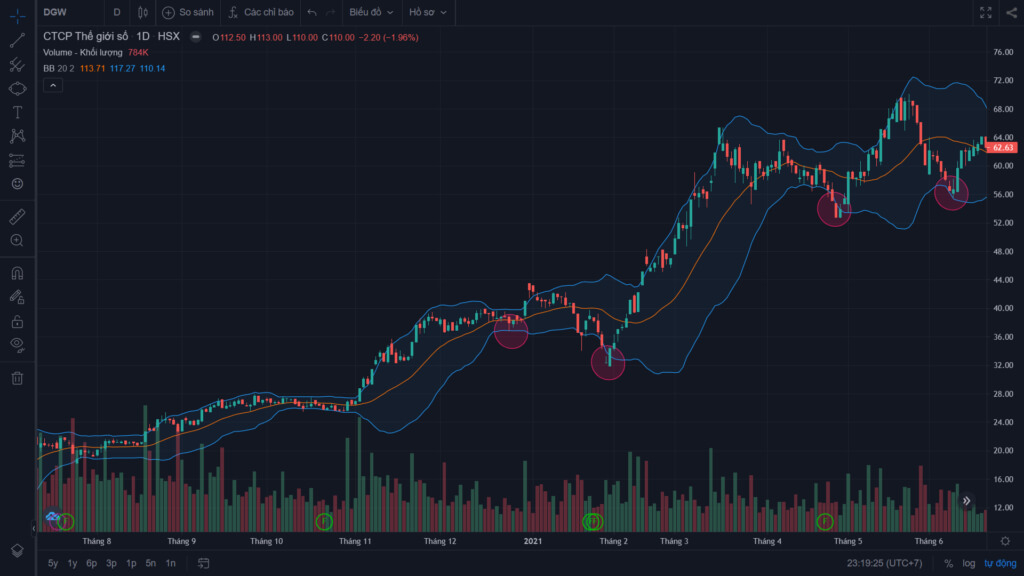
In a trending market, it is best to trade with the trend and not try to fight the market. When a stock is in an uptrend, you can enter a buy order when price touches the lower Bollinger Band.
Besides the two methods above, which investors around the world love to use, Green Chart will introduce two more advanced Bollinger Bands trading methods that are interesting and highly effective.
W-Bottoms
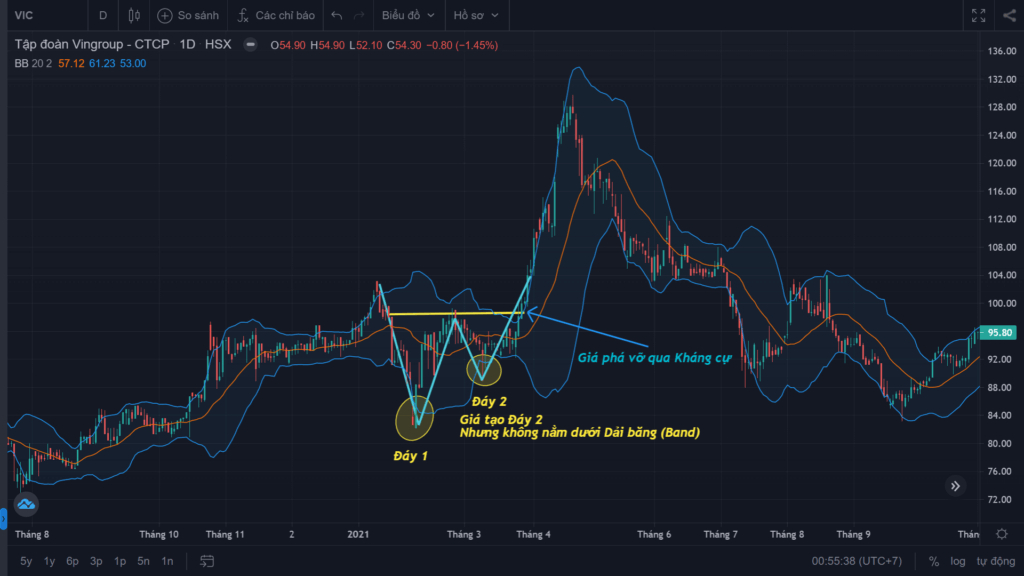
The W-Bottom is part of Arthur Merrill’s research. John Bollinger used various W-shaped patterns together with Bollinger Bands to identify W-Bottoms – a pattern with two troughs (forming a W) that forms in a downtrend, in which the second trough is lower than the first but still stays above the Lower Bollinger Band.
There are four stages to confirming a W-Bottom with Bollinger Bands:
- Price forms the first trough (the first trough is usually, but not always, below the Lower Bollinger Band).
- Price rebounds above the Middle Bollinger Band.
- Price falls again to form the second trough (this second trough must stay above the Lower Bollinger Band). Price holding above the Lower Band shows that the downtrend’s momentum has weakened.
- Finally, the pattern is confirmed when price breaks strongly above resistance (formed between stages 2 and 3).
M-Tops
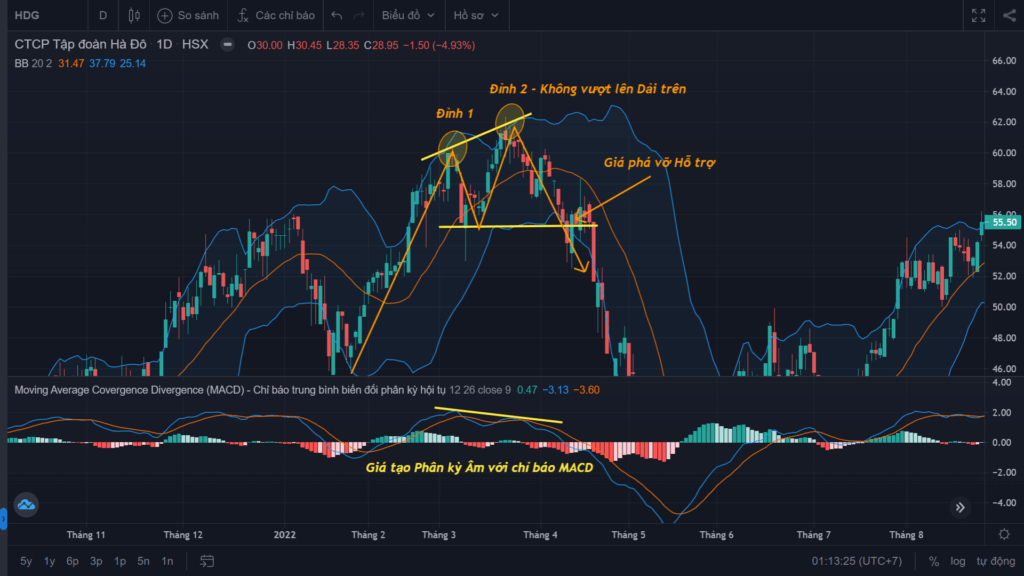
The opposite of the W-Bottom is the M-Top, which forms in an uptrend. However, according to John Bollinger, identifying an M-Top accurately is usually harder than identifying a W-Bottom. He therefore recommends that investors also look for “non-confirmation” signals when price makes new highs.
To identify an M-Top, we also watch for four stages:
- Price forms the first peak (the first peak can be higher or lower than the second peak).
- Price pulls back towards the Middle Bollinger Band.
- Price rises again to form the second peak (the second peak does not rise above the Upper Bollinger Band). At the same time, momentum indicators do not confirm the uptrend. Price failing to exceed the Upper Band, together with momentum non-confirmation, shows that the uptrend’s momentum has weakened and warns of a trend reversal.
- Finally, the pattern is confirmed when price breaks strongly below support (formed between stages 2 and 3).
John Bollinger’s 22 rules for using Bollinger Bands
Below are the lessons John Bollinger and his colleagues have drawn from 30 years of using this indicator. You can use Bollinger Bands in many different ways, but these rules can still be applied effectively.

1. Bollinger Bands provide a relative definition of high and low prices. By that definition, prices are high at the upper band and low at the lower band.
2. That relative definition can be used to compare price action and indicator action to arrive at rigorous buy and sell decisions.
3. Appropriate indicators can be derived from momentum, volume, sentiment, open interest (OI), intermarket data and so on.
4. If you use more than one indicator, the indicators should not be directly related to one another. For example, a momentum indicator might be used alongside a volume indicator, but two different momentum indicators are sometimes no better than one.
5. Bollinger Bands can be used in pattern recognition to define or clarify pure price patterns such as M-Tops and W-Bottoms.
6. Price moving outside the Bollinger Bands is not a trading signal in itself. Price breaking above the upper band is not a sell signal, and price breaking below the lower band is not a buy signal.
7. In trending markets, price can walk the upper band or the lower band continuously.
8. A close outside the Bollinger Bands is, in the short term, a continuation signal, not a reversal signal. (This is the basis of many successful breakout trading systems.)
9. The default parameters – a 20-period MA and 2 standard deviations for the band width – are just defaults. The parameters actually needed for different markets may differ.
10. The moving average in the middle of the Bollinger Bands does not generate trading signals when price crosses it. Instead, it describes the intermediate-term trend.
11. If the average is lengthened, the width of the bands should be increased: from 2 to 2.1 standard deviations if you change the MA 20 to an MA 50. Likewise, when shortening the MA 20 to an MA 10, the band width should be adjusted to 1.9 standard deviations.
12. Traditional Bollinger Bands are based on a simple moving average (not an EMA). This is because the simple average used to build the SMA is also used in the standard deviation calculation, and we want to be logically consistent.
13. Bollinger Bands based on an EMA eliminate sudden changes in band width caused by large price moves. In that case, you need to calculate the standard deviation using the exponential average, not the simple average.
14. Do not make statistical assumptions based on the use of standard deviation in building the Bollinger Bands. Stock prices are not normally distributed, and the sample size in most Bollinger Bands data is too small for statistical significance. (In practice, 90% of price data lies between the two outer Bollinger Bands.)
15. %B tells us where the current price sits relative to the two Bollinger Bands, using the formula below:

16. %B has many uses; among them are identifying divergences, recognising patterns and coding trading systems that use Bollinger Bands.
17. Other indicators can also be normalised with %B, by building Bollinger Bands on the indicator itself and then calculating the indicator’s %B value.
18. BandWidth tells us how wide the Bollinger Bands are. With the default parameters, BandWidth is exactly four standard deviations.
19. BandWidth has many uses. Its most popular use is identifying Bollinger Band squeezes, but it is also useful for identifying changes in trend
20. Bollinger Bands can be used on almost any traded instrument, including stocks, indices, foreign exchange, commodities, futures, options and bonds.
21. Bollinger Bands can be used on many different chart timeframes, such as M5, H1, D1 and even weekly charts. What matters is that there is enough price data to give a clearer picture of how prices are formed.
22. Bollinger Bands do not provide continuous signals; instead, they help identify setups where the odds may be in your favour.
Technical Analysis Course – CMT Level 1
Green Chart designed this course specifically for candidates in Vietnam who want to study and prepare for the CMT Level I exam. The programme includes 27 sessions of theory, practice questions and mock exams. Students also receive the course textbook, question bank and mock exams free of charge for their exam preparation, and can retake the course for free for life.
See more details about the course here.
Happy trading !