
Will the history of stock market bubbles repeat itself? The stock market has just been through a boom. Since April 2020, the VN-Index has risen by more than 130%, gaining over 880 points and repeatedly breaking all-time highs. Will the market keep rising, or is it heading into a run of painful down days?
If you are an investor, you certainly do not want to lose money to a stock market bubble. So what is a bubble in the stock market? And how can we recognize the signs of one?
This article will answer those questions about stock market bubbles.
What is a stock market bubble?
A stock market bubble is a very sharp rise in share prices far beyond their true value. A bubble forms because of a sudden short-term surge in investor demand for certain stocks. It goes beyond optimism about a rising market and is driven by the fear of missing out while other investors make huge profits.

What is a stock market bubble? Signs of a stock market bubble. One bubble that investors of the 1990s will surely never forget is the dot-com technology bubble.
At the time, a great many investors were swept up in the Internet frenzy.
In just over a year, they kept pouring money into web-based businesses, driving the Nasdaq up by around 200%. The rally was fuelled by billions of dollars flowing into bubble stocks of Internet and software companies that were not making any profit. But the good times did not last: the bubble burst in early 2000, and the Nasdaq fell by around 80% over the following few years.
What are the stages of a stock market bubble?
According to American economist Hyman Minsky, a stock market bubble unfolds in five stages:
Stage 1: Displacement
This stage occurs when investors start to be dazzled by a new paradigm, such as a new product or technology, low interest rates, or anything else that captures their attention.
Stage 2: Boom
Prices start to rise slowly, then gather momentum as more and more investors are drawn into the market. This sets the stage for the boom. The prevailing trading psychology is the fear of being left out, and many people get FOMO, so ever more people pile into stocks.
Stage 3: Euphoria
When everyone is euphoric and share prices are soaring, nobody cares about caution any more; people throw it to the wind. The “greater fool” mindset can be found everywhere in the market.
Stage 4: Profit-taking
Predicting when a bubble will burst is not easy and is extremely risky for an investor’s portfolio, because the market can stay irrational far beyond what we imagine. Once a bubble bursts, it cannot be reinflated. Still, those who can read the signs can lock in profits by selling their shares.
Note that even a relatively small event can be the straw that breaks the camel’s back. Sometimes, however, a fresh gust of air blows in and keeps the bubble inflating. For example, in August 2007, French bank BNP Paribas froze withdrawals from three investment funds holding US subprime mortgages because it could not value those holdings. Although this initially caused alarm in financial markets, it was ignored over the next few months as global stock markets hit new highs. In hindsight, that relatively small event was a real warning sign of the dark period that followed.
Stage 5: Panic
In this stage, share prices reverse completely and plunge as quickly as they rose. Market participants face margin calls while the total value of their portfolios falls sharply. So they want to sell at any price. Supply overwhelms demand and share prices collapse.
Vietnam’s 2007 stock market bubble
According to an IMF report dated 1 March 2007, when HOSE had only 107 listed stocks, 17 stocks (16% of the market) had P/E ratios above 43.24, and 46 stocks (43% of the market) had P/E ratios above 20.
On 12 March 2007, the VN-Index hit an all-time high, closing at 1,170.67 points. From just 300 points in early 2006, the VN-Index had risen roughly 3.9-fold in little more than a year. Market capitalization, which was only about 22% of GDP in 2006, reached 40% of GDP in 2007.
In 2006–2007, the stock market was likened to a tsunami, with everyone rushing to invest in stocks. Talk of stock investing spread from street-side tea stalls to markets and family dinner tables. Back then, you could buy any stock with your eyes closed and still make money. Making money in the market seemed far too easy for everyone, and people took profits for granted.
The main driver of that peak was a wave of IPOs by state-owned enterprises, notably Bao Viet, Vietcombank and Phu My Fertilizer. Supportive macroeconomic factors, monetary policy and Vietnam’s accession to the WTO also helped push the market to its peak.
In 2007, several large US lenders filed for bankruptcy. Frightened depositors rushed to withdraw their money and banks were starved of credit. The turmoil spread like a contagion to many other countries.
2008 became a dark year for the stock market. Investment bank Lehman Brothers, one of the oldest financial institutions in the United States, declared bankruptcy, “lighting the fuse” for a global economic crisis. By year-end, the VN-Index had fallen more than 605 points (-65%) from the first session of the year, to just over 315. Inflation in Vietnam soared.
Stock after stock fell to the floor price, fear spread, and herd behaviour meant everyone was selling with no buyers at all. Stocks lost their liquidity, most investors could not get out of the market, and losses of 70–80% of capital were commonplace. Many stocks fell to VND 3,000–5,000, and “iced-tea stocks” (shares priced like a glass of street-side iced tea) sprang up like mushrooms after rain.
Those without a solid grounding in the stock market and in stock market bubbles paid a heavy price, suffering severe losses or even losing everything.
Brokerage firms kept force-selling margin positions, and the market went into free fall. On 5 March 2008, many investors even protested at the State Securities Commission, but “one swallow does not make a spring”.
On 27 March 2008, the daily price limit on HOSE was cut from +/-5% to +/-1%, and on HNX from +/-10% to +/-2%. The State Capital Investment Corporation (SCIC) was allowed to buy shares to stabilize the market. Commercial banks and brokerage firms were urged to stop forced selling, and companies were encouraged to buy back their own shares.
Despite all these efforts, the VN-Index rose for only a dozen sessions before resuming its decline; three months later it was below 370 points. By February 2009, the VN-Index was at around 240 points.
Looking back at Vietnam’s stock market in 2007, those who kept a clear head and walked away with huge gains were as rare as leaves in autumn, while losing everything was the norm.
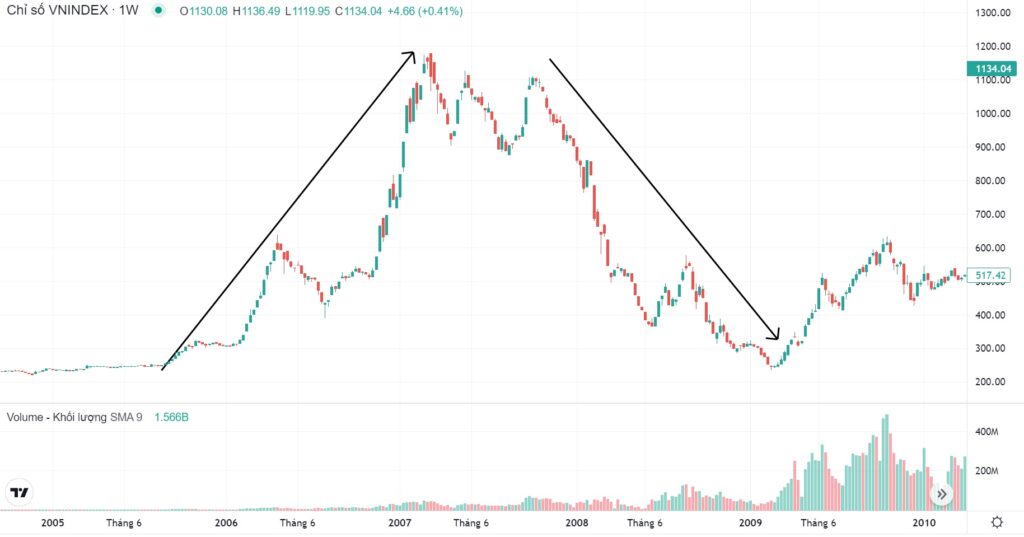
Looking back at Vietnam’s stock market in 2007, those who kept a clear head and walked away with huge gains were as rare as leaves in autumn, while losing everything was the norm.
Stock market bubbles through the lens of behaviour and the “greater fool” theory
Stock market bubbles from a behavioural perspective
When a stock market bubble occurs, prices rise at a dizzying pace. The media then rush in, embellishing the story: young men who got rich overnight, new F0 investors who doubled their accounts in a few months, a booming economy, and so on. This draws even more people into the market in search of huge profits. Existing investors, cautious at first, eventually cannot resist the speed at which profits are growing and pour in more money
This makes the market rise quickly and abruptly. Imagine you started with just VND 100–200 million, and every morning you woke up VND 10–20 million richer: how would you feel? As your gains multiply day after day, many people become blind to the fact that a bubble is forming. You must always keep a clear head and seize opportunities wisely when facing the market and bubbles, so you do not turn into a wild animal.
The greater fool theory
We humans are always greedy to get rich, and we are always envious of those who are better or richer than us. That is why the greater fool theory exists.
Many people trade in crypto markets such as bitcoin and other coins, where on some days profits soar. Many of them can see that sooner or later the market will collapse, perhaps even to zero, yet instead of pulling out, they keep pumping in more money. This shows a clear conflict between awareness and behaviour, because somewhere in their minds they still believe they will get out at just the right moment and avoid the crash. The idea of tripling or quadrupling their money, or more, in just a few days, and pulling out just before the bubble bursts, is irresistible.
If everyone thinks they are smart, then who is the fool?
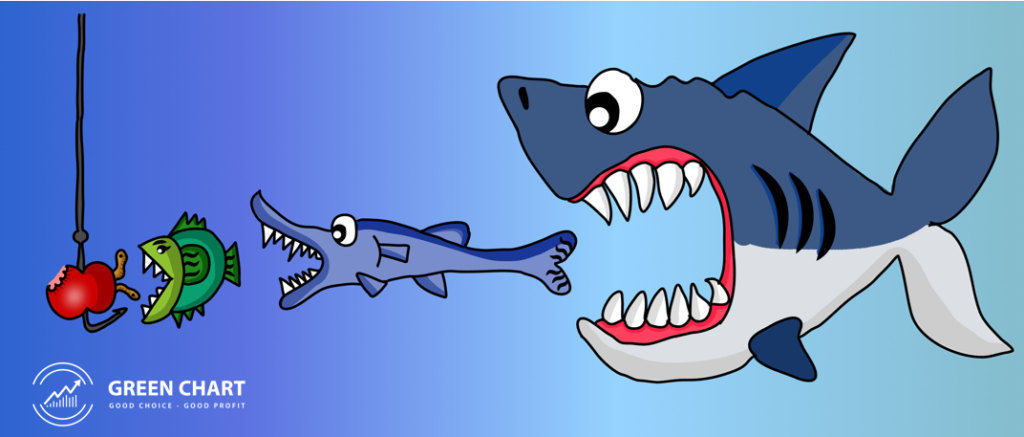
How can you avoid getting caught in a stock market bubble?
- Understand clearly what happens when a bubble bursts.
- Learn to recognize the signs of a stock market bubble.
- And… know when enough is enough!
What happens when a stock market bubble bursts?
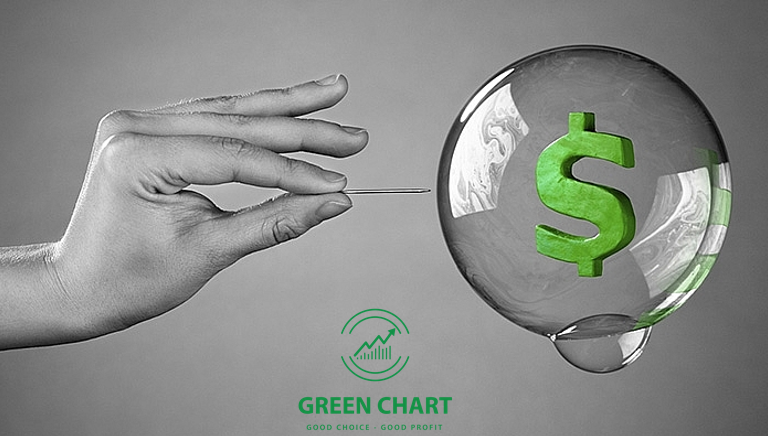
What happens when a stock market bubble bursts?
A bursting bubble is a rapid and large fall in share prices. A chain reaction sets in, with many investors racing to sell all their shares and pull their money out of the stock market. These actions happen at the same time and combine into waves of heavy selling with few or no buyers, and investors’ portfolios suffer severe losses as a result.
Signs of a stock market bubble
Share prices skyrocket
A bubble always involves a red-hot price rally.
But a strong rally does not always mean a bubble, because the stocks may previously have been undervalued.
A bubble occurs when valuations rise above their historical averages (using historical data as the benchmark).
Investors can use the P/E ratio to assess this.
The extent of the price rise can give us clues about how likely a bubble is.
The economy has grown for many years in a row
Economic bubbles often appear after several years of solid economic growth, which convinces investors that the market will keep climbing higher and higher.
For example, the US stock market bubble of the 1990s appeared in the last three years of a nine-year economic expansion, right after a 15-year period of strong stock market gains.
The arrival of something new
Another common feature of bubbles is some new development in the economy that feeds the belief that prices will keep rising.
In the 1990s, it was the arrival of personal computers and the trend toward working online, which boosted productivity in the US economy.
Public and media attention
The public and the media take an ever greater interest in the market, as reflected in mainstream news coverage.
Many stories focus on the sensational side, with hot rallies making many people rich overnight.
Another stream of coverage warns of a bubble and its risks, criticizing speculators and sometimes the authorities for allowing the bubble to form.
In the late 1990s, for example, leading publications such as The Economist and the Financial Times repeatedly warned of a bubble in the US stock market. When the bubble burst, they were very pleased with their forecasts.
And finally, the most important thing…
In every situation, you must always know where a company’s true value lies. Only then can you come through crises and downturns.
Happy trading!
The “Stock Trading For A Living” course
Green Chart designed this course to give you a solid grounding in fundamental analysis & stock valuation, and to show you how to integrate it effectively into your existing trading system, especially if you already trade with technical analysis. The programme includes 5 theory sessions and 6 months of hands-on trading guidance in the live market with the lecturer.
Find out more about the course here.