
Contents of this article

Financial statements are arguably the single most important source of input for analysing a business. They provide the figures on a company’s financial position, asset structure, business performance and its ability to generate cash flow.
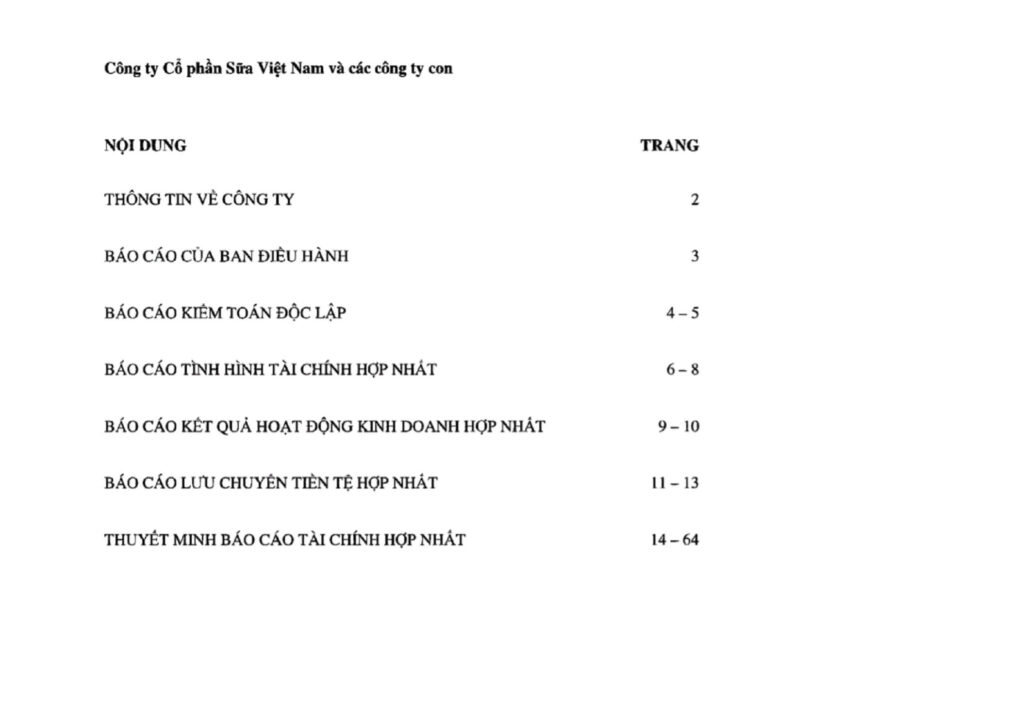
A complete set of financial statements in Vietnam includes the components shown in the example below:
In this article, we will focus on the most important components of a set of financial statements, starting with:
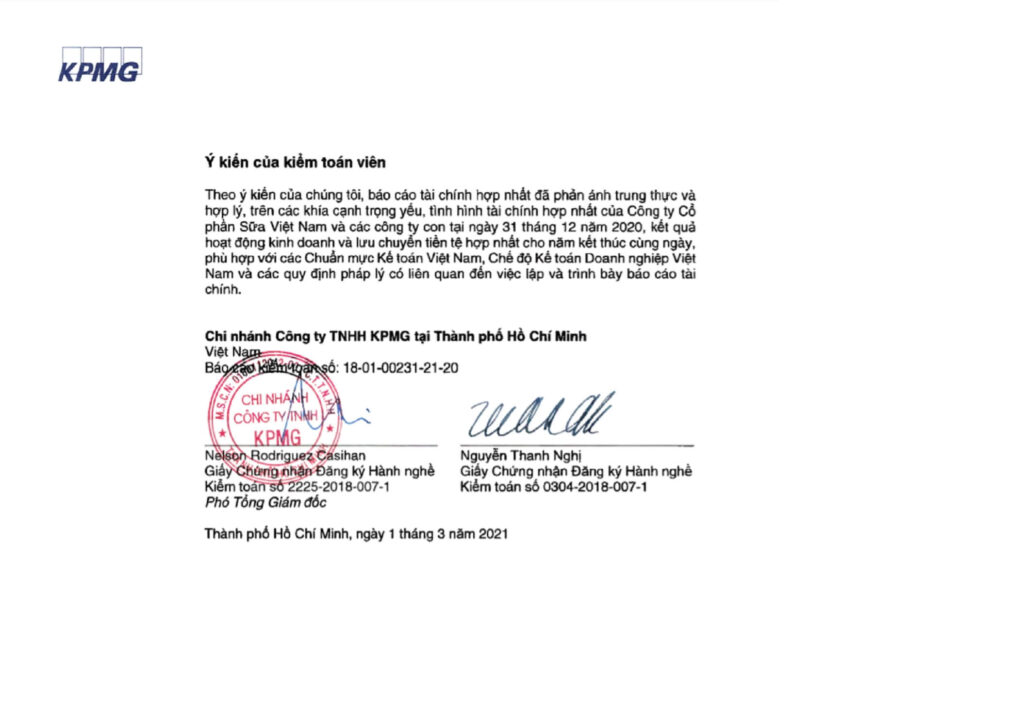
The independent auditor’s report
The first point to stress is that we should only assess and analyse financial statements that meet a minimum condition: acceptance by the auditor. An auditor’s opinion usually falls into one of 4 levels:
- Unqualified (clean) opinion
- Qualified opinion (except for)
- Adverse opinion
- Disclaimer of opinion
In my personal view, stock selection deserves the highest level of rigour, so I only consider financial statements that meet the following 2 initial criteria:
- Audited by a Big Four audit firm: Deloitte, PwC, E&Y or KPMG.
- An unqualified audit opinion.
The example below shows VNM’s financial statements, which received an unqualified opinion from KPMG.
The balance sheet
The balance sheet (also called the statement of financial position) is one of the 3 statements in a company’s financial statements. It gives an overall picture of all the assets the company currently holds and the sources of capital used to fund those assets at a specific point in time (the end of a quarter or month).
The balance sheet is a point-in-time statement, like a snapshot of the company’s overall financial position on a given date.
The balance sheet has 2 main sections: Assets and Liabilities and Equity. The assets listed on the balance sheet are owned by the company and will generate economic benefits in the future. They include cash, machinery, factories and inventory, and even some other items such as receivables, patents and software.
A company’s sources of capital consist of liabilities and shareholders’ equity. Liabilities are the company’s obligations to other parties. Equity is the difference between the company’s total assets and its liabilities, and it is the portion of the assets owned by shareholders.
The balance sheet therefore always follows the basic accounting equation:
Total assets = Total liabilities and equity
Current assets + Non-current assets = Liabilities + Shareholders’ equity.
Assets
On the balance sheet, assets are classified by liquidity (how quickly they can be converted into cash). The two main groups are current assets and non-current assets, and each group is broken down further into smaller categories.
Current assets
The first thing to agree on before going further: under accounting standards, “current” (short-term) refers to asset items with a useful life or term of less than 1 year (12 months), and “non-current” (long-term) refers to items with a term of more than 1 year.
From top to bottom, assets are listed in decreasing order of liquidity, which is also the order in which they appear on the balance sheet.

- Cash and cash equivalents: “Cash” is exactly what it sounds like: all of the company’s money held in its safe or in its bank current accounts. Cash equivalents are assets that are not cash but can be used for payment like cash, such as cheques and demand deposits.
- Short-term financial investments: financial assets with a term of less than 12 months, such as Treasury bills, State Bank bills and short-term deposits.
- Short-term receivables: short-term amounts owed to the company by customers or related parties. For example, a receivable from a customer arises when the company sells a product but the customer has not yet paid (a sale on credit). Likewise, money the company has prepaid to a supplier that has not yet delivered raw materials is also recorded as a receivable.
- Inventory: the company’s products that have not yet been sold to customers and are held in warehouses. Unused raw materials are also counted as inventory.
Non-current assets

- Long-term receivables: the same as the short-term receivables described above, but with a longer term.
- Fixed assets: assets with a useful life of more than 1 year used for production and running the company, such as machinery, equipment, factories and offices (tangible assets) or software, patents and trademark rights (intangible assets). These assets are usually carried at their depreciated value, i.e. historical cost minus accumulated depreciation. Depreciation reflects the physical wear and tear of fixed assets.
- Long-term assets in progress (construction in progress): land, buildings and factories under construction that are not yet in operation. Keep an eye on this item, as we will come back to it in later articles.
Liabilities and equity

Liabilities
Liabilities are the company’s obligations to related parties such as banks, partners, suppliers and customers. As with assets, liabilities are classified by their term, and include:
Current liabilities
- Payables: amounts owed to suppliers, employees (wages) and the state (taxes). Trade payables arise when a supplier has delivered input materials but the company has not yet paid. Wages payable and taxes payable are recorded when the company has not paid these costs by their due date.
- Advances from customers: deposits or prepayments made by customers before the company delivers the product to them.
- Short-term borrowings: amounts the company is obliged to repay to banks. Note that this item records only the principal; interest is booked as interest expense in the income statement.
Non-current liabilities
- Non-current liabilities include the same items as current liabilities, but with a term of more than 1 year.
Shareholders’ equity
Shareholders’ equity is the difference between assets and liabilities. It is the portion owned by shareholders and includes:
- Owners’ contributed capital: the company’s charter capital as set out in its charter. This is the capital the founding shareholders contributed to establish the company.
- Share premium: the difference between the par value of the shares issued (usually VND 10,000 per share) and the actual issue price. For example, if a company issues an additional 10,000 shares of Stock A with a par value of VND 10,000, but shareholders actually buy them at VND 15,000 per share, the difference of VND 5,000 per share is recorded as share premium.
- Undistributed profit after tax (retained earnings): the company’s net profit belongs entirely to shareholders. Part of it may be paid out of the company as dividends, and the profit retained is recorded under this item. Retained earnings are kept to reinvest in the company’s future projects. Some undistributed profit is allocated to funds, such as the Development Investment Fund.
- Treasury shares: these arise when the company spends money buying back its own shares, in order to “return money” to shareholders, which reduces shareholders’ equity.
The income statement
The income statement (also called the profit and loss statement, or P&L) summarises a company’s business operations and results over an accounting period (a quarter or a year).

The two main elements of the income statement are revenue and expenses, which follow a basic equation:
Net profit = Total revenue – Total expenses
Let’s look at an example of an income statement:
As you can see, the income statement is laid out as a subtraction from top to bottom: revenue minus the various expenses gives the bottom line, profit after tax.
Let’s look at the items in this statement in more detail.
- Revenue from core operations: the money received from customers for selling products or providing services. Net revenue is revenue minus deductions (such as customer returns).
- Cost of goods sold: the costs incurred in producing the products, including raw materials, labour, factory running costs, transport costs, depreciation of fixed assets, etc.
- Gross profit = Net revenue – Cost of goods sold.
- Financial income: income from financial activities (not core operations), such as interest on bank deposits and dividends received.
- Financial expenses: interest expense and certain other related costs.
- Selling expenses: costs of selling products once they leave the factory, such as the running costs of sales outlets, sales staff salaries, marketing costs, etc.
- General and administrative expenses: mostly the salaries of management, such as directors and department heads, plus back-office costs, etc.
- Profit before tax: revenue after deducting total expenses, before corporate income tax.
- Corporate income tax: the tax the company must pay to the state, at rates set by the General Department of Taxation (currently 20%).
- Profit after tax = Profit before tax – Corporate income tax. This is the profit that increases shareholders’ equity and directly affects shareholders’ interests.
A company with many subsidiaries publishes 2 separate sets of financial statements:
- Consolidated financial statements: reflect the financial position of the parent company and all of its subsidiaries.
- Parent company (separate) financial statements: reflect the financial position of the parent company alone.
For the income statement, the consolidated financial statements show the total revenue and total expenses of the parent company and all of its subsidiaries. This is why consolidated financial statements contain an item called “non-controlling interests” (minority interests). This is the share of profit allocated to the subsidiaries’ minority shareholders other than the (majority) parent company.
The cash flow statement
The cash flow statement shows the actual movement of cash into and out of the company during the reporting period (a quarter or a year).
The cash flow statement is built on the equation:
Closing cash – Opening cash = Net cash flow for the period
Unlike the income statement, the cash flow statement assesses the actual cash moving through the business. For example, when you sell a product to a customer on credit, the revenue from the sale is recognised and may produce a profit, but the company’s cash balance does not change. High profit with low cash flow can indicate low earnings quality, and says something about the company’s bargaining position. The cash flow statement is therefore important because it shows whether the company’s cash flow can provide enough liquidity for the business to run smoothly. It also helps the company assess the feasibility of investing in new projects, and helps creditors assess its ability to repay debt.
Cash flowing into the business (cash receipts) increases the company’s cash, while cash flowing out of the business (cash payments) reduces it.
A company’s cash flows are divided into 3 main types: cash flow from operating activities, from investing activities and from financing activities.
Cash flow from operating activities (CFO)
For this section, a company can choose between 2 methods of reporting: direct and indirect.
Under the direct method, the statement presents the company’s cash flows with each party involved in its operations, such as customers and suppliers, to give the most faithful picture of cash flow. To record actual cash inflows and outflows, each receipt and payment must be backed by a specific invoice or receipt. The items in this section include:
- Cash received from customers: money customers pay to buy goods or use services, as well as customer prepayments.
- Cash paid to suppliers: payments the company makes to suppliers for raw materials, or other prepaid expenses.
- Cash paid to employees: employees’ wages.
- Interest paid.
- Corporate income tax paid.
The indirect method is used by more companies because it makes preparing the cash flow statement easier, given that not every payment comes with an invoice or receipt for the accounting department to record. Under the indirect method, items on the income statement are adjusted according to the cash the company actually paid or received. The cash flow statement is therefore prepared using the formula below:
Cash flow from operating activities = Profit after tax + Depreciation – Gains from investing activities – Change in current assets (excluding cash; the statement shows changes in receivables and inventory) + Change in current liabilities (excluding borrowings; the statement shows changes in payables, accrued expenses, etc.).

Cash flow from operating activities needs to be large enough to fund investment in assets and the expansion of the company. If the company is short of cash, in the short term the cash will come from financing activities: raising equity or borrowing.
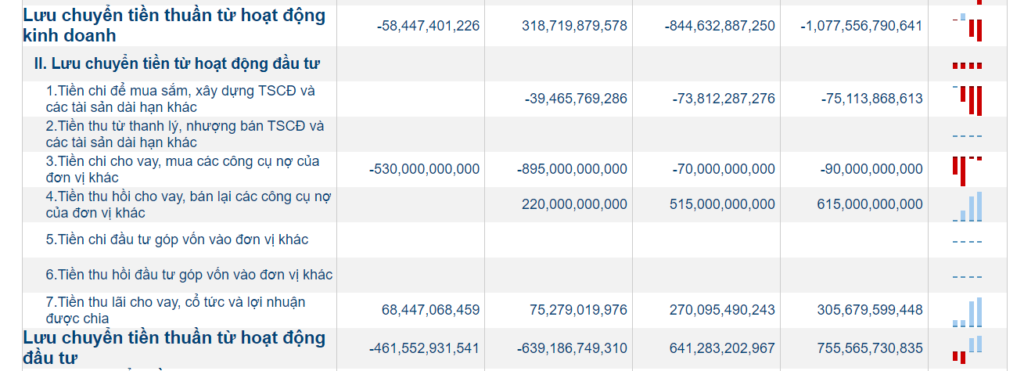
Cash flow from investing activities (CFI)
Cash flow from investing activities relates to the company’s investment in itself (equipment, machinery, factories, etc.) or its external financial investments. Cash related to investment in the company’s own equipment is reported under two items: Purchases of fixed assets and Proceeds from disposal of fixed assets. For financial investments, money the company uses to buy bonds or make loans is recorded under Loans made, and principal recovered is recorded under Collection of loans. Similarly, cash related to equity investments is recorded under Investments in other entities and Proceeds from divestment in other entities. Income received while holding these assets, such as interest and dividends, is recorded together under Interest and dividends received.
Cash flow from financing activities (CFF)
Cash flow from financing activities relates to the company’s creditors and shareholders, and changes the company’s capital structure. For creditors, two items are recorded under financing cash flow: Proceeds from borrowings and Repayments of borrowings.
Note that interest paid is reported under cash flow from operating activities. For shareholders, financing cash flow arises when the company issues new shares to raise capital, recorded under Proceeds from share issuance. Dividends paid and Purchases of treasury shares are two further items relating to obligations to shareholders recorded in this section.

That brings us to the end of a fairly long guide to reading and understanding financial statements. In the following parts, we will go deeper into analysing financial ratios, to draw useful insights into a company’s financial position and business operations.
Happy trading!
The “Stock Trading For A Living” course
Green Chart designed this course to give students a solid foundation in fundamental analysis & stock valuation (Fundamental Analysis), and to show them how to integrate it effectively into their existing trading system, especially for traders who already use technical analysis (Technical Analysis). The program consists of 5 theory sessions and 6 months of hands-on guided trading in the live market with the lecturer.
See full details of the course here.