Contents of this article

What is variance?
In the previous chapter we covered expected return; continuing on, we now look at the concept of “portfolio variance”. Portfolio variance helps us understand risk at the portfolio level. Hopefully you are already familiar with “standard deviation” as a measure of risk.
Although we can easily measure the risk of a single stock by calculating its standard deviation, calculating the risk of a portfolio is a completely different problem. In this chapter, I will help you understand how to estimate risk at the portfolio level.
Before we start, however, we need to understand variance and covariance. Both are statistical measures.
The variance of a stock’s returns measures how widely its returns vary around its average daily return. The variance formula is quite simple:
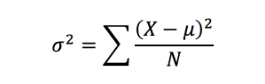
Where:
σ2 is the variance
X is the daily return
µ is the average daily return
N is the total number of observations
Variance is expressed as sigma squared; I won’t go into why, as it is relatively complex and would take us off topic. In any case, calculating variance is quite simple, and the following example will help you understand the concept and the formula.
Suppose a stock’s daily returns over five consecutive days are as follows:
Day 1 – +0.75%
Day 2 – +1.25%
Day 3 – -0.55%
Day 4 – -0.75%
Day 5 – +0.8%.
We can easily calculate that the stock’s five-day average return is +0.3%. Now we need to calculate the difference between each daily return and this average, and then square it.

Next, we add up the squared differences to get 0.0318000%, then divide this by the 5 observations (N) to get the variance:
0.0318000% / 5
σ2 = 0.0063600%.
So what does this number tell us? It tells us how much daily returns deviate from the average expected return. As an investor, you should therefore look at variance to judge how risky an investment is. A high variance suggests the stock may be quite risky, and vice versa. In the example above, I would consider the variance high, since we are only looking at five days of data.
At this point, we come to a rather interesting formula, because variance and standard deviation are linked. Specifically:
Square root of variance = standard deviation
Applied to the example above, the standard deviation of the stock’s returns over five days (%) is ~0.8%,
also known as the stock’s volatility (over the past five days). But I want you to understand variance and what it really means. Later, we will put variance and covariance into the equation for portfolio variance.
What is covariance?
Covariance tells us whether two (or more) variables move in the same direction. Two variables that move together have a positive covariance, and the opposite when they move in opposite directions. In the stock market, a positive covariance between two (or more) stocks means their prices move in the same direction, and vice versa.
I know many people confuse covariance with “correlation”, but they are completely different concepts, and we will discuss this further below.
To see how covariance between two stocks is calculated, consider the following formula:

Where:
Rt S1 is the daily return of stock 1
Avg Rt S1 is the average return of stock 1 over n days
Rt S2 is the daily return of stock 2
Avg Rt S2 is the average return of stock 2 over n days
n is the total number of days
In other words, the covariance between two stocks is calculated from the sum of the products of each stock’s deviations of daily return from its average return.
Sounds confusing, right?
Let’s work through an example using the formula above to see how the covariance between two stocks is calculated. To make it easy to picture, I have chosen two stocks, VPB and HPG, and applied the formula in Excel to calculate their covariance.
Before we continue, what do you think the covariance between VPB and HPG will be, given that both are large companies in Vietnam but operate in completely different sectors?
Here are the steps to calculate covariance in Excel (although Excel has a dedicated covariance function, I will take it slowly to make sure you have a clear picture of the method):
Step 1
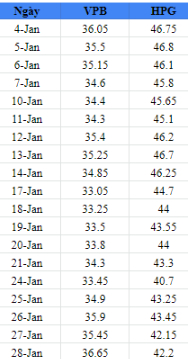
Collect daily price data. For illustration, I have collected the adjusted closing prices of VPB and HPG over one month.
Step 2
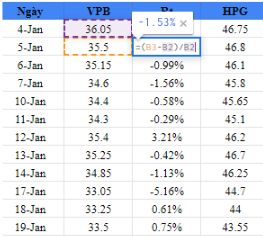
Calculate the daily return of both stocks as the % change between today’s close and yesterday’s close
Step 3
Calculate the average daily return of the two stocks
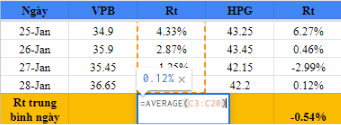
Step 4
Once you have the averages, subtract the average from each daily return
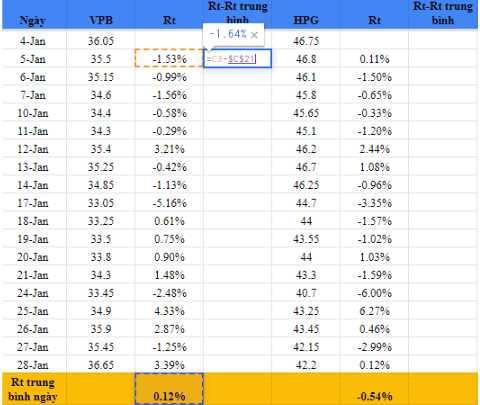
Step 5
Multiply the two series calculated above together, row by row:
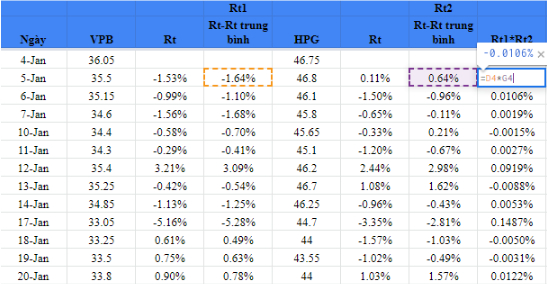
Step 6
Add up the results from the previous step. Also count the number of observations in the sample using the COUNT function.
Step 7
Divide the sum by the number of observations minus 1, i.e. (n-1). There are 19 observations in this case, so we divide by 18. The sum calculated in the previous step is 0.715%. The covariance is therefore
= 0.00741 / 18
= 0.000412
You can use the data from the example above here
As you can see, the covariance is quite small. But that is not the point here. Clearly, because the two stocks have a positive covariance, their returns move in the same direction.
Note – covariance does not tell us how strongly the two stocks move together, only the direction in which they move. The strength of the relationship is measured by the correlation coefficient, calculated with the following formula:
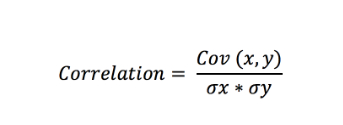
Where
Cov (x, y) is the covariance between stocks x and y
σx is the standard deviation of stock x
σy is the standard deviation of stock y
When building a stock portfolio, do you think a positive covariance is good or bad? Or rather, do portfolio managers want the stocks in their portfolio to have positive covariance?
The answer is that they try to choose stocks with negative covariance. The reason is simple: they want the portfolio to hold its value. That means if one stock falls, at least the other one does not. This helps balance the portfolio and reduce overall risk.
Now consider a typical portfolio with more than two stocks. In practice, a good portfolio holds at least 12–15 stocks. How do we measure covariance in that case?
This is where things get complicated, because we have to measure the covariance of each stock with every other stock in the portfolio. Let me illustrate with the following four-stock portfolio:
- BID
- HPG
- PNJ
- VIC
In this case, we need to calculate the covariance between the following pairs of stocks:
- BID, HPG
- BID, PNJ
- BID, VIC
- HPG, PNJ
- HPG, VIC
- PNJ, VIC
Note that the covariance between stock 1 and stock 2 is the same as the covariance between stock 2 and stock 1. So, as you can see, with four stocks we only need to calculate six covariances. But the calculation becomes much more complex when the portfolio has 15 or 20 stocks.
In practice, when a portfolio has more than two stocks, the covariances between them are calculated and tabulated using a “variance–covariance matrix”. Much as I would like to present it now, I think it is better to discuss this topic in the next chapter.
Happy Trading !
The “Stock Trading For A Living” Course
Green Chart designed this course to give students a solid foundation in fundamental analysis and stock valuation, and to show them how to integrate it effectively into their existing trading system, especially for traders who already use technical analysis. The programme includes five theory sessions and six months of hands-on trading practice in the real market with the lecturer.
See full course details here.