
Contents of this article
Profit is always the first thing we think about when investing in a stock or a company. Sometimes, however, profit is not the best yardstick for judging whether a stock is good or bad, or for reflecting how well a business performs. In this article, we will look at a metric that reflects profitability more accurately: profit margin

Three common profit margin measures
Essentially, profit margin measures how much profit a company generates from each dong of revenue after deducting the necessary costs. There are three common types of profit margin: gross margin, operating margin and net margin. The difference between them lies in which costs are deducted from revenue to arrive at the profit figure.
- Gross margin = (Net revenue – Cost of goods sold) / Net revenue
- Operating margin = (Net revenue – Cost of goods sold – Selling and administrative expenses) / Net revenue.
- Net margin = Profit after tax / Net revenue
These items can easily be found and calculated from the company’s income statement.

Each type of margin has a different meaning. Gross margin reflects the company’s profitability after removing the direct product costs included in cost of goods sold. A high gross margin signals a competitive advantage from a low cost of goods relative to the selling price, which usually comes from factors such as:
- Superior technology, production processes or value chain that lower production costs.
- Advantages in other inputs, such as readily available raw materials or cheap labour.
- Economies of scale.
- A strong brand that lets the company charge higher prices than its competitors.
Operating margin gives a broader view than gross margin, taking into account other costs involved in running the business, such as selling expenses and administrative expenses. Selling expenses are one of the largest costs for companies, especially since maintaining strong brand recognition requires a substantial advertising and marketing budget. Administrative expenses are also an important gauge of management’s ability, if they can be kept low relative to revenue.
Net margin shows the company’s profitability after adding profit from financial activities and other activities and deducting corporate income tax. It is the final measure of the company’s actual ability to generate profit, but it is also the part most easily manipulated, as it contains many financial and other income and expense items that are hard to classify and assess. We will discuss this later in the article.
What is a good profit margin?
Naturally, a higher margin reflects a greater ability to generate profit, which is positive for investors. To assess it accurately, though, each measure needs to be put in its specific context. We will look at 2 aspects of profit margin: the margin trend and the comparison with the industry average.
The margin trend
Companies usually maintain fairly stable margins over a given period, especially large companies whose businesses see few sudden shocks. Some highly seasonal or cyclical businesses, such as real estate and construction, tend to have uneven margins that swing widely with each project cycle.

Periods when a company’s margins suddenly rise or fall deserve attention, as they can generate trading ideas. You can see the spike in DBC‘s gross margin in 2020, when hog prices soared following the supply shock from African swine fever in 2019.

Or the margin expansion at PNJ as it shifted its product mix from gold bars to higher-margin gold jewellery.

How does the margin compare with the industry average?
A company whose margins are well above those of its peers, or the industry average, usually has some competitive advantage over the rest.
Take the steel industry as an example: it is easy to see HPG’s superior margins compared with other steel companies, an advantage that comes from its scale, leading production technology and outstanding brand value.

Tricks that distort profit margins
A company’s profit margin is also something that is often manipulated to dress up the financial statements and distort shareholders’ view of the business. Here are some red flags you can spot in financial statements.
Large swings in provisioning expenses
This is one of the most common ways companies smooth their earnings: raising or lowering provisioning expenses, which are very hard to estimate accurately and reasonably. Changing provisions can alter profit from financial activities, but in substance it does not affect the company’s actual cash flow. You can see an example of large swings in this item over the years at PPC:

Changing accounting policies
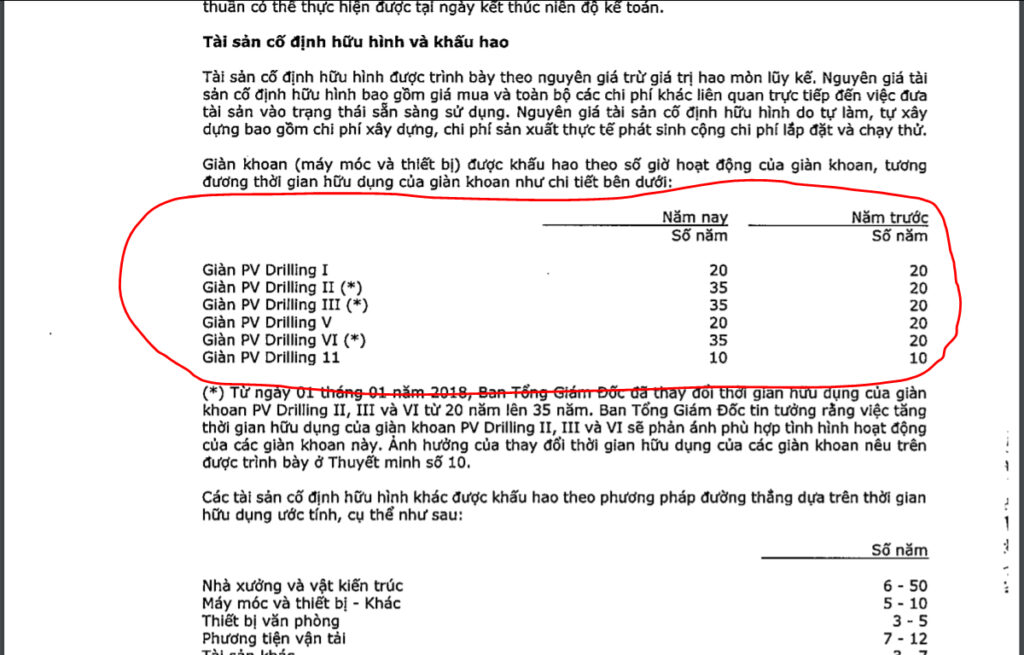
Another trick to influence margins is to change how revenue and expenses are recognised by changing accounting policies. In the example below, extending the depreciation period of drilling rigs from 20 to 35 years significantly reduced depreciation expense and improved PVD’s margins, without changing its actual business results.
Unusual financial income and other income
Consider the example of Nam Long Investment Corporation (NLG), which booked unusual other income of more than VND 427 billion in Q1/2021, lifting profit 231% year on year.
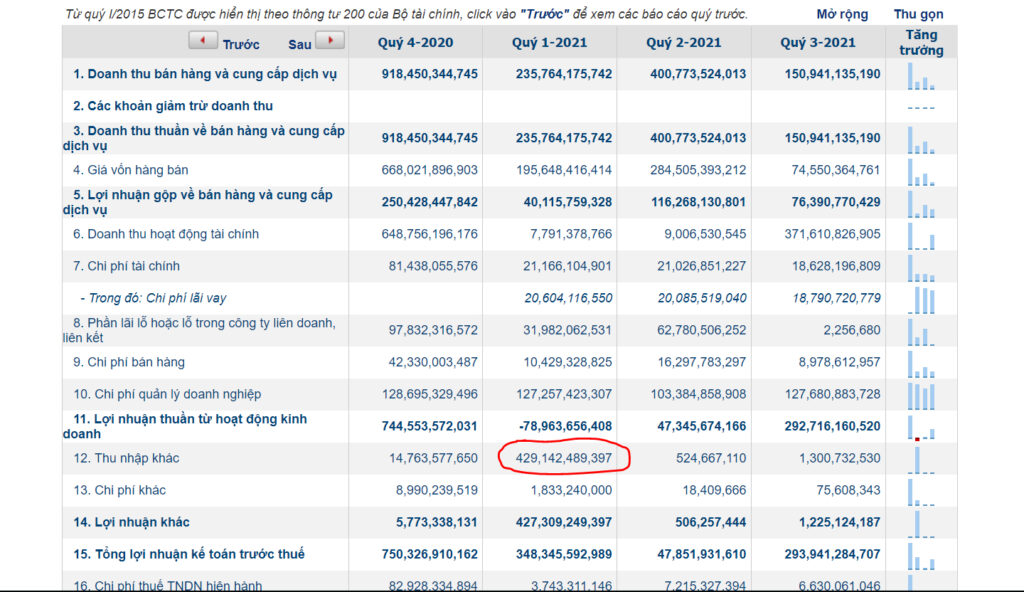
Example: Nam Long Investment Corporation (NLG) booked unusual other income of more than VND 427 billion in Q1/2021, lifting profit 231% year on year.
Looking more closely, you can see that this unusual income came from revaluing its investment in Waterfront Dong Nai, when NLG raised its stake from 35% to more than 65% at the end of Q1/2021.
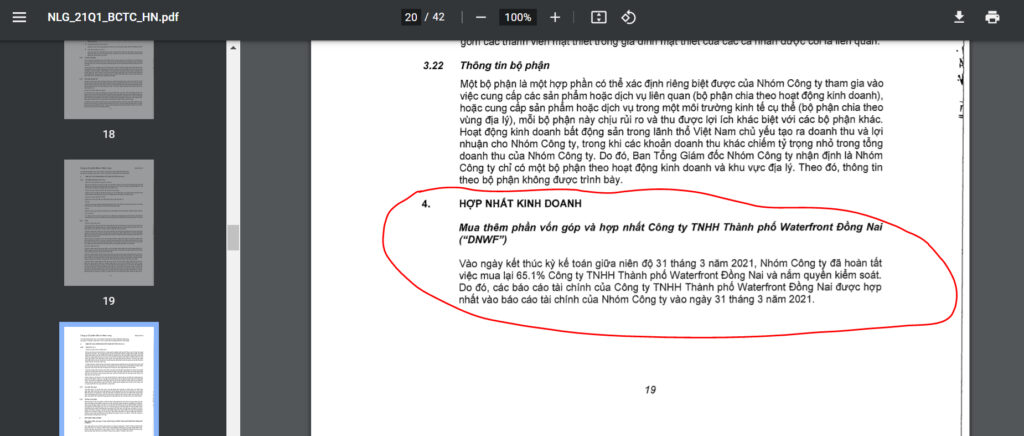
The unusual income came from revaluing the investment in Waterfront Dong Nai, when NLG raised its stake from 35% to more than 65% at the end of Q1/2021.
Under current accounting rules, when an associate becomes a subsidiary, the parent must revalue its original investment in the associate, and the difference of more than VND 427 billion came from that revaluation. In substance, this profit generated no actual operating cash flow for NLG, yet it lifted its margins significantly.

Under current accounting rules, when an associate becomes a subsidiary, the parent must revalue its original investment in the associate, and the difference of more than VND 427 billion came from that revaluation.
Happy trading!
The “Stock Trading For A Living” course
Green Chart designed this course to give students a solid foundation in fundamental analysis & stock valuation (Fundamental Analysis), and to show them how to integrate it effectively into their existing trading system, especially for traders who already use technical analysis (Technical Analysis). The program consists of 5 theory sessions and 6 months of hands-on guided trading in the live market with the lecturer.
See full details of the course here.