Multiple timeframe trading is one of the techniques most widely used by professional traders. How it is applied depends largely on each trader’s habits and experience.

The main timeframes for trading
Trends can be classified as primary, intermediate and short-term trends. However, the market exists in many timeframes at once. As a result, a given stock can show conflicting trends depending on the timeframe being examined. It is not unusual for a stock to be in a long-term uptrend while sitting in an intermediate- and short-term downtrend.
New investors often focus too heavily on one particular timeframe and overlook strong primary trends. On the other hand, experienced investors may be trading with the primary trend but underestimate the opportunity to scale their positions in and out within an ideal short-term timeframe.
Choosing the right timeframes for multiple timeframe trading
A basic rule of thumb is this: the longer the timeframe, the more reliable its signals. When you use very short timeframes, the chart shows more noise and false signals become more frequent. Ideally, investors should use a longer timeframe to identify the primary trend of whatever they are trading.
Once the primary trend is established, investors can use their preferred timeframe to define the intermediate trend and a faster timeframe to define the short-term trend. Some examples of using multiple timeframes:
- Day traders: open and close positions within the same day, and usually focus on timeframes shorter than D1, such as H4, H1 or even M15.
- Swing traders: hold positions for a few days to a few weeks, and mainly focus on the daily timeframe.
- Position traders: hold positions for a few weeks to a few months, focus on long-lasting trends, and usually watch the weekly and monthly timeframes.

Investors can use their preferred timeframe to define the intermediate trend and a faster timeframe to define the short-term trend.
Which group of timeframes to use differs from one trading style to another. Multiple timeframe traders pick the main timeframe they care about, then add the timeframes one step above and one step below it. They use the long-term chart to identify the trend, the intermediate chart to generate trading signals and the short-term chart to fine-tune entries and exits. One word of caution, however: do not get caught up in the swings of the short-term chart or over-analyse a single trade. The short-term chart is usually used to confirm or reject a signal that has appeared on the intermediate and long-term charts.
Applying multiple timeframe trading in the Vietnamese stock market
Let’s look at examples for two products traded in the Vietnamese stock market: cash equities and VN30 index futures contracts. The characteristics of these two products partly shape how different timeframes are used to trade them.
An example of multiple timeframe trading with stocks
Stocks in the Vietnamese market have specific features: T+3 settlement and no short selling. In addition, intraday price moves are capped by a daily price limit of 7%, 10% or 15% depending on the exchange, and prices are also affected by factors such as the ATO and ATC call auction sessions (read more about stock trading rules here). Timeframe selection for Vietnamese stocks therefore has its own characteristics.
Investors typically use the daily chart to analyse the short-term trend, the weekly chart for the intermediate term and the monthly chart for the long term. Using shorter-period charts is a matter of personal preference, but in practice it is not very effective.
Now let’s look at a BUY strategy for FCN:
Long term (monthly chart): On the monthly chart, FCN shows a strong uptrend, with price hugging the upper Bollinger Band. The MA20 crossing above the MA50 also points to a strong uptrend. There is, however, a red candle with a fairly long shadow. For a stock in a healthy uptrend with plenty of supportive news, like FCN, that red candle is an opportunity to buy on the pullback after missing earlier entry points.

Intermediate term (weekly chart): Two corrective candles bring FCN’s price back to the MA20, a fairly solid support level. Price then holds above the MA20 and moves along just above it, suggesting FCN could resume its advance. This is when we look for an entry on the short-term chart.
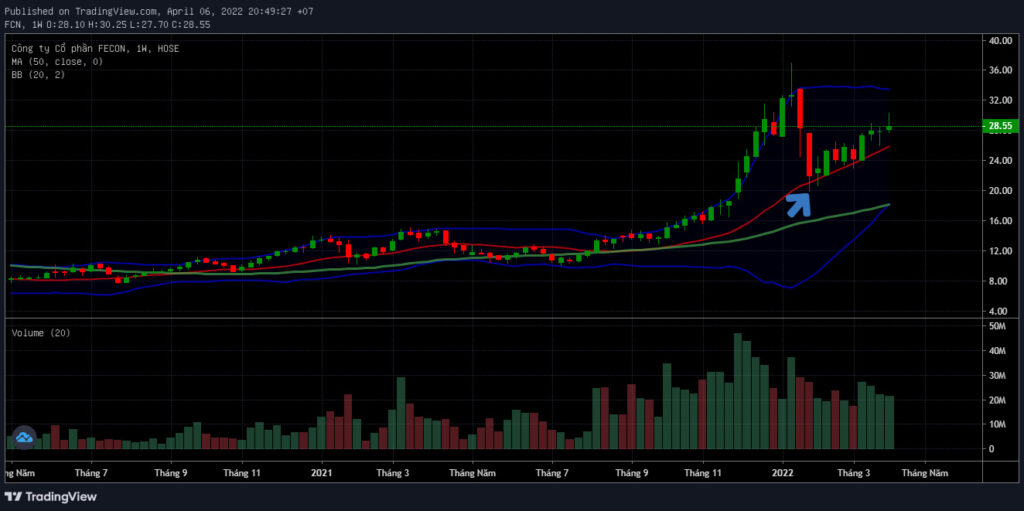
Short term (daily chart): On the daily chart, two Bullish Engulfing candles signal a bullish reversal after FCN’s two-week correction. To be safer, we can deploy capital after the second Bullish Engulfing candle appears (the arrow on the chart), committing only part of the position at first.

An example of multiple timeframe trading with VN30 futures
Unlike stocks, futures trade continuously and positions have no settlement delay, so the timeframes used to follow VN30 futures contracts also differ from those used for stocks.
Because of high leverage and large contract values, many traders even trade in and out repeatedly to capture profits. The timeframes used for this product therefore differ from those used for stocks:
For the short-term chart, traders may use 1-minute, 5-minute and 15-minute charts up to the 1-hour chart, and trade on those timeframes to avoid the risks and costs of holding positions overnight.
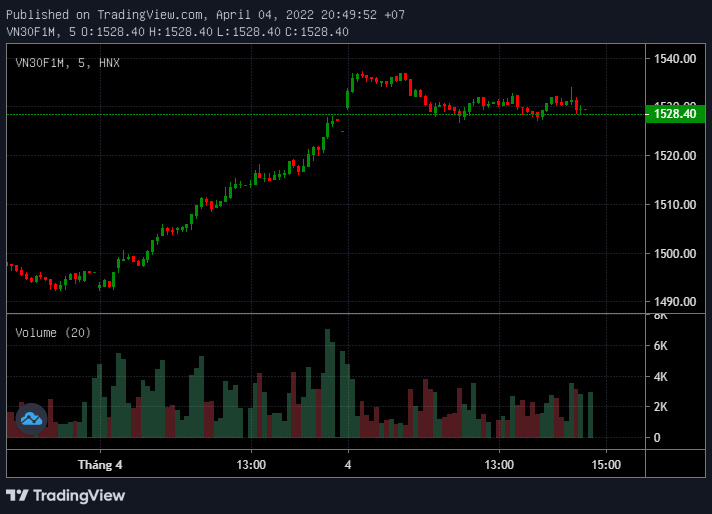
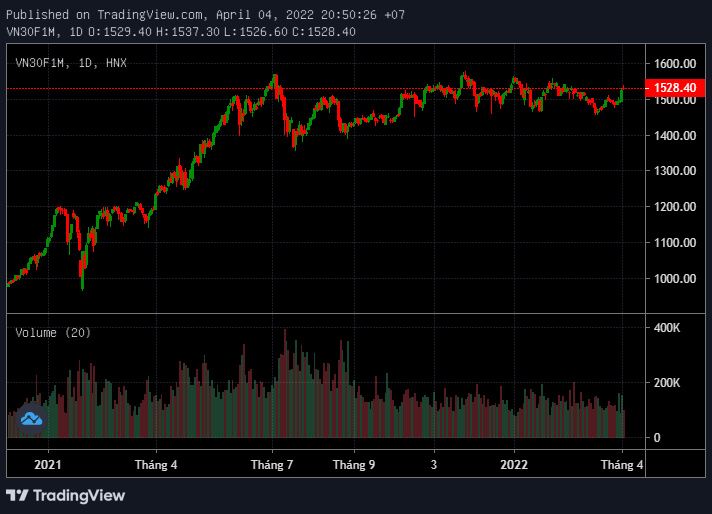
For the intermediate trend, the daily chart is probably the ideal timeframe for VN30 futures.
The long-term chart is the weekly chart (in practice, VN30 derivatives traders rarely look at VN30F on weekly or monthly charts).
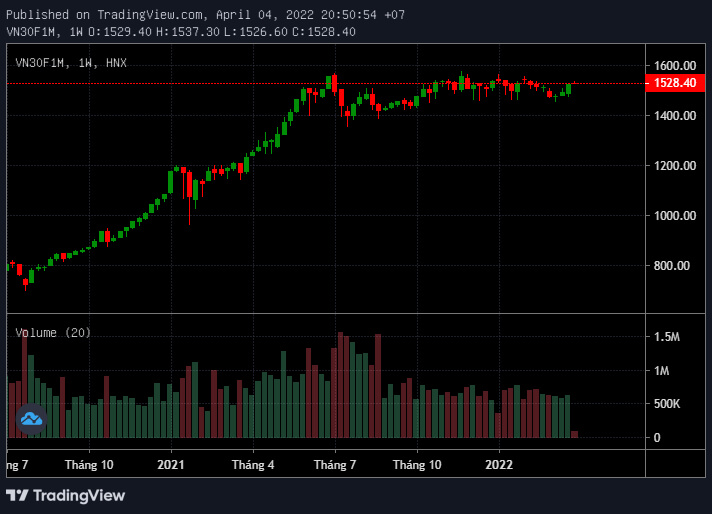
Following the same sequence as with stocks, traders analyse the primary trend from the long-term chart down to the intermediate chart and look for entries on the short-term chart. This principle helps investors buy assets while they are rising, limit losses when trading, and hold good positions with confidence even when the short-term entry was not perfectly timed. Next, let’s look at a SHORT example on the VN30F1M futures contract:
Long term (weekly chart): On the weekly chart, after a run of green candles in a steady uptrend hugging the upper Bollinger Band, VN30F1M printed a Bearish Engulfing candle, signalling a bearish reversal. At that point the market had been through a strong rally and was due for a correction, giving traders an opportunity to short the VN30F1M contract.

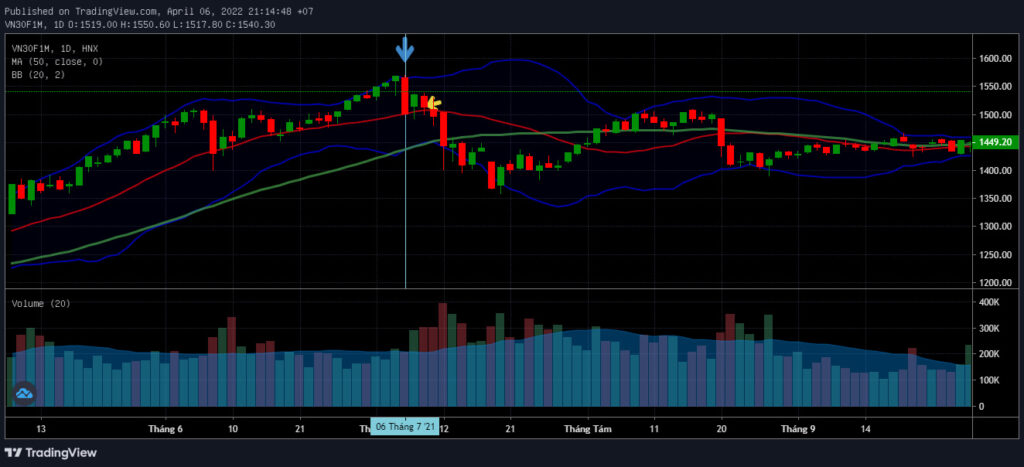
Intermediate term (daily chart): The red candle with a very long real body on 6 July 2021 signalled a downtrend. However, it closed above the MA20 resistance, so traders would usually not open a short in that session to avoid risk. Only on the 9 July 2021 candle (yellow arrow), when price had decisively broken below the MA20, would traders start shorting the contract.
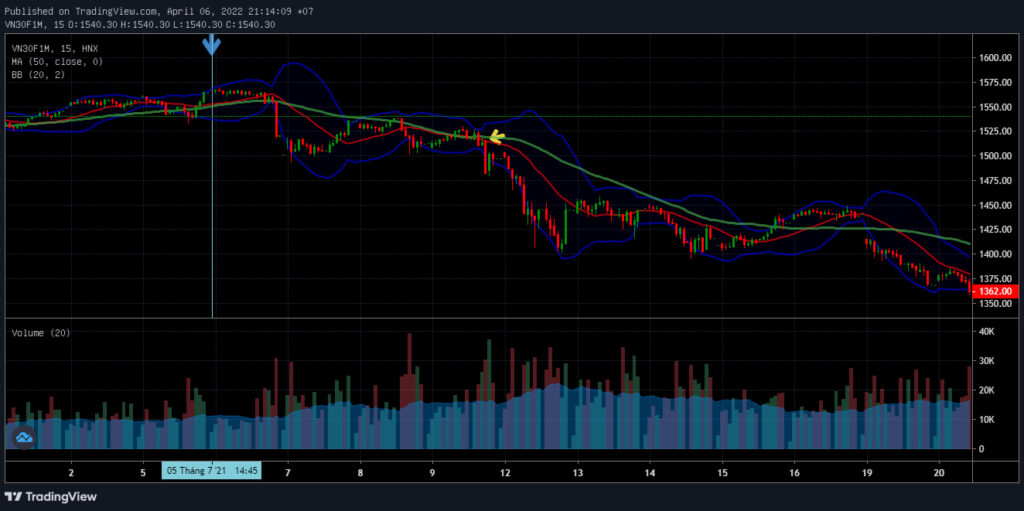
Short term (15-minute chart): On the 15-minute chart, traders choose their entry when the downtrend becomes clear: a bearish candle breaks through the lower Bollinger Band and both the MA20 and MA50 point downward (the yellow arrow area). Traders could also go SHORT on the green candle that followed in the 9 July session.
Technical Analysis Course – CMT Level 1
Green Chart designed this course specifically for candidates in Vietnam who want to study and prepare for the CMT Level I exam. The programme includes 27 sessions of theory, practice questions and mock exams. Students also receive the course materials, question bank and mock exams free of charge, and can retake the course for free for life.
See full course details here.
Happy trading !