
Contents of this article
What exactly is a trend – the thing traders want to capture in order to make a profit? An uptrend occurs when price makes higher highs and higher lows. Conversely, a downtrend occurs when price makes lower lows and lower highs. A sideways trend (sideways or flat trend) appears when price fluctuates within a certain range without any significant move up or down.
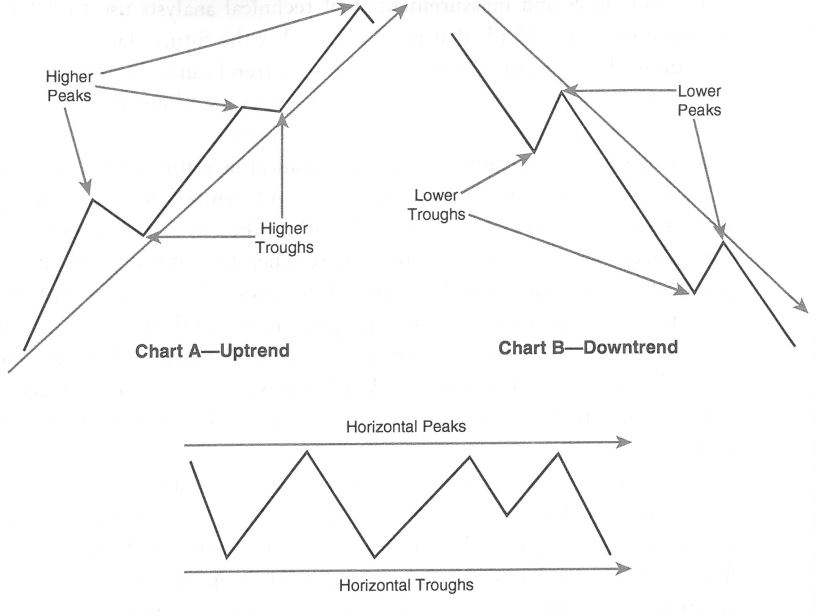
The image above shows a theoretical example of an uptrend, a downtrend and a sideways trend. Identifying the trend of real assets in real markets, however, is not that simple. Price does not move in a smooth, continuous line. Small countertrend moves within a larger trend can therefore make the trend hard to recognise. Note too that trends come in different lengths, and shorter-term trends are usually components of a longer-term trend.
From a technical analyst’s point of view, a trend is a directional movement in price that lasts long enough to be identified and exploited profitably. If a trend can only be identified after it has ended, no one can profit from it. If it is not recognised in time, it cannot be exploited either. Looking back at historical price data, you can see many trends of different lengths and magnitudes, but that is only a historical observation. For a technical analyst to profit, a trend must be identified early and last long enough to act on.
How do you identify a trend?
There are many ways to identify a trend. One method is linear least-squares regression. However, this method is not very useful for most individual traders, because it needs a large amount of historical data to produce accurate results. The problem is that by the time there is enough past data to analyse, the trend may already have started to change.
Some analysts use moving averages to smooth out and reduce the impact of small fluctuations within the larger trend.
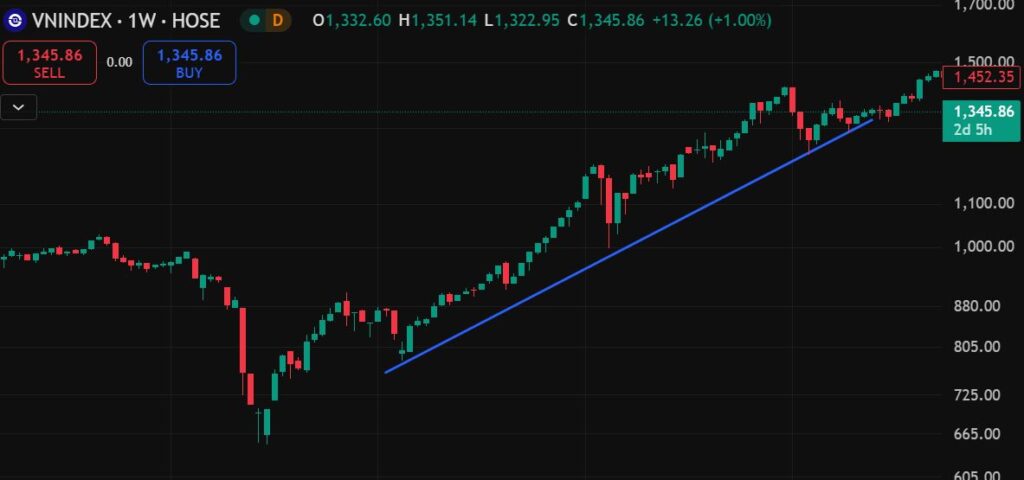
Another popular method is to study the price chart to identify extreme points – the peaks and troughs – separated by reasonable intervals of time, and then draw lines connecting them. These lines are called trend lines (trend lines). It is a traditional method dating from the days before charting software, when lines were drawn by hand on charts. Although more modern tools exist today, this method still proves effective at identifying trends. To use it, however, the analyst must correctly identify the turning points. By connecting peaks and troughs, we get a sense of the direction of price and the boundaries of the trend. We can also gauge its “slope”, or the rate of price change. Trend lines can set boundaries for price behaviour, and when they are broken, that can be a signal that the trend may be changing.
Trends are created by supply and demand
Every market – stocks, bonds, gold, real estate and commodities – follows the basic economic principle of the interaction between supply and demand. Each buyer (demand) places a bid for a certain quantity at a certain price, and each seller (supply) makes an ask (offer) for a certain quantity at a certain price.
When a buyer and a seller agree and trade, they set a price at that moment. The reasons for buying or selling can vary widely — the seller may need cash or may just have received bad news, or the buyer may have heard a positive rumour about company A’s earnings. Whatever the reason, the price is set once all this information has been gathered, analysed and reflected in the act of buying and selling.
The price trend is the end result of all these imperfect factors, and the result of supply and demand at a particular moment. When price changes, the change comes from a shift in supply, demand or both. Perhaps sellers are becoming more anxious, or buyers have more money to invest — whatever the reason, price reflects that change in supply or demand. Technical analysts essentially observe price and are not particularly concerned with the reasons behind price changes, because those reasons usually cannot be fully determined.
Technical analysts and their view of supply and demand
Remember that countless participants enter the market for many different personal reasons, and together they create supply and demand. In trading markets, supply and demand can come from a long-term investor accumulating or distributing a large position, or from a short-term trader trying to scalp a few points.
The number of participants and their different reasons for contributing to supply and demand are almost limitless. That is why technical analysts believe it is futile to analyse each component of supply and demand, except through what price reveals. Economic data, company information and other news that affect prices often arrive late, are inaccurate or are sometimes misread, whereas price is the most accessible and most accurate source of information. There is no better basis for study than this key variable.
Moreover, for an investor or trader, what determines our profit or loss is price, not corporate earnings or central bank policy. The core concern of the technical analyst is price, and fortunately, prices tend to move in trends.
The fractal nature of trends
Trends can exist across many different time periods with a similar structure. The ability of trends to repeat their behaviour across different timeframes is called their fractal nature.
Fractal patterns exist in nature, in ocean waves, snowflakes and so on. For example, a snowflake always has six branches, and each branch has a structure of six smaller branches resembling the whole snowflake — a small pattern repeated within a large one.

Financial markets are the same: whether you look at a long, intermediate or very short timeframe, trends form with similar characteristics and patterns. Trend length is therefore relative in technical analysis, because technical principles apply to all timeframes. The trend an investor or trader cares about depends entirely on their investment or trading horizon.
Because shorter trends make up longer trends, analysis of any timeframe should also include the longer and shorter trends around it. For example, if you are interested in the weekly trend, you should also analyse the longer trend (monthly) and the shorter trend (the daily trend, which can give early warning of a reversal in the weekly trend).
So whatever timeframe a trader or investor chooses, the trends of the timeframes above and below it should also be analysed.
For classification, technical analysts divide trends into a few main (relative) groups:
- Primary trend – measured in months or years.
- Secondary/intermediate trend – measured in weeks or months.
- Short-term trend – measured in days.
- Intraday trend – measured in hours or minutes.
Apart from the intraday trend, Charles H. Dow – founder of Dow Jones & Company and The Wall Street Journal – was the first to propose this classification, in the 19th century. He was also one of the first to devise a technical method for identifying when the primary trend reverses.
Because of his great contributions to the field, Dow is regarded as the “father” of technical analysis. We will study Dow Theory in upcoming articles — see you then.
Technical Analysis Course – CMT Level 1
Green Chart designed this course specifically for candidates in Vietnam who want to study and prepare for the CMT Level I exam. The programme includes 28 sessions of theory, practice questions and mock exams. Students also receive the course materials, question bank and mock exams free of charge, and can retake the course for free for life.
See full course details here.