
Contents of this article
The basics of price gaps
Investors can profit from large jumps in asset prices in volatile markets if price moves in their favour. Gaps are areas on a chart where the price of a stock (or other financial asset) rises or falls sharply.
In short, a gap is an empty space on the price chart between two adjacent candles.
An opening gap occurs when the open of the next candle (or bar) differs from the close of the previous candle. This can happen if the market’s view of price changes quickly and a large volume of buy/sell orders arrives suddenly. At some point, the previous candle’s close is no longer attractive to traders, and the new price of the next candle better reflects the asset’s value. More specifically:
- A gap up forms when the low of the next session is above the high of the previous session.
- A gap down forms when the high of the next session is below the low of the previous session.
In Japanese technical analysis, price gaps are called “windows”.
Gaps often form after fundamental news that strongly affects the supply and demand for a stock (or other asset), and they are accompanied by a surge in trading volume.
Note: not every gap is meaningful or useful for trading.
Price gaps can be classified into four types:
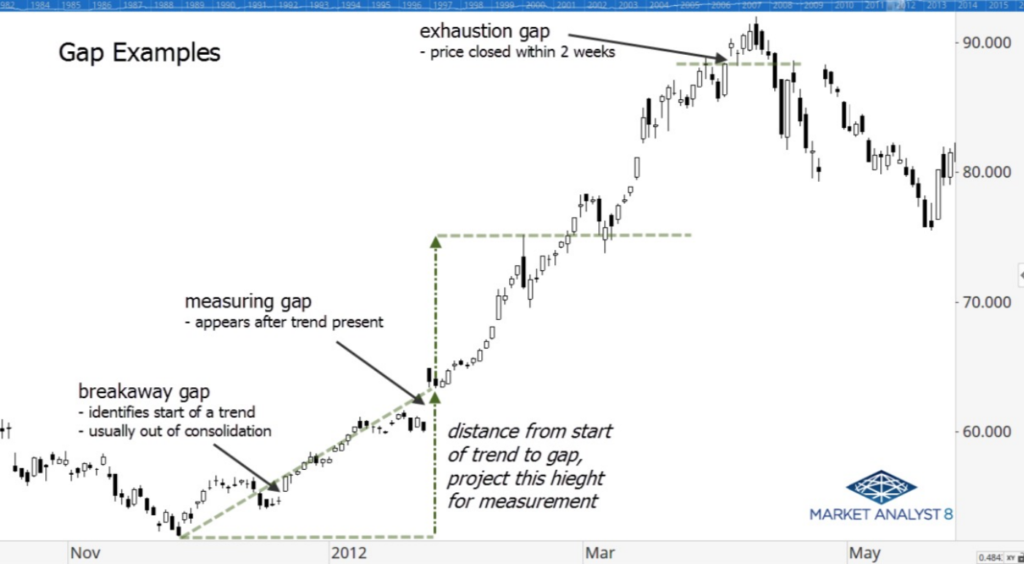
- Breakaway Gap
- Continuation Gap
- Exhaustion Gap
- Common Gap
Here are the details of each type of gap:
1. Breakaway Gap
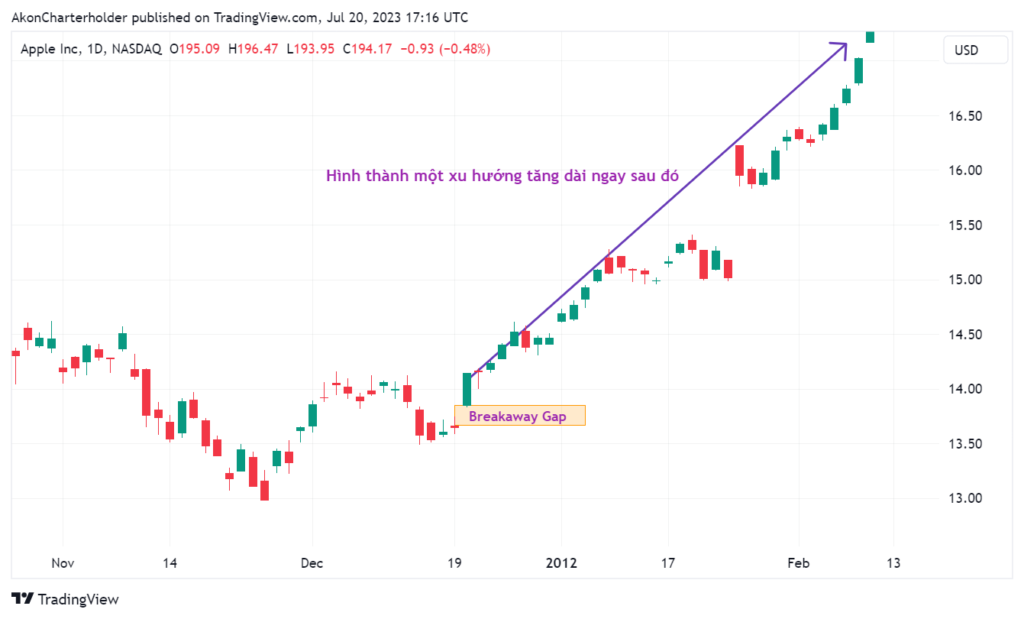
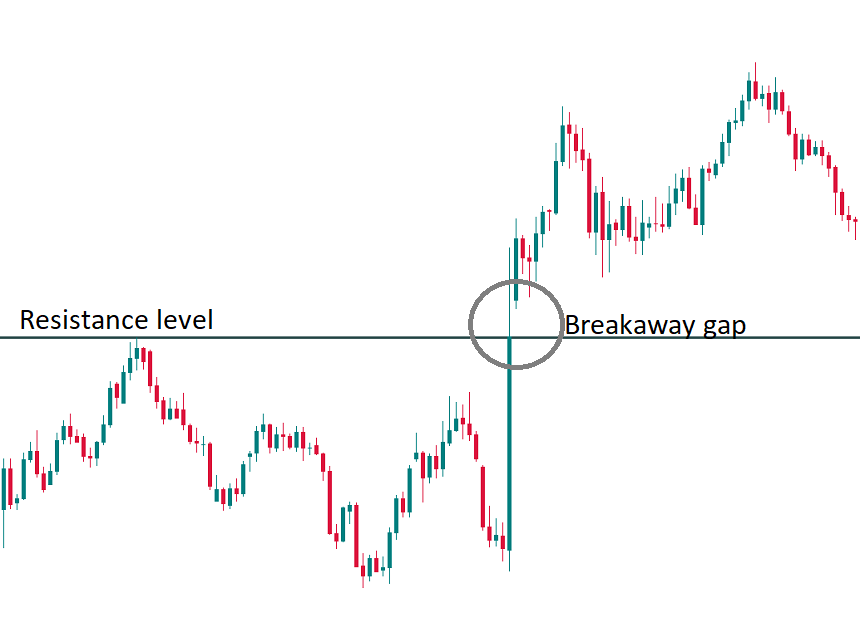
A breakaway gap forms when price jumps out of a chart pattern or a sideways range, signalling the start of a new trend.
Note: the width of the gap is proportional to the strength of the trend that follows.
2. Runaway Gap (also called a Measuring Gap)
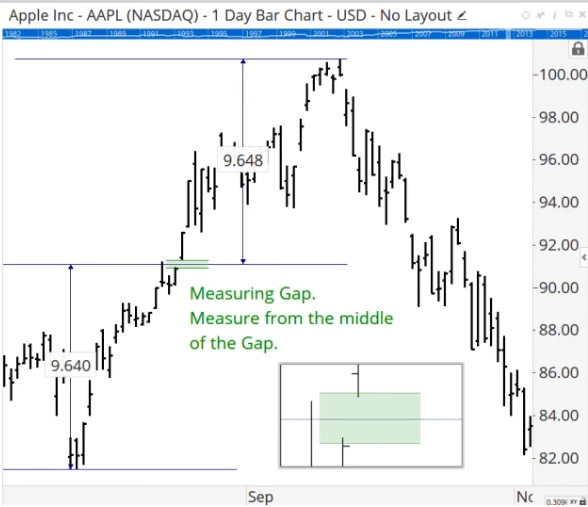
A runaway gap appears in the middle of a strong trend and reflects the belief of buyers or sellers that price will keep moving in the existing direction.
Runaway gaps are often used to project a price target, which is why they are also called measuring gaps.

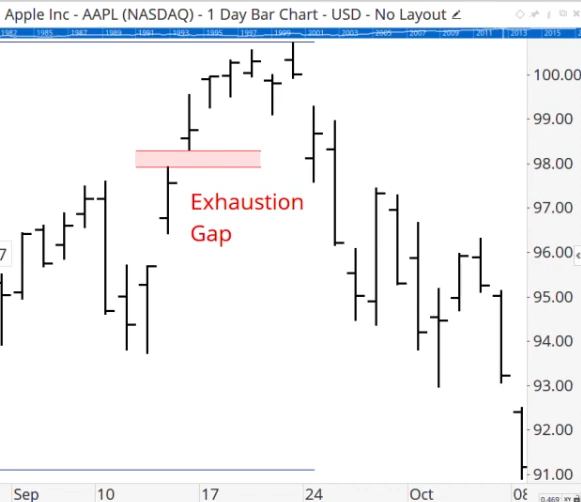
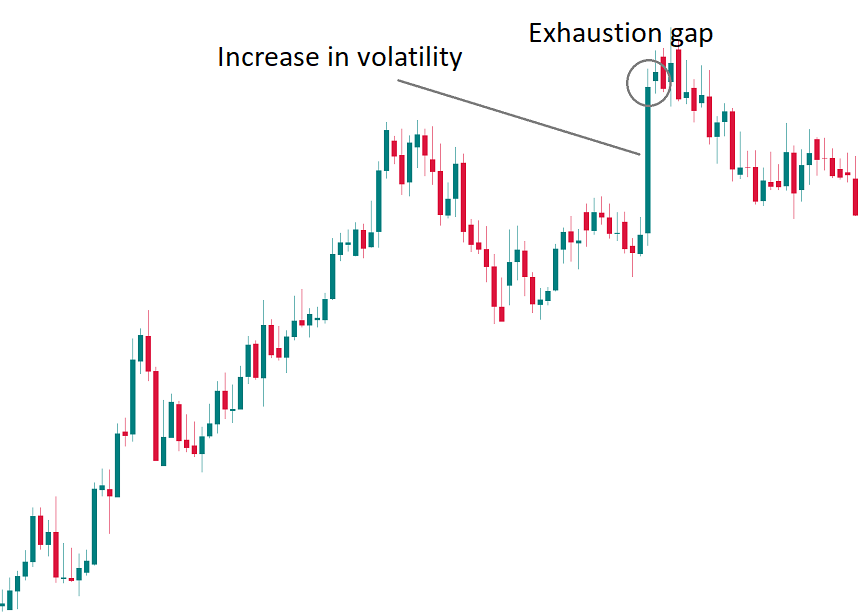
3. Exhaustion Gap
An exhaustion gap occurs near the end of a trend and reflects a final push to reach a new high or low. At this stage, FOMO investors open positions that push price further; however, they are also the last ones to enter the market. As a result, supply (or demand) is exhausted and the trend reverses. The gap created by these FOMO investors is usually “filled” within just a few sessions (this is also a key feature for telling a breakaway gap from an exhaustion gap).
An exhaustion gap warns of a dangerous reversal.
Besides the types of gaps above, you will also see common gaps. By this term, I mean gaps with no distinctive features that simply represent an area where price has left a gap on the chart.
Filling the gap
Once a gap forms, it is treated as an important support/resistance zone. Some gaps are successfully retested; others get filled.
When someone says a gap has been filled, it means price has returned to the level it was at before the gap. Gap filling is quite common because of investors’ irrationality: price jumps on excessive optimism or pessimism, and then needs to correct back to equilibrium.
Conclusion
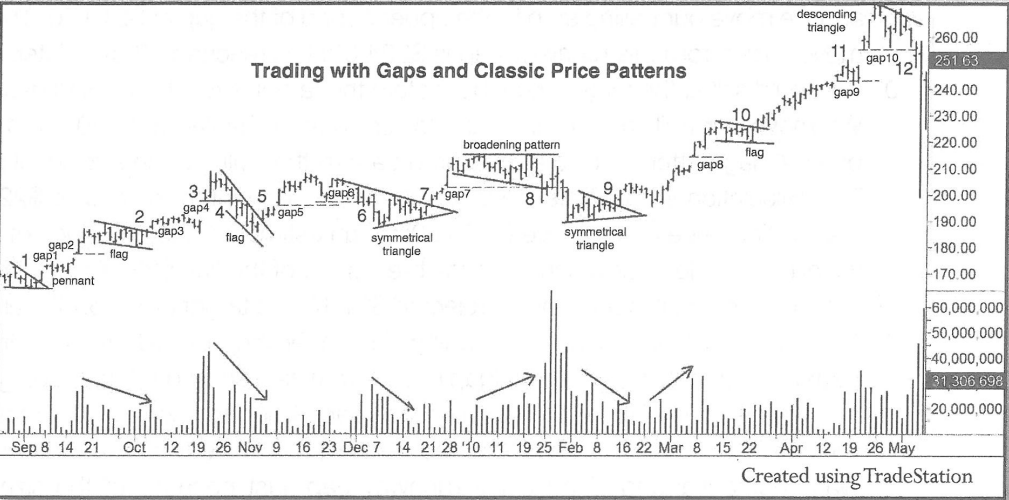
That covers what Green Chart wanted to share about price gaps. Investors who correctly identify which type of gap is appearing on the chart, and who research the key factors behind it, can often trade with a high probability of success. The chart below is an example of combining a gap with a chart pattern (price pattern) when trading AAPL (Nasdaq), with remarkable results!
Happy trading !
Technical Analysis Course – CMT Level 1
Green Chart designed this course specifically for candidates in Vietnam who want to study and prepare for the CMT Level I exam. The programme includes 27 sessions of theory, practice questions and mock exams. Students also receive the course materials, question bank and mock exams free of charge, and can retake the course for free for life.
See full course details here.