
Contents of this article
- What are chart patterns?
- Reversal Patterns
- Head and Shoulders
- Ascending Wedge – a bearish reversal pattern
- Descending Wedge – a bullish reversal pattern
- 123s Higher Lows and Lower Highs
- Double Tops and Double Bottoms
- Support and Resistance
- Trendlines
- Channels
- Continuation Patterns
- Rectangles
- Ascending Triangle
- Descending Triangle
- Symmetrical Triangle
- Flag
- Pennant
- Technical Analysis Course – CMT Level 1
What are chart patterns?

Chart patterns are formations that appear on price charts and help traders anticipate high-probability moves in a stock’s price.
Chart patterns can form on any timeframe, from a few hours to many years. A familiar example is Japanese candlestick patterns, which provide detailed and reliable information about the direction of price movement.
Chart patterns can be divided into two main types: (a) “reversal patterns”, where the market reverses its previous trend, and (b) “continuation patterns”, where the market resumes its main trend after a period of correction or sideways movement.
| Reversal Patterns | Continuation Patterns |
|---|---|
| Head and Shoulders | Channels |
| Ascending and Descending Wedges | Rectangles |
| 123s Higher Lows, Higher Highs | Flags and Pennants |
| Double Bottoms and Double Tops | 1234s Higher Lows, Lower Highs |
| Support & Resistance, Trendlines | |
| Pivots | |
| Japanese candlestick patterns |
Reversal Patterns
Head and Shoulders
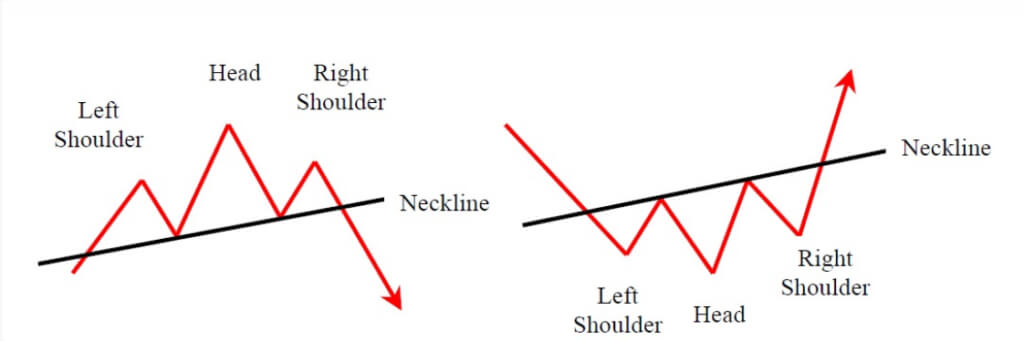
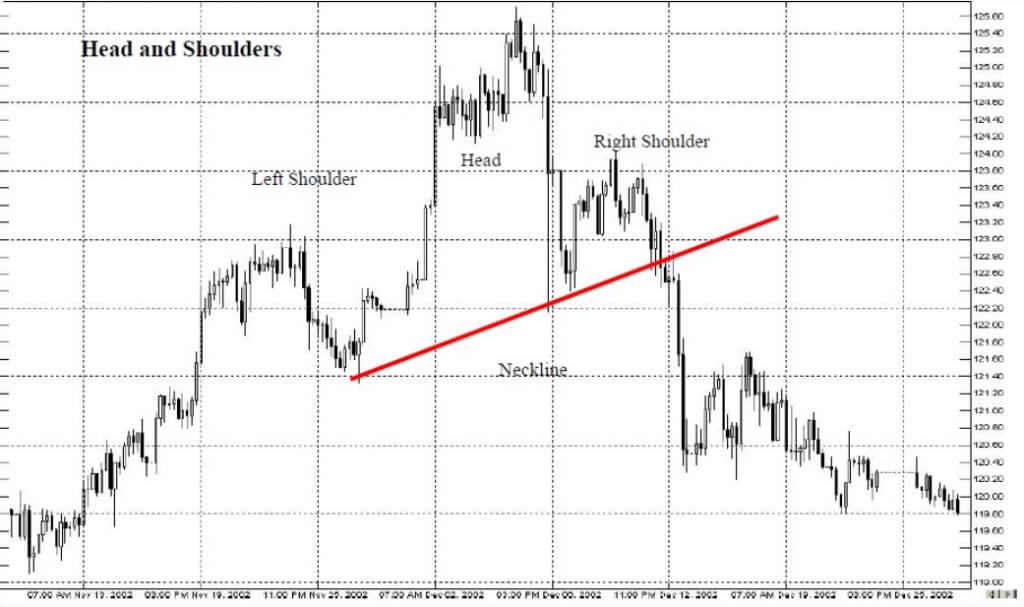
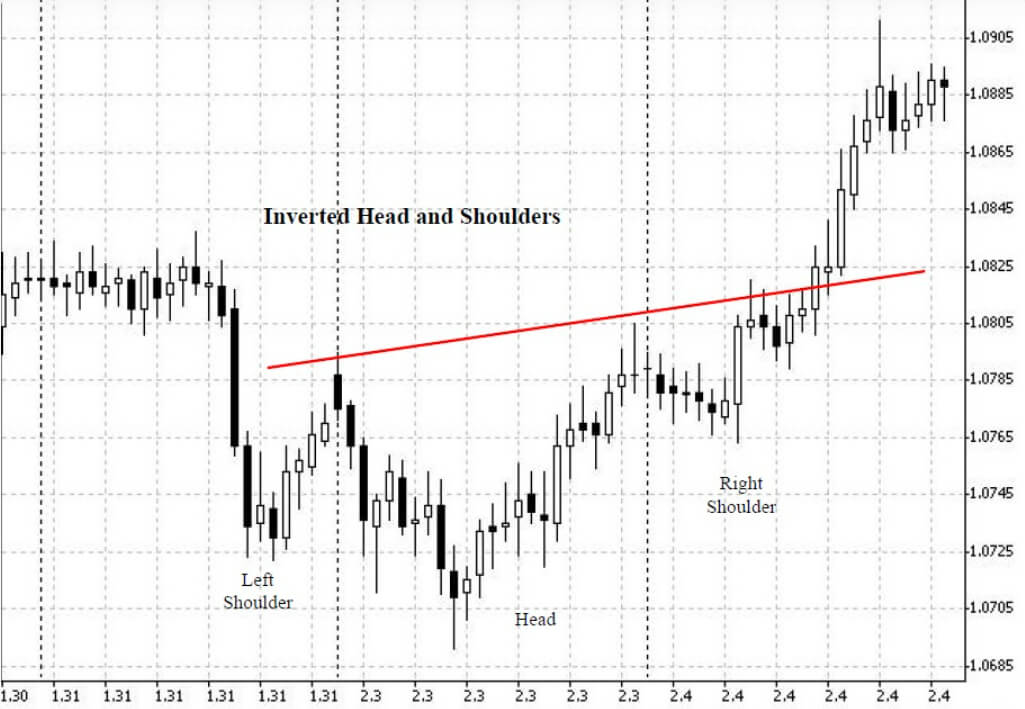
The head and shoulders pattern comes in two forms: the standard pattern (Head and Shoulders) and the inverse pattern (Inverted Head and Shoulders). The standard head and shoulders has three peaks, with the middle peak the highest. Conversely, the inverse head and shoulders has three troughs, with the middle trough the lowest.
A neckline is drawn by connecting the troughs on either side of the head. In the standard head and shoulders, a break of this neckline creates a “selling opportunity”. In the inverse head and shoulders, the neckline connects the peaks on either side of the head, and when price breaks the neckline it creates a “buying opportunity” for traders.
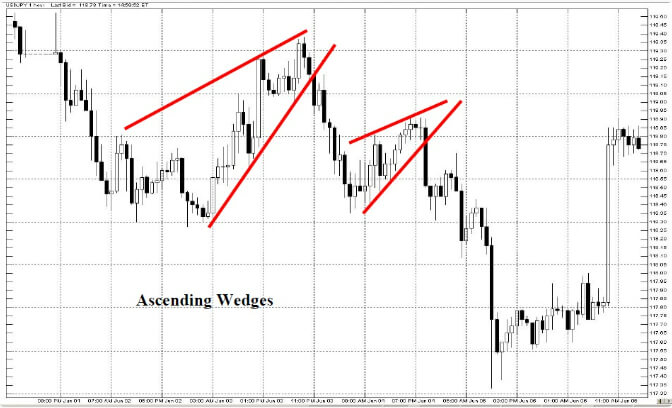
Ascending Wedge – a bearish reversal pattern
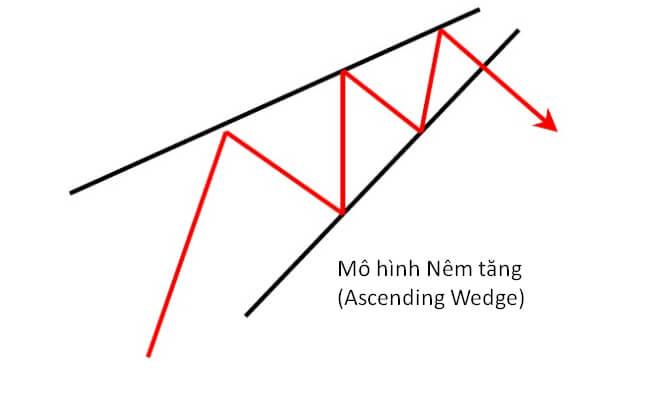
This pattern occurs when the lines connecting price’s peaks and troughs converge at a point, forming a slanted wedge. Both lines slope upwards, with the lower line steeper than the upper line. When price breaks out of the wedge (breaking the lower line), it offers a “selling opportunity” with very impressive effectiveness.
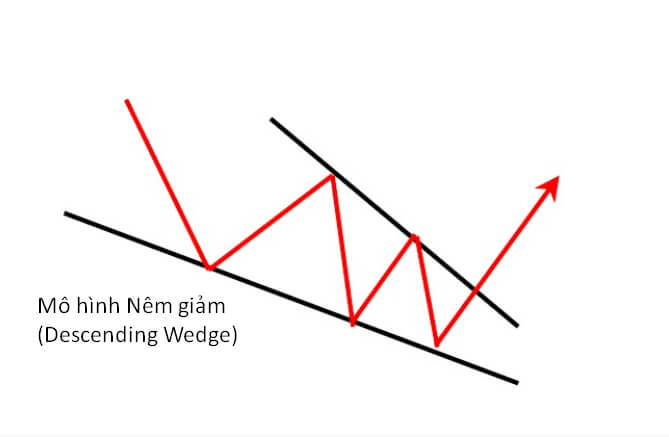
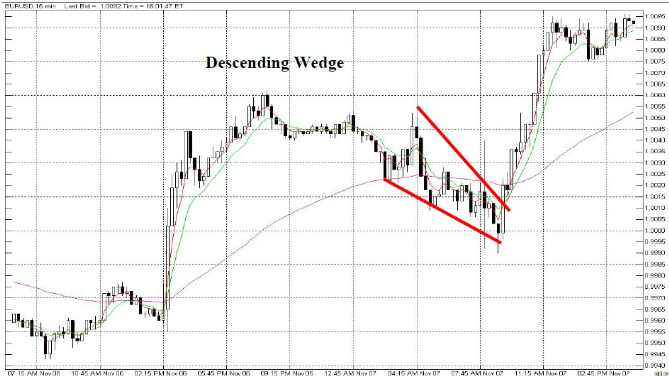
Descending Wedge – a bullish reversal pattern
A descending wedge forms when you connect price’s peaks and troughs into a downward-sloping wedge, with the upper line steeper than the lower line. To trade this pattern, traders open a long position when price breaks out upwards from the wedge.
123s Higher Lows and Lower Highs
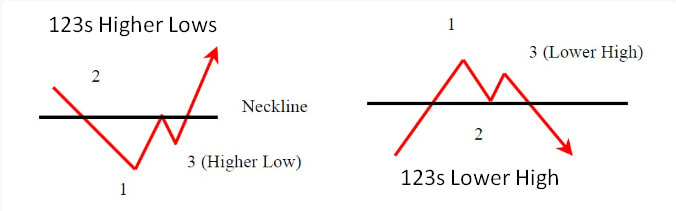
The 123s Higher Lows or 123s Lower Highs pattern can also be considered a continuation pattern. However, at the end of a trend, this pattern provides fairly accurate confirmation that price has changed trend. Point “3” is a failed retest of the previously established peak or trough. Price’s failure to return to retest the old peak or trough shows the market changing from a bull market to a bear market, or vice versa. Point “3” can also be called a “higher low” or a “lower high”.
To apply the 123s Higher Lows and Lower Highs pattern in trading, open a long or short position when price breaks through the neckline (see the illustration below).
Double Tops and Double Bottoms
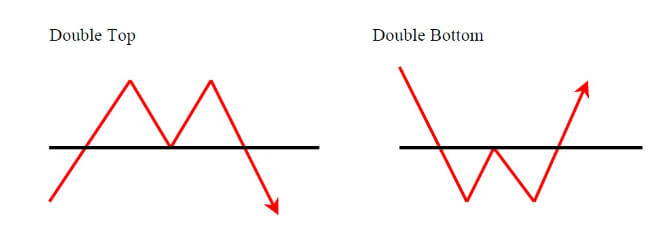
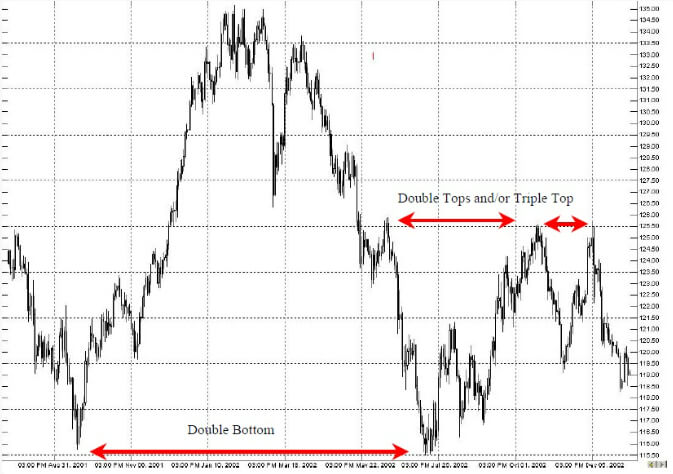
Double tops and double bottoms are among the best-known and most profitable chart patterns traders know. Triple tops and triple bottoms are viewed and traded in a similar way.
A double top occurs when price tries but fails to break above a previously established peak. Note that this pattern consists of two peaks of roughly equal height. Many traders wait for confirmation of the downtrend, when price breaks below the trough, before opening a short position.
Once a double top has formed, the take-profit target after entering can be estimated from the distance between the trough and the second peak.
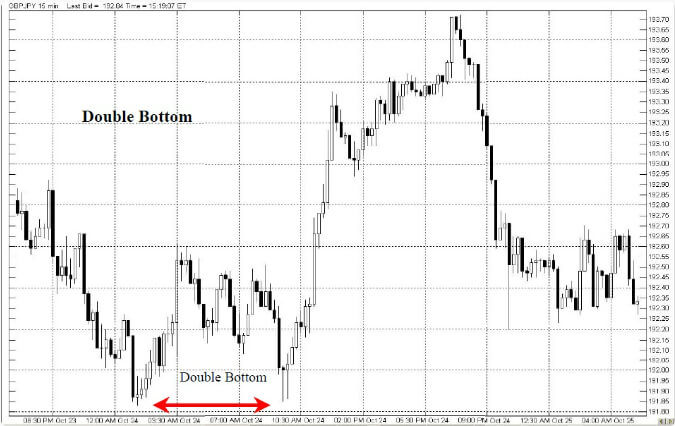
The opposite of the double top is the double bottom – a bullish pattern that is viewed and applied in the same way as the double top.
Trading signals from double tops (M-shaped) and double bottoms (W-shaped) are more accurate when the peaks or troughs are far apart. Also, the two peaks of a double top do not have to be the same height; there can be a difference between them. For example, in a double bottom, a second trough slightly higher than the first can be a strong bullish signal for traders to open a long position.
Advanced: if the peaks or troughs of a double top or double bottom coincide with a pivot point, the pattern’s probability of success becomes even higher and more accurate.
Support and Resistance
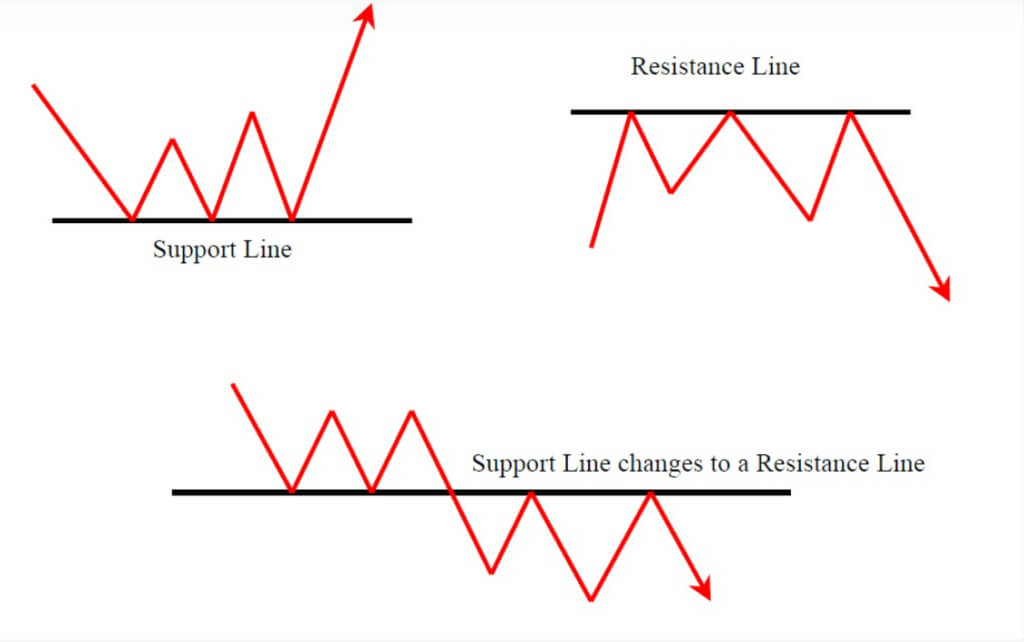
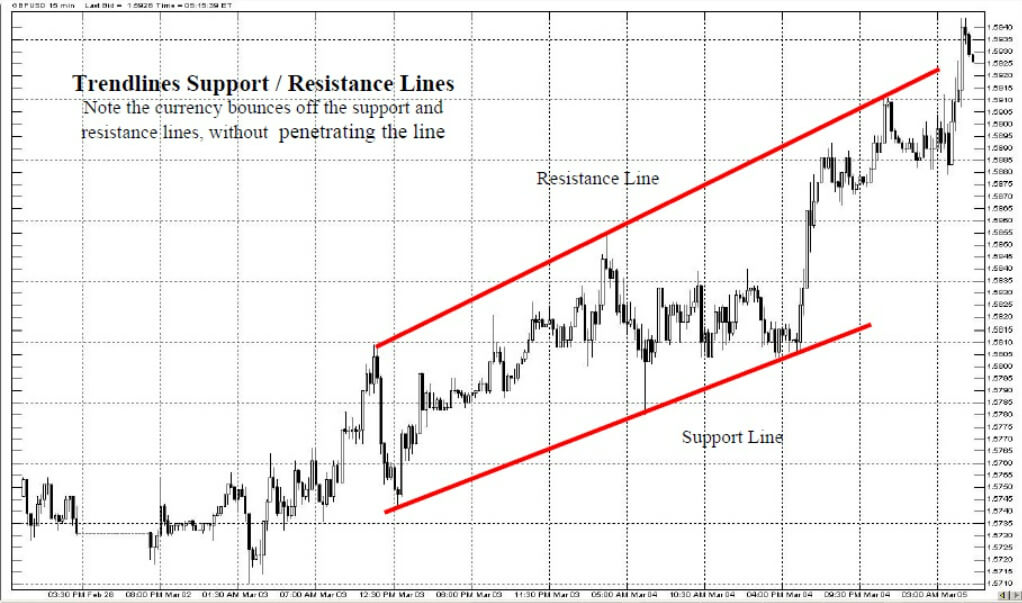
A resistance line is drawn by connecting peaks. Depending on its strength, a resistance line can interrupt an uptrend or even reverse it. The strength of a resistance line is determined by how long it has acted as resistance and how many times price has touched it. The longer it has existed, the stronger the resistance. Selling at resistance is a very popular strategy used by many traders.
Conversely, a support line is drawn by connecting troughs, and it can interrupt or even reverse a downtrend depending on its strength. In practice, many traders wait for price to fall to a support zone before opening a long position.
Remember this mantra about support and resistance:
Don’t buy right below resistance,
Don’t sell right above support,
Because a reversal is very likely at support and resistance zones.
To learn more about support and resistance, you can read the full, detailed article here.
Trendlines
The most important thing for traders is to determine how the market is moving: whether price is in an uptrend, a downtrend or even moving sideways. Traders can make money in any phase of the market. But whatever phase the market is in, traders always keep one vital rule in mind: “trade with the trend”.
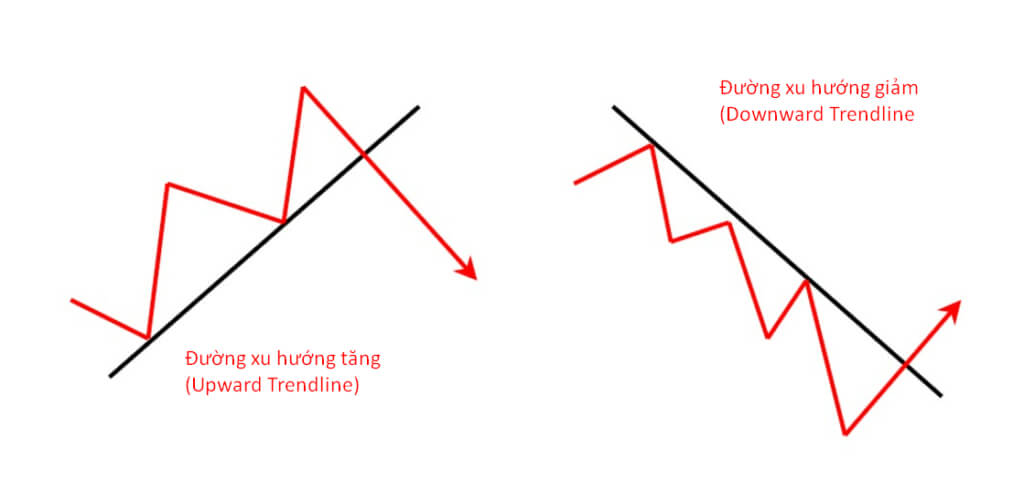
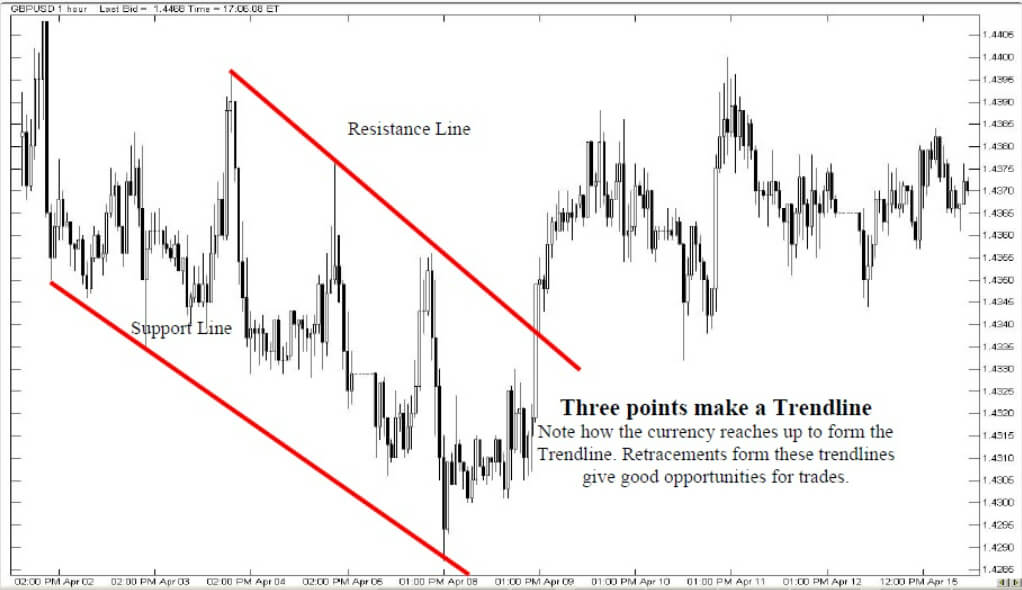
A trendline is a straight line connecting peaks to peaks or troughs to troughs. An upward trendline connects successively higher troughs. Conversely, a downward trendline connects successively lower peaks, each lower than the one before.
A trendline connecting peaks is also called a resistance line, while a trendline connecting troughs is also called a support line.
Trendlines serve as boundaries that help traders make buy or sell decisions. Drawing trendlines on a chart forms the boundaries of most of the chart patterns covered in this article.
In trading, signals from trendlines with a slope of about 45 degrees tend to be fairly accurate; if a trendline is steeper than that, the market usually cannot sustain the trend’s momentum for long.
A popular trendline strategy is: wait for price to touch the trendline a third time before opening a long or short position.
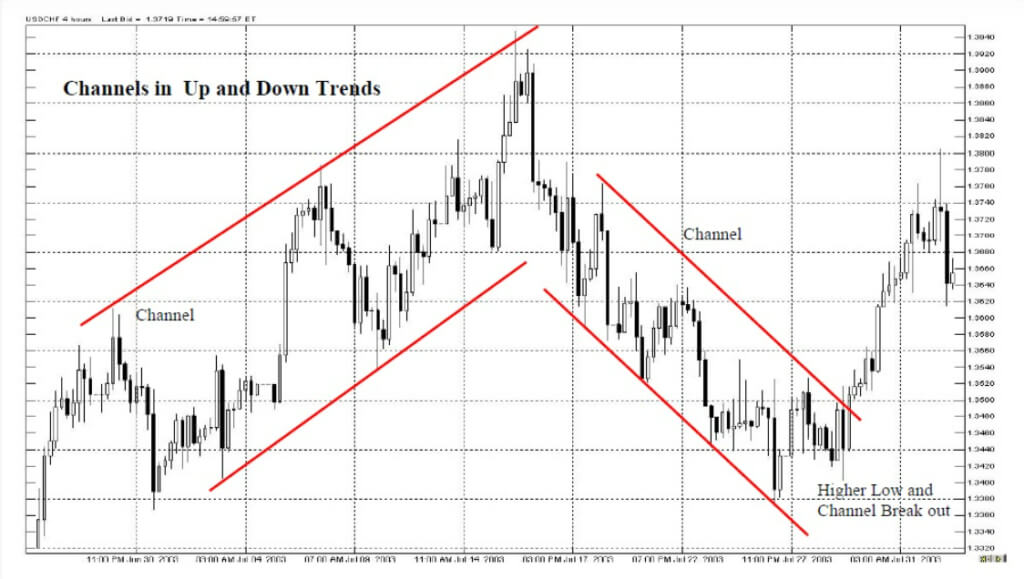
Channels
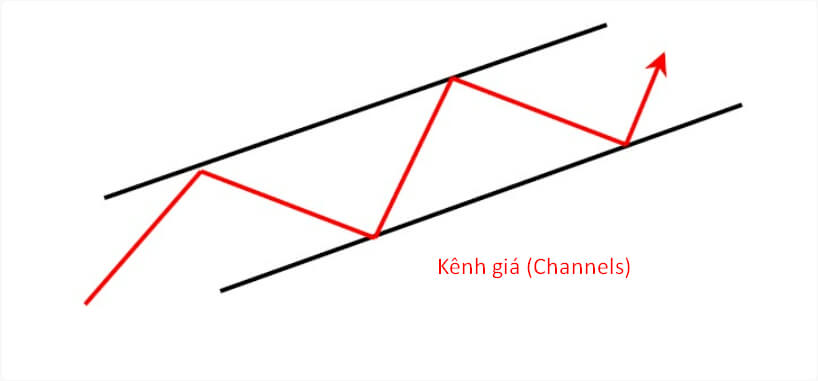
When price trends between two parallel trendlines, they form a price channel. When price touches the lower trendline, this can be used as a buying zone, and when price touches the upper trendline, this can be used as a take-profit zone, and vice versa.
In addition, a price break of the trendline or of the support and resistance lines also provides good buy or sell signals.
Note: channels can slope upwards, slope downwards or be horizontal.
Continuation Patterns
Rectangles
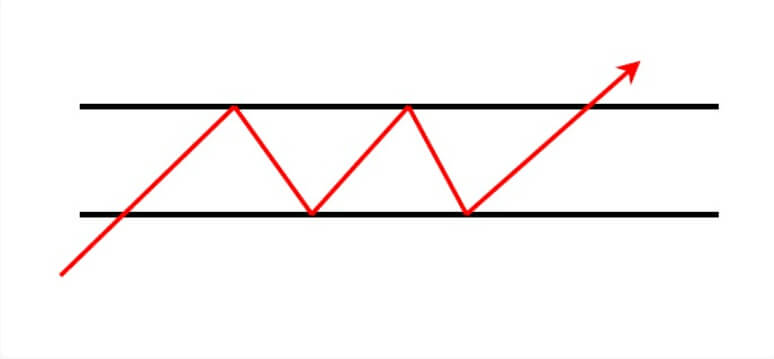
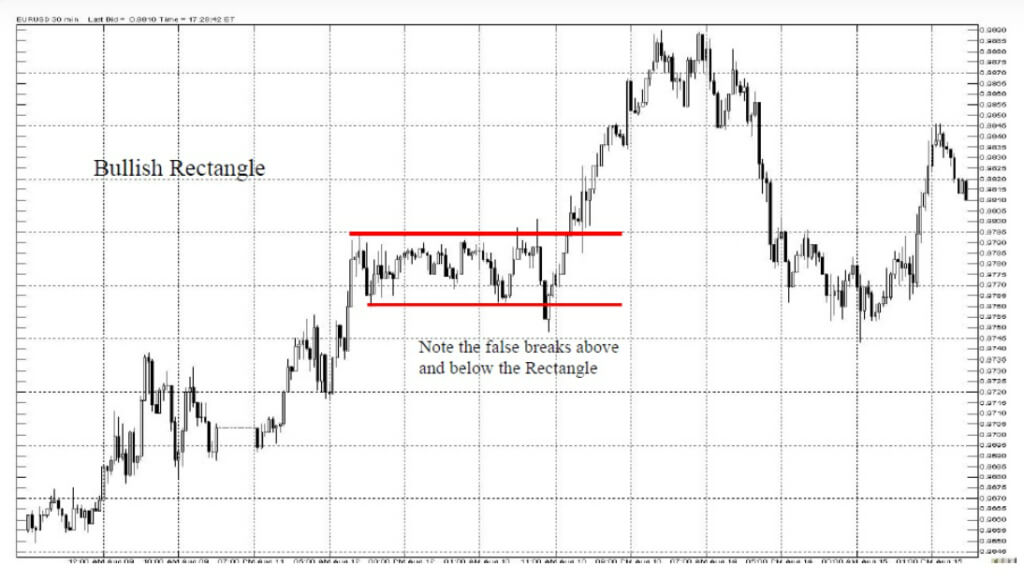
Rectangle – Bullish in an Uptrend
When the market moves sideways, we can draw a resistance line through the peaks and a support line through the troughs to form a rectangle pattern. Buy when price closes above the rectangle and, conversely, sell when price closes below it. Sometimes a bull trap occurs: price breaks the upper edge, returns into the rectangle and then closes below the support line (the lower edge of the rectangle).
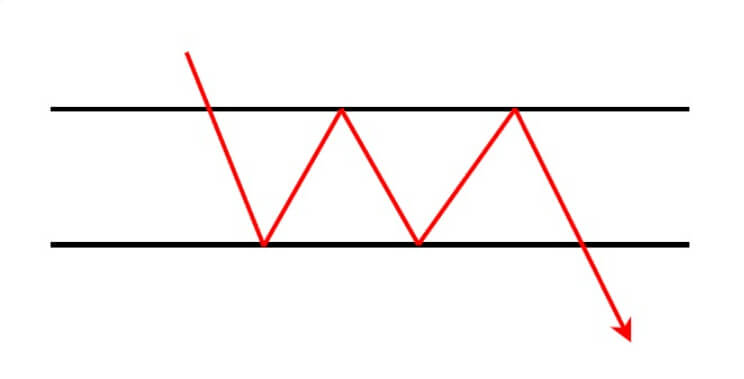
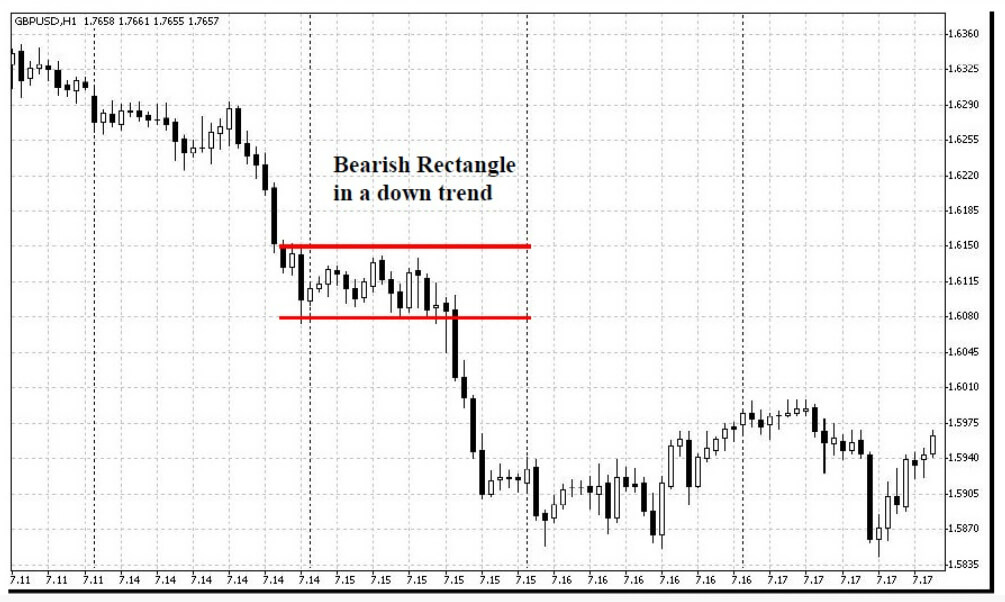
Rectangle – Bearish in a Downtrend
Similarly, for a rectangle in a downtrend, we set up a short trade when price breaks and closes below support (the lower edge of the rectangle).
Ascending Triangle
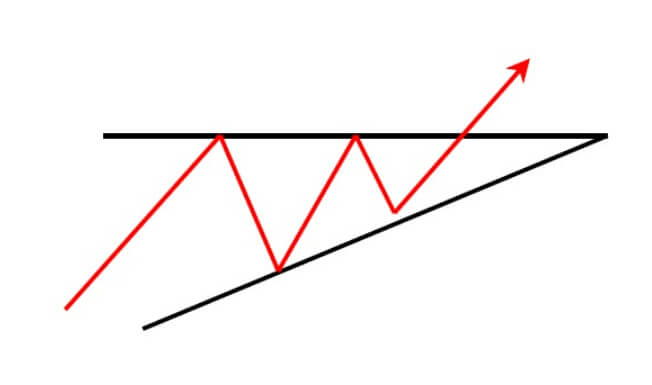
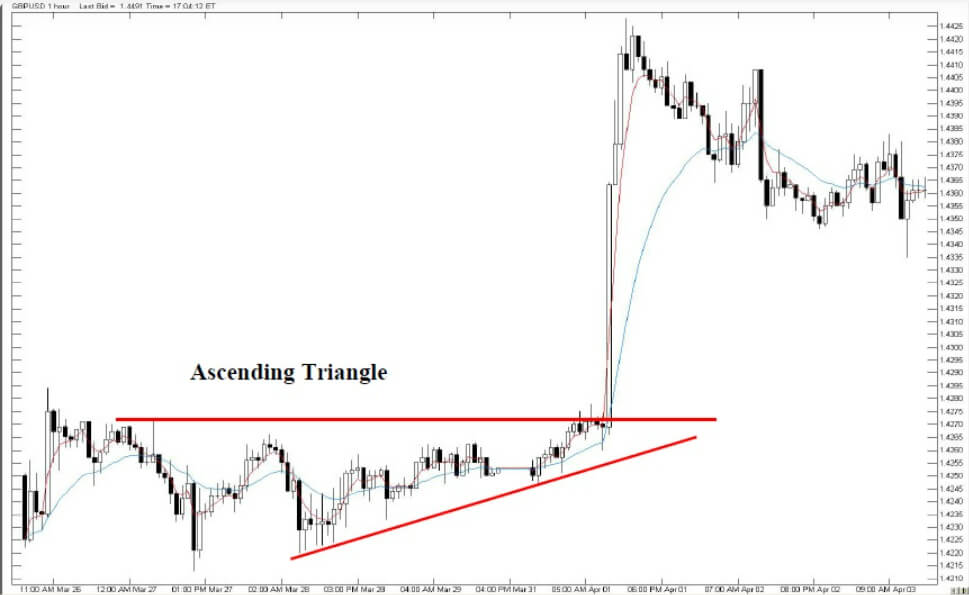
An ascending triangle is formed by a horizontal trendline (or resistance line) parallel to the bottom of the chart while the rising trendline slopes upwards. Joining the two trendlines forms a triangle. Traders place a buy order when price breaks out and closes above the triangle. In the opposite case (a failed pattern), sell when the market breaks down and closes below the triangle.
Descending Triangle
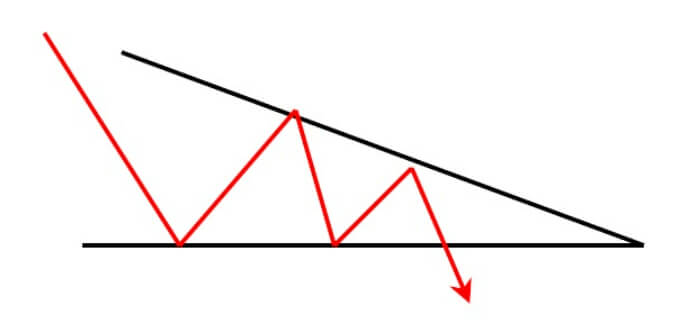
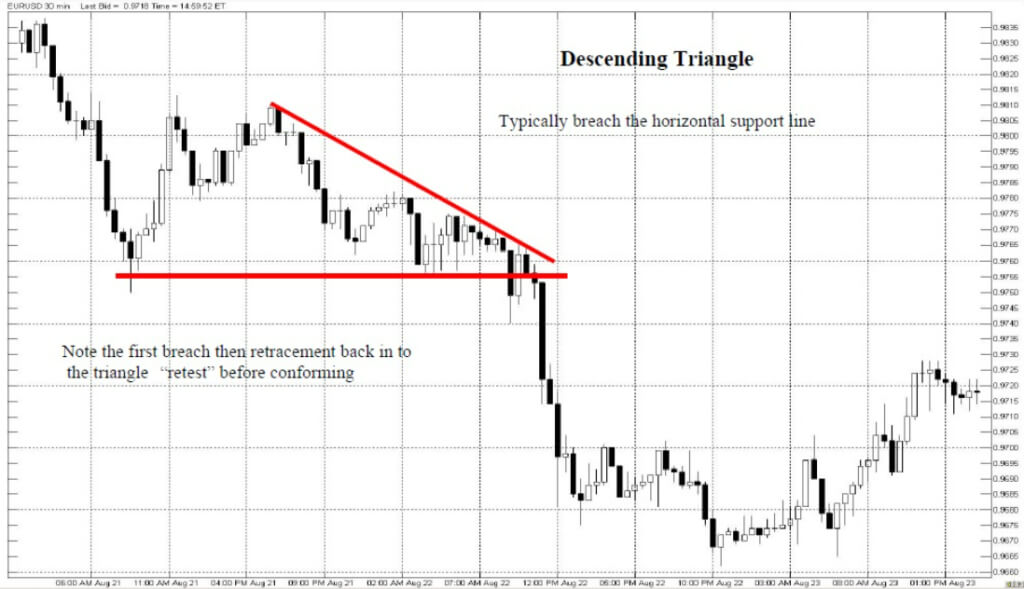
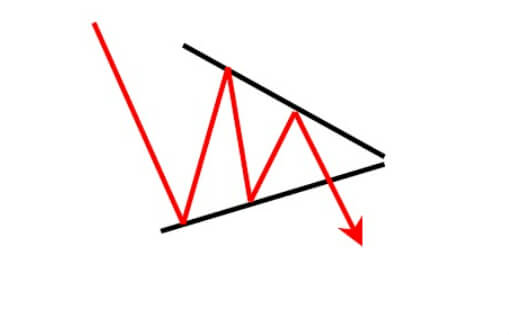
A descending triangle is identified by price making lower highs and a series of equal lows. Connecting these points forms a right-angled triangle whose hypotenuse slopes from top to bottom and from left to right. In the illustration below (Figure 12.1), price forms two troughs inside the triangle, which act like a final invitation for small, weak-handed retail investors to buy just before price falls and breaks sharply out of the triangle, signalling heavy selling pressure. The trading strategy is to sell when price breaks down and closes below the triangle.
The descending triangle is one of the most reliable chart patterns, because both supply and demand can be easily identified on the chart.
Symmetrical Triangle
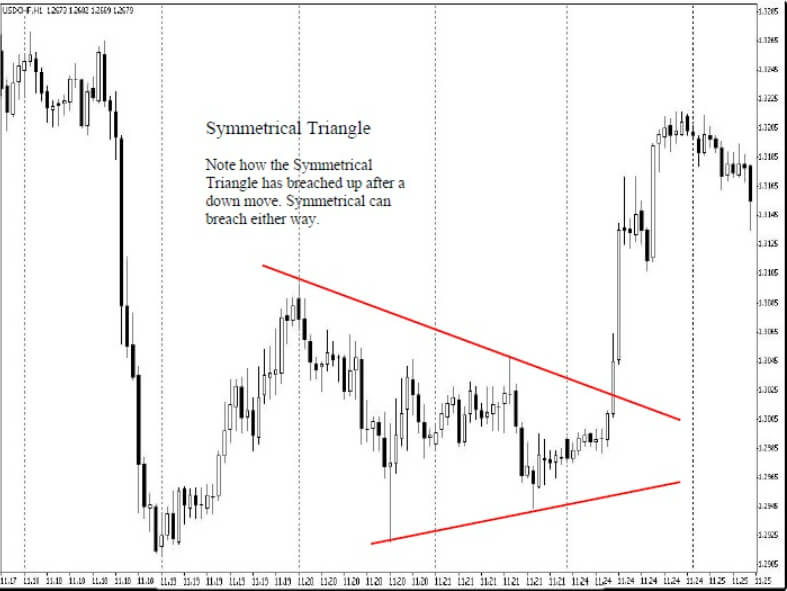
Symmetrical Triangle – in an uptrend
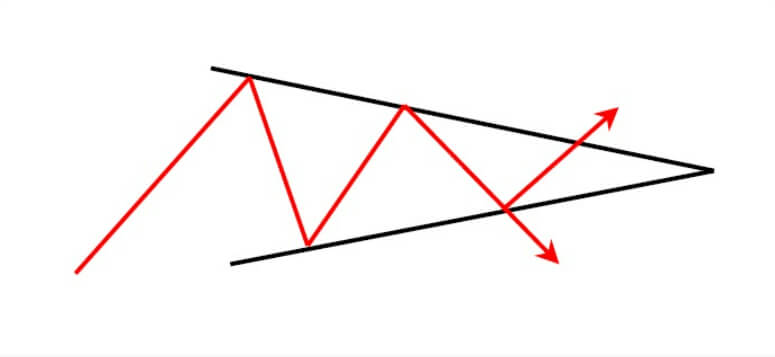
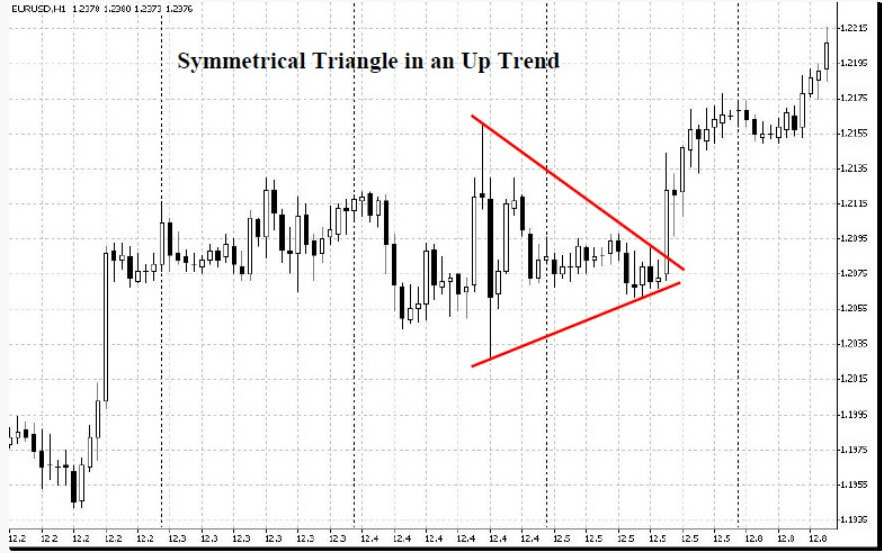
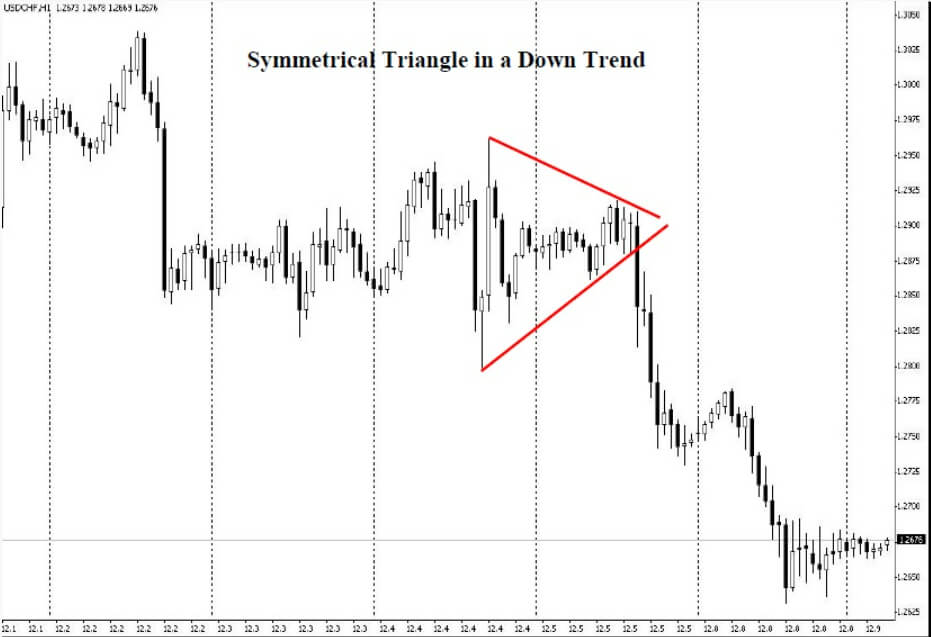
A symmetrical triangle is a pattern in which the trendlines connecting price’s peaks and troughs converge at a point. (Figure 13.1)
A symmetrical triangle is formed by waves of selling and recovery, each smaller than the last, compressing price inside the triangle. Over time, an event or news may appear and spread through the market, pushing price to break out of the triangle.
As a trading strategy, place a buy or sell order in the direction of the breakout.
Symmetrical Triangle – in a downtrend
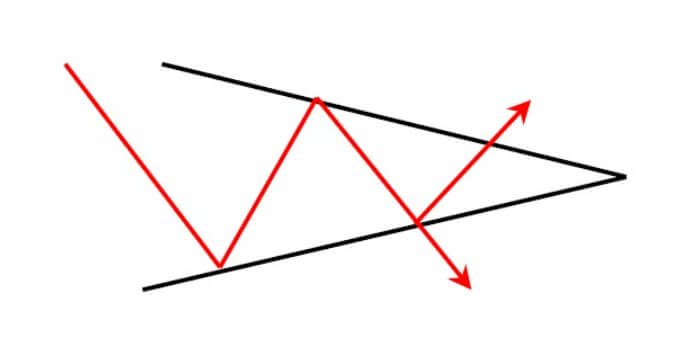
Place a sell order when price breaks out of the triangle.
Flag
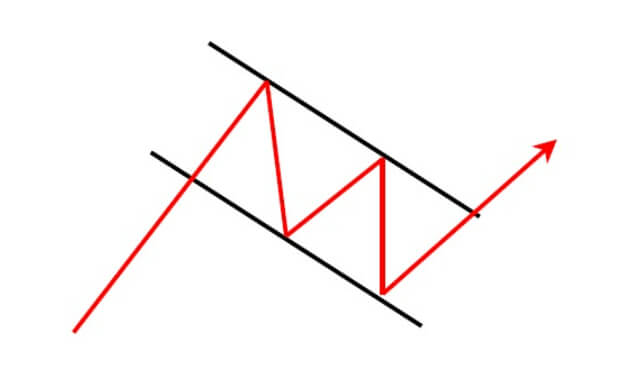
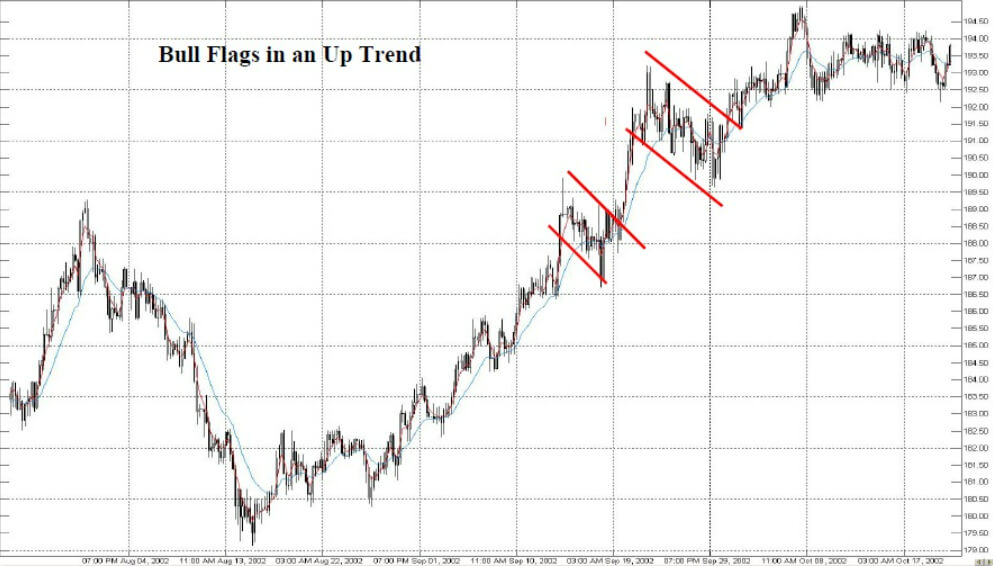
Flag – in an uptrend
A bull flag is identified by two parallel trendlines connecting lower highs and lower lows, forming an intermediate trend (a downtrend) that runs against the main trend (an uptrend).
As a trading strategy, buy when price breaks out upwards from the flag.
Flag – in a downtrend
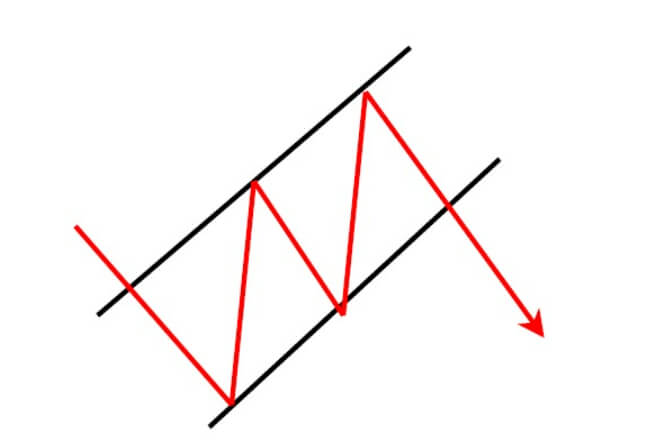
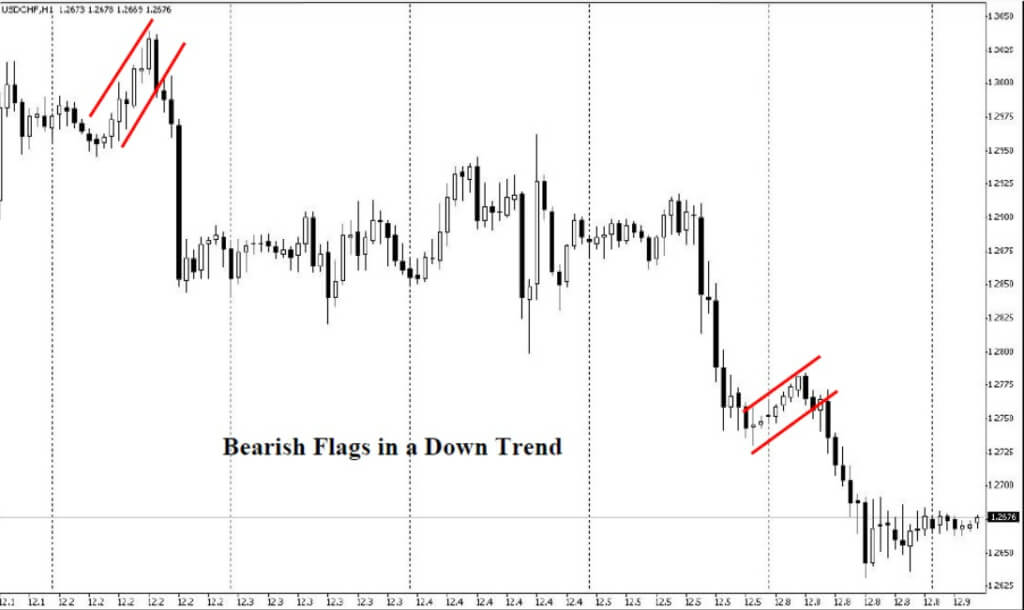
A bear flag is identified by two parallel trendlines connecting higher highs and higher lows, forming an intermediate trend (an uptrend) that runs against the main trend (a downtrend).
As a trading strategy, sell when price breaks down out of the flag.
Pennant
Pennant – in an uptrend
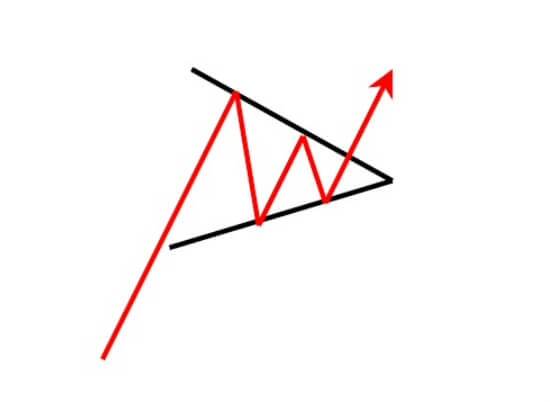
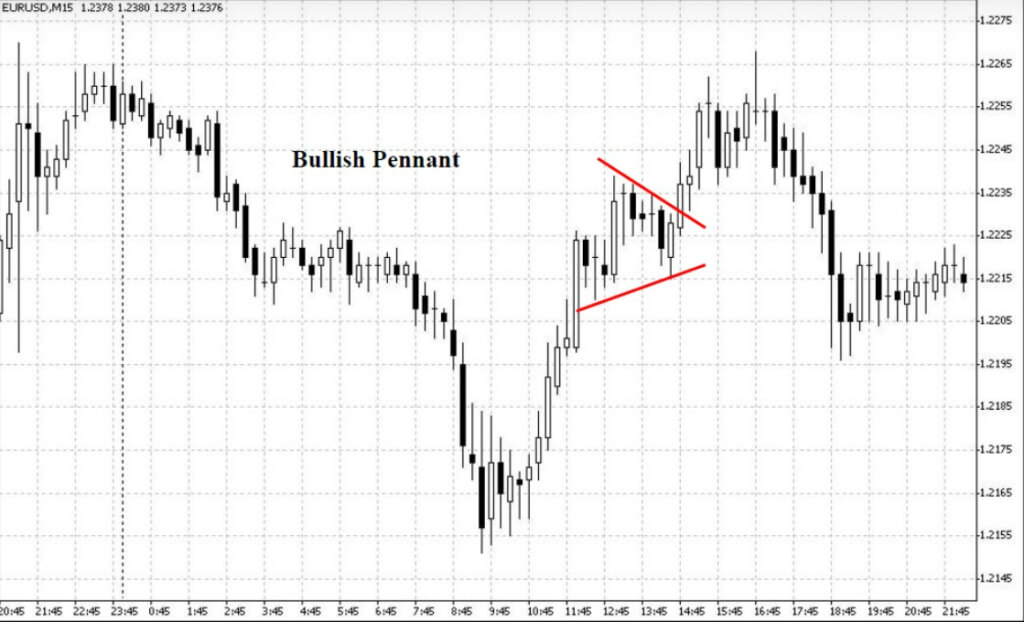
A bullish pennant looks quite similar to a symmetrical triangle but is usually smaller in size (volatility) while it forms. The bullish pennant is read in the same way as the bull flag, except that price forms a triangle rather than a flag.
Pennant – in a downtrend
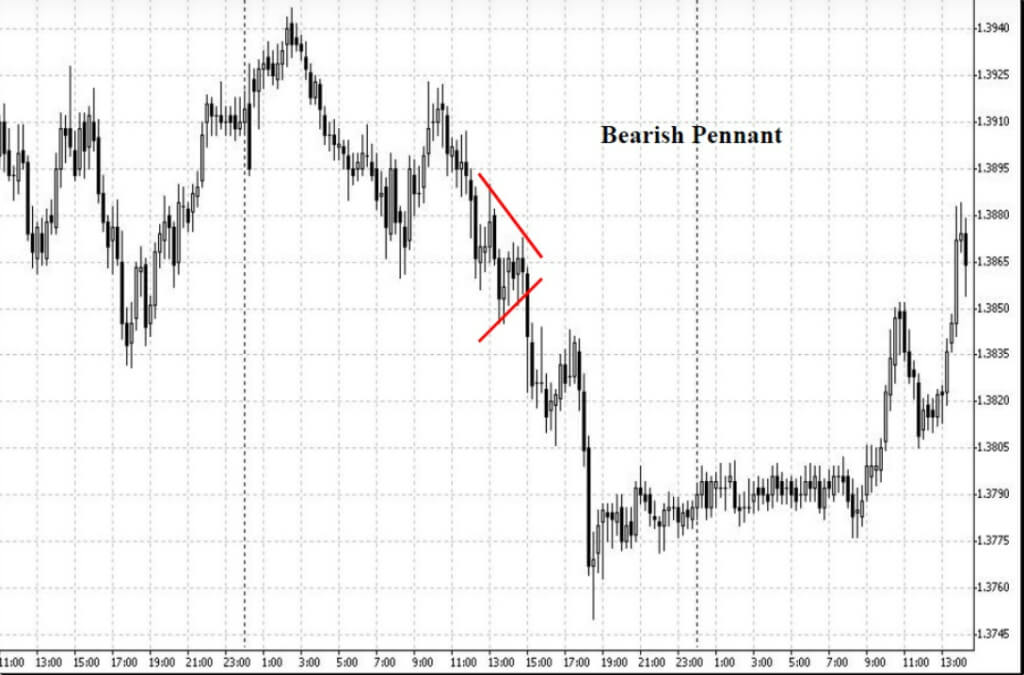
Likewise, the bearish pennant is read in the same way as the bear flag; the only difference is that price forms a triangle rather than a flag.
Technical Analysis Course – CMT Level 1
Green Chart designed this course specifically for candidates in Vietnam who want to study and prepare for the CMT Level I exam. The programme includes 27 sessions of theory, practice questions and mock exams. Students also receive the course textbook, question bank and mock exams free of charge for their exam preparation, and can retake the course for free for life.
See more details about the course here.
Happy trading !