Contents of this article

The price channel is a highly effective but often overlooked chart pattern. Traders can combine price channels with other technical analysis tools to identify potential buy and sell points. In this article, Green Chart first shows you how to identify a price channel on a chart. The next steps cover identifying the buy point and timing when using price channels, where to place the stop-loss (cut loss) and where to take profit.
How to identify and draw a price channel
In technical analysis, a price channel forms when an asset’s price moves between two parallel trendlines. The upper trendline connects the rising (or falling) highs, while the lower trendline connects the lows. A price channel can slope up, slope down or run sideways on the chart
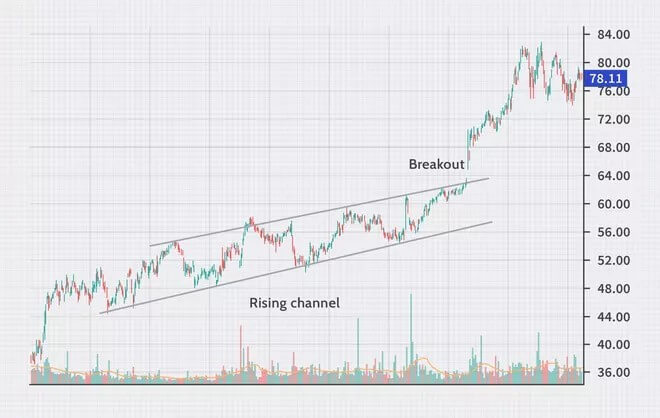
If price breaks out above the channel, it may go on to rise further.
For example, the chart below shows a price channel and a breakout in the stock of Hyatt Hotels Corporation (H). Conversely, if price breaks below the lower edge of the channel, the downtrend may extend further.
Price channel trading usually works best on stocks with moderate volatility. This is important in determining how much profit or loss a trade may produce.
For example, if volatility is low, the channel will not be very wide, so the potential profit will be smaller. Wider channels are usually associated with greater volatility, which means higher potential profit.
The main types of price channels
A price channel needs at least four touch points to form, because we need at least two lows to connect and two highs to connect. In general, there are three types of price channels:
A channel sloping upward is called an ascending price channel.
A channel sloping downward is called a descending price channel.
Ascending and descending channels are also known collectively as trend channels, because price moves in the direction of the channel.
A channel with horizontal trendlines is called a horizontal channel, a trading range or a rectangle pattern.

Buy and sell strategies using price channels
Price channels can give traders buy and sell points with a few entry rules:
- When price rises to the upper edge of the channel, close your current long position and/or open a new short position.
- When price is in the middle of the channel, stay on the sidelines and wait patiently if you have no position; if you do, keep holding your current positions.
- When price touches the lower edge of the channel, close your current short position (if you are short selling) and/or open a new long position.
There are two exceptions to these rules:
- If price breaks through the lower or upper edge of the channel, the channel is no longer valid. Do not open any more trades until a new channel forms.
- If price moves within the channel for a long time, a new, narrower channel may form. You can then use the smaller (narrower) channel to open new positions or exit at its upper or lower edges, following the rules above.
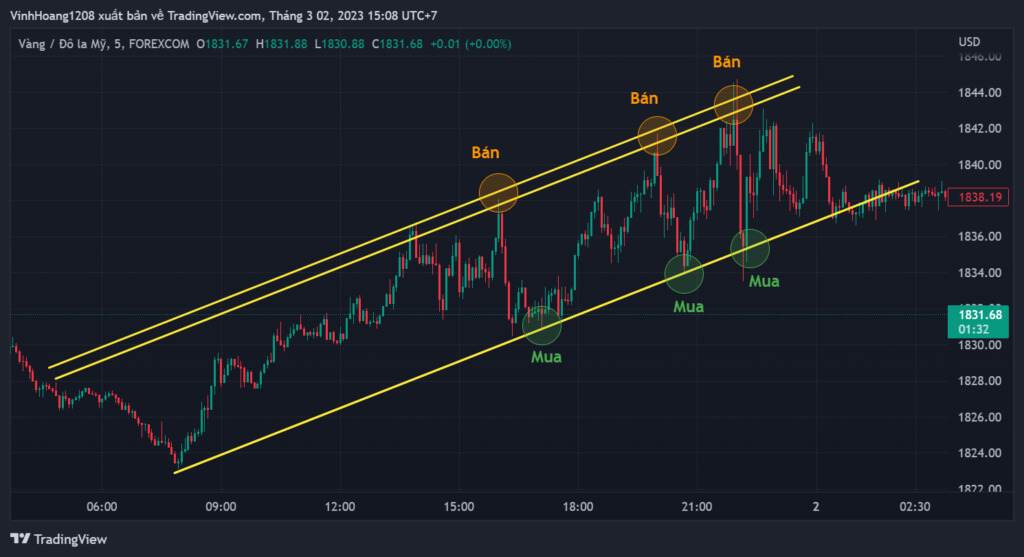
In an ascending channel, focus on and wait patiently to buy at the lower edge of the channel and take profit at the upper edge. Be careful with short selling, because the current price trend is up.
For example, an ascending channel is shown below on the stock of NVIDIA Corporation (NVDA).

In a descending channel, focus on finding short positions at the upper edge of the channel and exiting at the lower edge. Be careful buying or bottom-fishing in a descending channel, because the trend is down.
Other technical analysis tools are sometimes used alongside price channels to improve the accuracy of their trading signals and to check the momentum of the up or down trend. Tools that can be combined with price channel trading include:
- Divergence on the Moving Average Convergence Divergence (MACD) warns of a trend reversal. A crossover of the MACD line and the signal line can also confirm potential buy signals at the lower edge of the channel or sell trades at the upper edge.
- A crossover of the Stochastic’s %K and %D lines can also signal a buying opportunity at the lower edge of the channel or a selling opportunity near the upper edge.
- Trading volume can also help when using price channels. Volume is usually fairly low while price moves within a channel, especially near the middle. Channel breakouts are usually accompanied by heavy volume. If volume does not rise during a breakout, the channel is more likely to remain valid and meaningful.
Setting stop-loss and take-profit levels with price channels
Here are the basic rules for setting take-profit and stop-loss levels when trading price channels:
If you bought at the lower edge of the channel, close the position and take profit at the upper edge. Place your stop-loss just below the lower edge of the channel and, of course, leave some extra room to allow for sudden price spikes (stop-loss hunting).
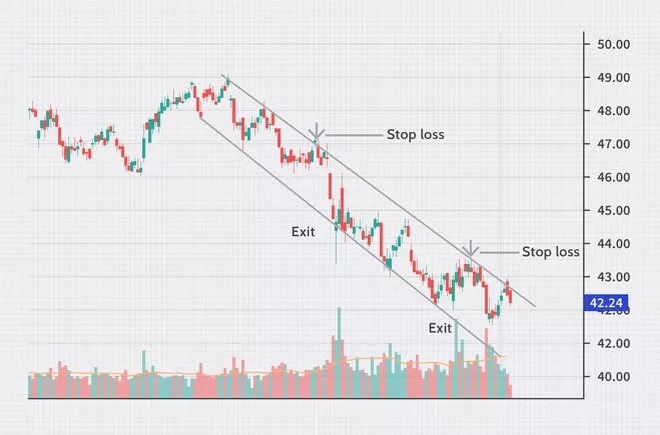
Conversely, if you went short at the upper edge of the channel, take profit at the lower edge. Place your stop-loss just above the upper edge of the channel, plus some extra room to allow for sudden price moves.
For example, you can see a descending price channel on the chart of BCE Inc. (BCE) together with potential stop-loss and take-profit levels.
Happy trading!
Technical Analysis Course – CMT Level 1
Green Chart designed this course specifically for candidates in Vietnam who want to study and prepare for the CMT Level I exam. The programme includes 27 sessions of theory, practice questions and mock exams. Students also receive the course materials, question bank and mock exams free of charge, and can retake the course for free for life.
See full course details here.