Contents of this article
Dow Theory was developed by Charles H. Dow, regarded as the “father” of technical analysis and the founder of the famous Dow Jones financial news service (The Wall Street Journal). He wrote a series of articles starting in the 1900s that in later years were compiled by his followers and named “Dow Theory”. Much of the credit goes to William P. Hamilton, who refined these articles with relevant examples over a period of 27 years. A great deal has changed since Charles Dow’s time, so the theory has always had both supporters and critics. Even so, Dow Theory is still seen as a guiding principle and a foundational theory that laid the groundwork for technical analysis.

The core tenets of Dow Theory
Dow Theory is built on a number of basic ideas known as “Dow’s tenets”. Charles H. Dow developed these tenets over many years of observing the market. Six are considered the most widely known:
| No. | Tenet | Meaning |
| 1 | The averages discount everything | Stock market indices (VN-Index, VN30, etc.) reflect all known and unknown information in the market. If an unusual, unexpected event occurs, stock market indices quickly readjust to reflect accurately what the market expects. |
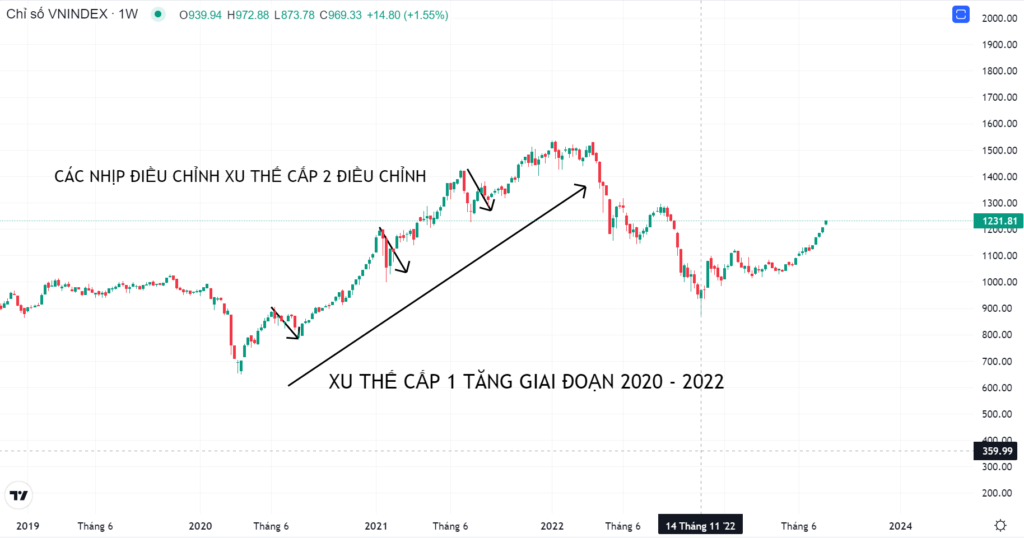
| 2 | The market has three main trends | These are the primary trend, the secondary trend and the minor (tertiary) trend. |
| Primary trend | This is the main trend of the market, usually lasting from one to several years. These are the market’s big waves, such as the stock market uptrend of 2020–2021. Dow’s advice to traders was not to trade against the primary trend. | |
| Secondary trend | Secondary trends are like corrections within the primary trend. They usually move against the primary trend and last from a few weeks to a few months. An illustration follows below the table. | |
| Minor trend | These are small day-to-day fluctuations that are random in nature and generally hard to predict. | |
| 3 | The averages must confirm each other | An uptrend needs to be confirmed by related indices. For example, we should wait for the construction stocks index to confirm a rise before deciding to invest in steel stocks. |
| 4 | Volume must confirm the trend | As a trend develops, it is usually accompanied by rising trading volume. For example, as VNM keeps rising, more and more people take an interest in it, so its trading volume increases. |
| 5 | A trend remains in effect until it clearly reverses | A trend can last a very long time until it reverses. Most apparent reversal signals within a trend are noise. The technical analyst’s goal is to find a trend and ride it as far as possible. |
| 6 | The closing price is the most important | Dow’s view here is similar to that of Eastern (candlestick) technical analysis, which gives more weight to the closing price than to other prices in the session. |
Market phases according to Dow Theory
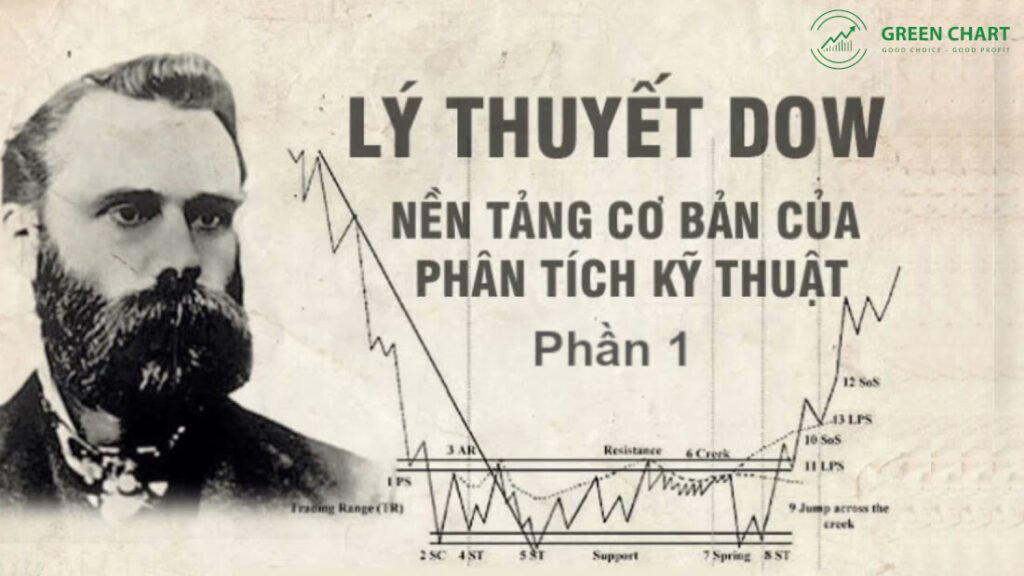
Dow Theory holds that the market is made up of three distinct, repeating phases: the accumulation phase, the mark-up phase and the distribution phase
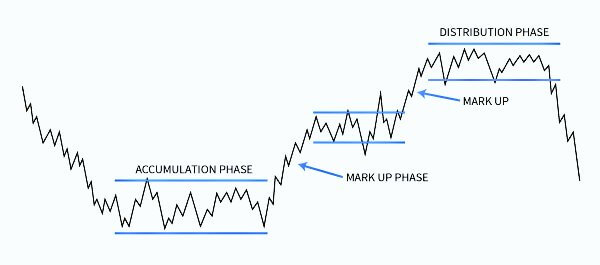
The accumulation phase usually comes right after a heavy sell-off. A heavy sell-off leaves many market participants disappointed and without faith in any uptrend. Stock prices may have fallen sharply to rock-bottom valuations, but buyers still hesitate for fear of another sell-off. This is when the “smart money” enters the market.
Smart money usually refers to institutional investors who take a long-term view and deploy large amounts of capital. They are always looking for value investments available after heavy sell-offs. Institutional investors start buying shares regularly, in large quantities, over a long period. This is what creates an accumulation phase. It also means that sellers trying to sell during accumulation easily find buyers, so prices stop falling. An accumulation phase therefore always marks the market bottom. This is how support levels are created. Accumulation can last several months or even longer.
Once institutional investors (the smart money) have accumulated enough shares, they make trades that push price up from the support zone in the short term. This often coincides with a gradual improvement in the company’s business. These factors tend to combine to lift the stock price higher. This is called the mark-up phase. During mark-up, stock prices usually rise sharply in a short time on heavy volume. The clearest sign of the mark-up phase is the speed at which the stock rises, because the price surge happens quickly and most investors who missed the earlier advance start to get in at this point.
Eventually, when stock prices reach new highs (a 52-week high or an all-time high), everyone around you is talking about the stock market. News reports are optimistic, the market is suddenly buzzing and every investor wants in. This is when the distribution phase takes place.
The institutional investors – the smart money that got in early during accumulation – begin to sell their shares gradually. The public absorbs all the volume the institutions distribute, giving them the price support they need. The distribution phase has price characteristics similar to the accumulation phase. Whenever price tries to rise during distribution, the smart money sells to reduce its holdings. Over time, this repeats many times, creating a resistance level.
Finally, once the institutions have sold all their holdings, supply completely overwhelms demand and there is no longer any large buying to support the price. What follows the distribution phase is therefore a heavy market sell-off, accompanied by fear and disappointment.
Once a three-phase cycle is complete, the sell-off is followed by a new round of accumulation, and the cycle repeats. Dow’s research suggested that the whole cycle from accumulation to sell-off can last several years.
It is important to note that no two market cycles are exactly alike. Sometimes the market moves from accumulation to distribution over many years. For some other stocks, however, the same move from accumulation to distribution can happen within a few months.
Technical Analysis Course – CMT Level 1
Green Chart designed this course specifically for candidates in Vietnam who want to study and prepare for the CMT Level I exam. The programme includes 27 sessions of theory, practice questions and mock exams. Students also receive the course materials, question bank and mock exams free of charge, and can retake the course for free for life.
See full course details here.
Happy Trading !