Contents of this article

Risk is an indispensable consideration that comes before return in investing and financial trading. In this article, we classify risk according to its source. For traders, one person’s profit usually corresponds to someone else’s loss. More generally, when one group of traders keeps making profits, another group must keep making losses. The consistently profitable group, however, is usually a minority, while the consistently losing group is the majority.
The difference between the two groups lies in their understanding of risk and money management techniques. In his book The Disciplined Trader, author Mark Douglas said: “successful trading depends 80% on money management and 20% on the right investment strategy”.
Money management and related issues are based mainly on assessing risk. That is why understanding risk and its forms is so essential. And to see risk more clearly, you need to break it down into its basic types for analysis.
In the stock market, risk is usually understood as “the probability of losing money“, and that is exactly what you must accept when you buy a company’s shares, whether you like it or not. At a higher level, risk can be divided into two types: systematic risk and unsystematic risk. When you own a stock, you are automatically exposed to both types of risk.
What is unsystematic risk?
There are countless reasons why your stock might fall, but let me list a few: deteriorating business prospects, falling profitability, fraud by company management, and so on.
Most of these reasons have one thing in common: they are risks specific to a single company. For example, say you have $1,000 to invest. You decide to put all of it into Hoa Phat Group (HPG), the steelmaker. A few months later, HPG announces that its revenue has fallen because of problems at some of its plants (for instance). Clearly, HPG’s share price will fall too, which means you will lose part of your investment. However, this news does not affect the share prices of other steel companies in the industry, such as HSG, POM or NKG. Similarly, if HPG’s leadership commits fraud, HPG’s share price will fall, not those of its competitors. These risks clearly belong to this one company, not to companies in general.
A typical example in Vietnam that many of us will have heard of is Central Mining and Mineral Import-Export JSC and its MTM stock price manipulation case in 2016. The company’s Chairman of the Board and several members of management falsified the shareholder register, fabricated sales and joint-venture contracts, and faked VAT invoices, receipts and payment vouchers to deceive the authorities into registering it as a public company, and then listed MTM shares on the stock market.
In addition, the company opened 59 brokerage accounts to create fake supply and demand and manipulate the share price. When the fraud was uncovered, the main victims were MTM’s investors. Although the masterminds in management were punished under the law, the losses suffered by many investors were very significant and almost impossible to recover. Some simply gave up and accepted the loss. At the time, MTM was among the most actively traded stocks in the market, which shows how much damage the case did to investors.
In such cases, external factors play no part in the share price falling; instead, it is specific, internal factors at a single company (in MTM’s case, fraud by management). The risk of losing money because of factors like these is usually called “unsystematic risk“.
Unsystematic risk can be diversified away: instead of putting all your money into one company, you can “diversify” your portfolio across two or three different companies (ideally in different sectors and industries). When you diversify your investments, unsystematic risk falls significantly. Going back to the HPG example, imagine that instead of putting all your capital into HPG, you invest only $500 in HPG and the other $500 in dairy company Vinamilk (VNM). In this case, even if HPG falls (because of unsystematic risk), only half your investment is hit, because the other half is invested in a different company. In practice, instead of just two stocks as in the example, your portfolio might hold 5, 10 or even 20 stocks depending on your capital and risk appetite. The more stocks in your portfolio, the more diversified it is, and therefore the lower the unsystematic risk.
This leads to a very important question: how many stocks should a good portfolio hold for unsystematic risk to be fully diversified? Many studies have shown that holding up to 20 stocks achieves optimal diversification, and that holding more than 20 makes no significant difference.
The chart below will help you understand how diversification spreads out unsystematic risk:
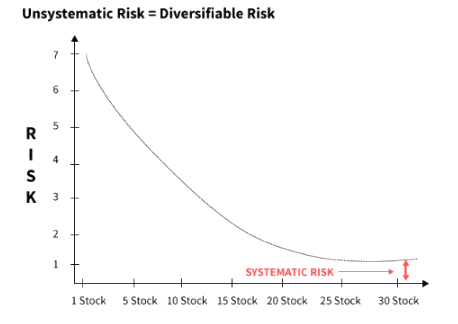
As you can see, unsystematic risk falls significantly as you diversify and hold more stocks. After about 20 stocks, however, there is little further diversification benefit, as the curve flattens out after the 20 mark.
There is, however, another type of risk that remains even after you have diversified your portfolio. It is called “systematic risk“.
What is systematic risk?
Systematic risk refers to the risk inherent in the entire market or a market segment. Systematic risk, also known as “undiversifiable risk”, “volatility” or “market risk”, affects the overall market rather than a single stock or industry, as unsystematic risk does.
Systematic risk is the risk common to all stocks in the market, arising from market-wide factors such as the macroeconomic situation, politics, geopolitical stability, the monetary framework and so on. Some specific types of systematic risk that can drag stock prices down include:
- Slowing GDP growth and rising inflation.
- Tight monetary policy and rising interest rates.
- Budget deficits and rising public debt.
- Political risk, war and epidemics.
- …
As with unsystematic risk, the list of systematic risks could go on, but I think the main points above give you an overview of what makes up this type of risk.
Systematic risk affects all stocks in the market. Suppose you have a portfolio of 20 stocks; when GDP falls, it will certainly affect all 20 stocks without distinction, so the prices of all the stocks in the portfolio will fall. Systematic risk is inherent and cannot be reduced by buying more stocks. Once again, remember that unsystematic risk can be diversified away, but systematic risk cannot.
Expected return
Let’s talk briefly about the concept of “expected return” before returning to the topic of risk. Everyone expects some return on their investments. The expected return is simply the return you expect from your investment. If you invest your money in Vinhomes shares and expect a 20% return over a year, that is the expected return on your investment.
Why does this figure matter when it sounds so ordinary? Because investors use it in many other calculations – for stock valuation and portfolio optimisation. Expecting a realistic return therefore plays an important role in portfolio management. Now let’s go through some basic ideas to understand this concept better.
Using the same example: if you invest $1,000 in HPG (for one year) and expect a 20% return, the expected return on your investment is 20%. But what if you invest $500 in HPG, again expecting 20%, and $500 in NKG, expecting 15%? What is the total expected return here? Is it 20%, 15% or some other number?
As you may have guessed, the expected return is certainly neither 20% nor 15%. Because we have invested in two stocks to form a portfolio, the expected return in this case is that of a portfolio, not of an individual asset. The expected return of a portfolio can be calculated with the following formula:
E(RP) = W1R1 + W2R2 + W3R3 + … + WnRn
Where:
E(RP) = expected return of the portfolio
W = investment weight
R = expected return of each individual asset
In the example above, $500 is invested in each stock, so each stock’s weight is 50%. The expected returns are 20% and 15% for the two investments. So:
E(RP) = 50% × 20% + 50% × 15%
= 10% + 7.5%
= 17.5%
Although this example has only two stocks, you can apply the formula to any number of assets of any type. It is a fairly simple formula, and the most important thing to understand is that expected return is not a “guaranteed” return; more precisely, it is only a probabilistic expectation of the investment’s return.
With an understanding of expected return, we can build quantitative concepts such as variance and covariance to measure portfolio risk more precisely. These are the two topics we will discuss in the next chapter of this series.
Happy Trading !
The “Stock Trading For A Living” Course
Green Chart designed this course to give students a solid foundation in fundamental analysis and stock valuation, and to show them how to integrate it effectively into their existing trading system, especially for traders who already use technical analysis. The programme includes five theory sessions and six months of hands-on trading practice in the real market with the lecturer.
See full course details here.