Contents of this article
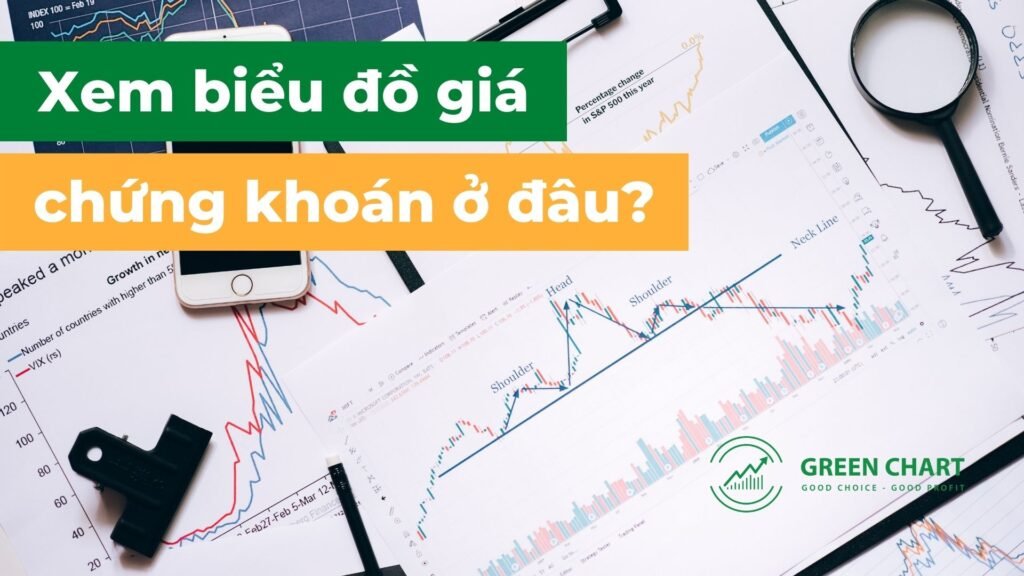
Before moving on to indicators and analysis techniques, we need to settle a very important step: where is the best place to view stock price charts?

Technical analysis uses price inputs (open, close, high and low) for each trading session, plus volume. One advantage of technical analysis is therefore that you can use it to analyse any asset, not just stocks. It is like learning to drive: once you can drive and have a licence, you can jump into any car, from a Mercedes to a Toyota or a Hyundai, and hit the road.
This is completely different from fundamental analysis. If you know how to read financial statements or value a business, for example, you can only apply those skills to stocks, not to forex or commodities. Technical analysis is different: you can apply simple moving averages, the RSI or the MACD to any chart of any asset.
The 3 assumptions of technical analysis
Unlike fundamental analysis, which judges whether a stock is overvalued or undervalued relative to its true intrinsic value, technical analysis is concerned only with a stock’s past prices in order to forecast its future trend. Technical analysis rests on the following assumptions:
Price reflects all market expectations: technical analysts hold that all information, whether public or inside information, is reflected in price. For example, a company’s chief accountant who knows in advance that this quarter’s profit has grown strongly buys the stock; this pushes the price up and may produce a technical buy signal.
Prices move in trends: all movements in the market follow a trend. For example, the VN-Index’s rise from 900 to 1,300 did not happen in a day; it was a nine-month advance. The trend is the foundation of every technical analysis theory built to this day.
History tends to repeat itself: this is because investors usually react the same way to the same event. For example, if a stock usually falls after three consecutive up sessions, the next time it rises three sessions in a row, investors will expect a fall and sell, and as a result the price really does fall.
From these three assumptions, we can draw the fundamental mindset for approaching technical analysis: “how” matters more than “why”. Technical analysts do not care why the chief accountant bought the stock; what they care about is how his buying will move the price.
How to read a price chart
As mentioned above, the four prices – open, close, high and low – are the inputs of technical indicators, with the closing price used most often. In the Vietnamese stock market, trading runs from 9:00 to 14:45 (on HOSE). The opening price is set in the ATO session from 9:00 to 9:15, and the closing price in the ATC session from 14:30 to 14:45. During the session, price moves up and down; the high is the highest level reached that session, and the low likewise.

The most popular (free) sources of price charts
TradingView (tradingview.com)

This international website is arguably the most popular, offering price charts for every traded asset class, including stocks. With its broad, up-to-date data, it lets you view charts of market indices not available on other free websites, such as VNMIDCAP, VNSMALLCAP and VNFIN. The downsides are that you can only view charts of stocks listed on HOSE, and the free version allows at most three technical indicators.
Fireant (Fireant.vn)
This website is quite user-friendly, being fully localised in Vietnamese, and it does not limit the number of technical indicators the way TradingView does. Fireant also provides plenty of other useful information, such as foreign investor and proprietary trading flows and the performance of each sector. The downside is that the free version does not show derivatives price charts.

Brokerage firms’ websites
Besides specialist websites, brokerage firms – depending on how well developed their platforms are – also provide price charts for their clients. For example, you can view charts of VN30 index futures on the website of MBS Securities.

Technical Analysis Course – CMT Level 1
Green Chart designed this course specifically for candidates in Vietnam who want to study and prepare for the CMT Level I exam. The programme includes 27 sessions of theory, practice questions and mock exams. Students also receive the course materials, question bank and mock exams free of charge, and can retake the course for free for life.
See full course details here.
Happy trading !