Contents of this article
- The cup
- The handle
- How to identify a Cup and Handle pattern
- Prior uptrend: 30% or more
- Cup height or depth: 15–30%
- The cup should last at least 7 weeks
- Key features of the handle
- How to trade the Cup and Handle pattern
- The ideal buy point
- Why you should not buy at the bottom of the cup
- The Cup and Handle often launches powerful advances
- Recognising failed Cup and Handle patterns
- The cup without a handle
- Limitations of the Cup and Handle pattern
- Technical Analysis Course – CMT Level 1

The Cup and Handle is a trend continuation chart pattern. It was developed by legendary investor William O’Neil and introduced in his 1988 book How to Make Money in Stocks.
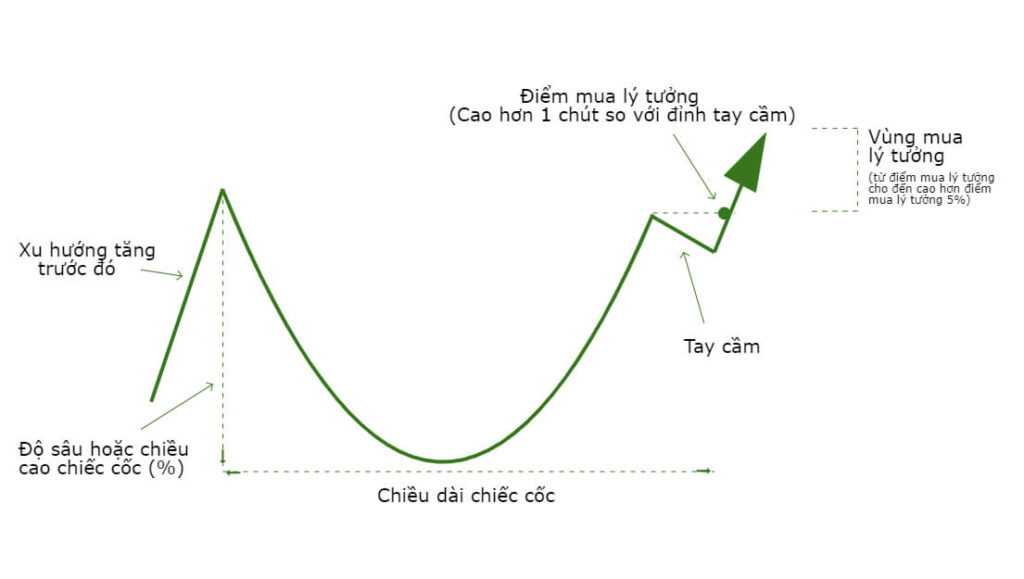
As the name suggests, the pattern has two parts: the cup and the handle. The “cup” forms after a prior advance and has a rounded, concave shape like the body of a cup. Once the cup has formed, a trading range develops on the right-hand side and forms the “handle”. A breakout from the handle’s trading range signals a rise in the stock price.
The cup
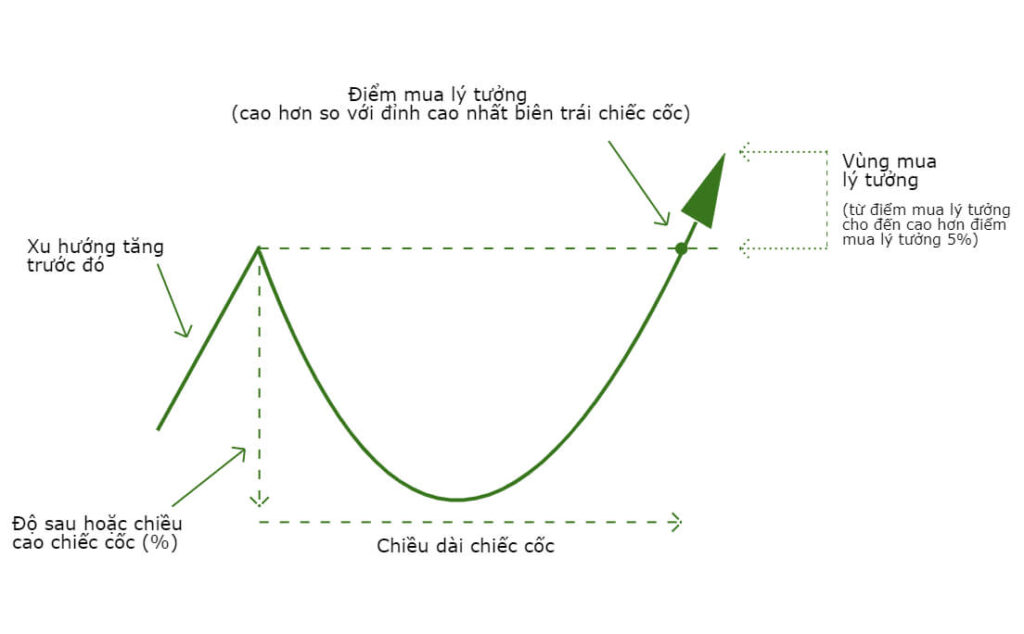
The cup looks like a cup, a bowl or any object with a rounded bottom, and forms after a prior uptrend (some approaches require that advance to be more than 30%). This stage can be seen as the perfect launch pad for a strong breakout once the handle is fully confirmed.
At first, price is in an uptrend and then begins to pull back, forming the left side of the cup. Price then bottoms out and turns up (forming the bottom of the cup) and continues rising to complete the right side of the cup.
The handle
Once the cup is in place, price makes a slight pullback, usually about one-third of the cup’s depth and no more than half of it.
After a consolidation of one to four weeks, price turns up and completes the handle. If price then keeps rising and breaks out above the upper edge of the handle, the Cup and Handle pattern is confirmed.
Sometimes the handle takes the form of a flag pattern, a rectangle or a wedge. In most cases, though, it looks like a short pullback within an uptrend. Winning stocks (big gainers) often begin a powerful advance by forming this pattern!
How to identify a Cup and Handle pattern
Prior uptrend: 30% or more
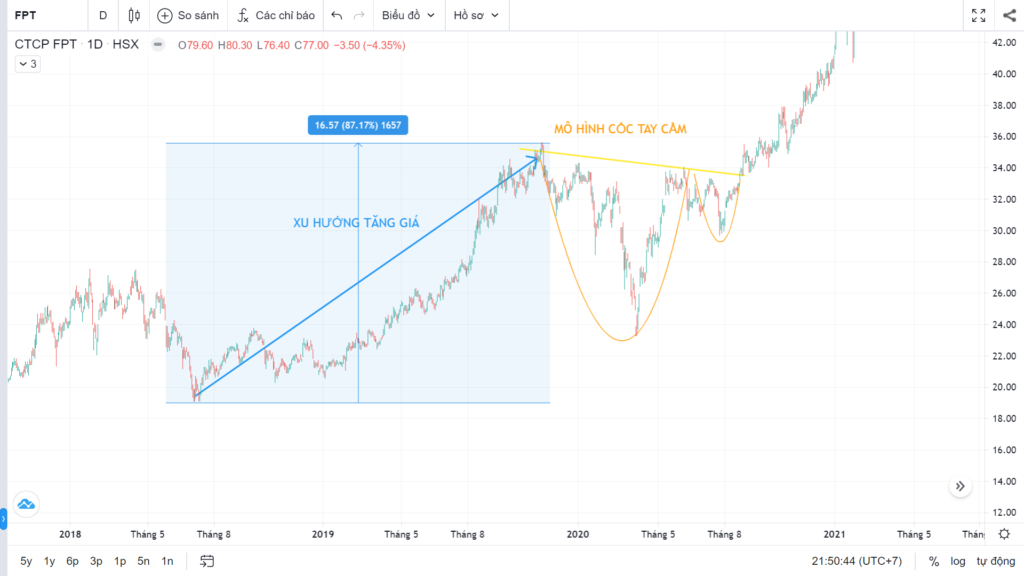
To form a proper “base” or pattern, there must be a prior uptrend. The idea behind the base is that after a fairly long advance, the stock now consolidates while waiting for a new leg up. The recommended advance from the low is 30% or more.
Cup height or depth: 15–30%
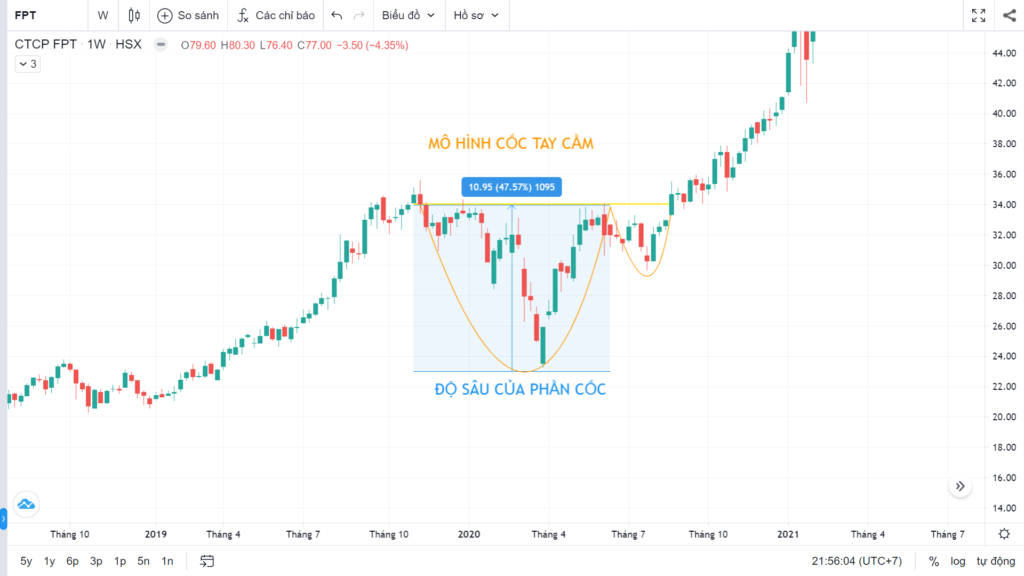
The height of the cup (measured from the peak on the left side of the cup down to the lowest low – the bottom of the cup) should be about 15% to 30%. In some severe bear markets, the cup can be as deep as 40–50%. As a general rule, look for stocks that hold their base well while the overall market is falling. So if some stocks on your watchlist fall 35% while others fall only 20% (a cup depth of just 20%), the stock that fell 20% is forming the stronger base.
The cup should last at least 7 weeks
*Note: the first down week, where the base begins, counts as week #1
The minimum length of a Cup and Handle is seven weeks, and some patterns last much longer, from several months to more than a year. Be wary of any pattern that looks like a Cup and Handle but lasts only a short time, such as under five weeks.

Key features of the handle
- Trading volume in the handle should be low
- The handle’s depth should be around 10–20%
- The handle should sit in the upper half of the cup
- The top of the handle should be within 15% of the highest peak on the left side of the cup
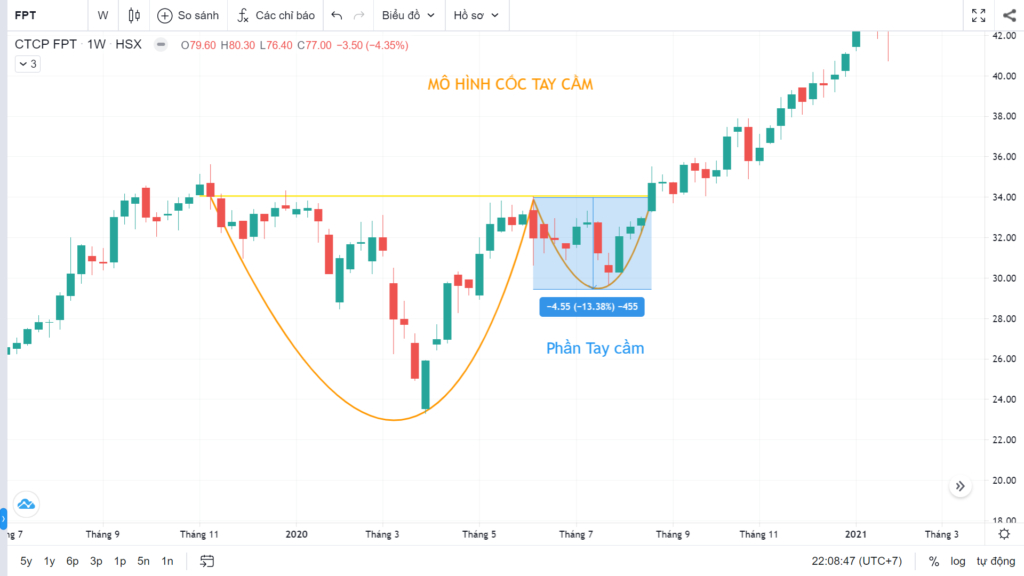
The handle should show a mild pullback on light volume. It is a good sign when the handle includes “shakeout” sessions that flush out weak holders who are not committed to holding the stock for the long term. A deep decline in the handle, for example more than 15% on heavy volume, may indicate strong selling pressure in the stock, making a big advance unlikely. Handles like that often lead to failed patterns.
Another important requirement is that the stock should be at or near its 52-week high before the breakout. This is a sign of trend strength and reminds us of the “great” paradox of the stock market:
- Stocks making new highs tend to go higher
- Stocks making new lows tend to keep making lower lows.
How to trade the Cup and Handle pattern
The ideal buy point
- Ideal buy point: when the breakout from the handle is confirmed.
- Ideal buy zone: no more than 5% above the breakout point.

Why you should not buy at the bottom of the cup
Once a stock has completed a Cup and Handle, it is easy to look back and say: “Oh, I would have made much more money if I had bought at the bottom of the cup.” But that is only true when you are standing at the completed pattern looking back. While the pattern is still forming, how can you know whether the stock has really bottomed?
If you try to buy before the pattern is complete, you are simply betting on an uncertain risk.
The Cup and Handle often launches powerful advances
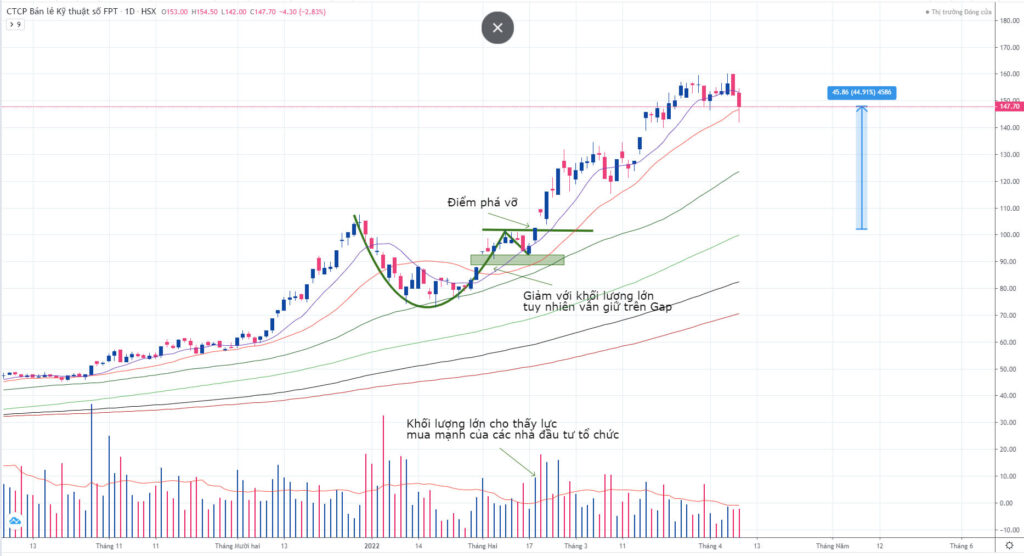
If a Cup and Handle forms and is confirmed, price tends to rise strongly in the short to intermediate term. Below are some examples of super stocks that made very strong advances from a Cup and Handle pattern.


Recognising failed Cup and Handle patterns
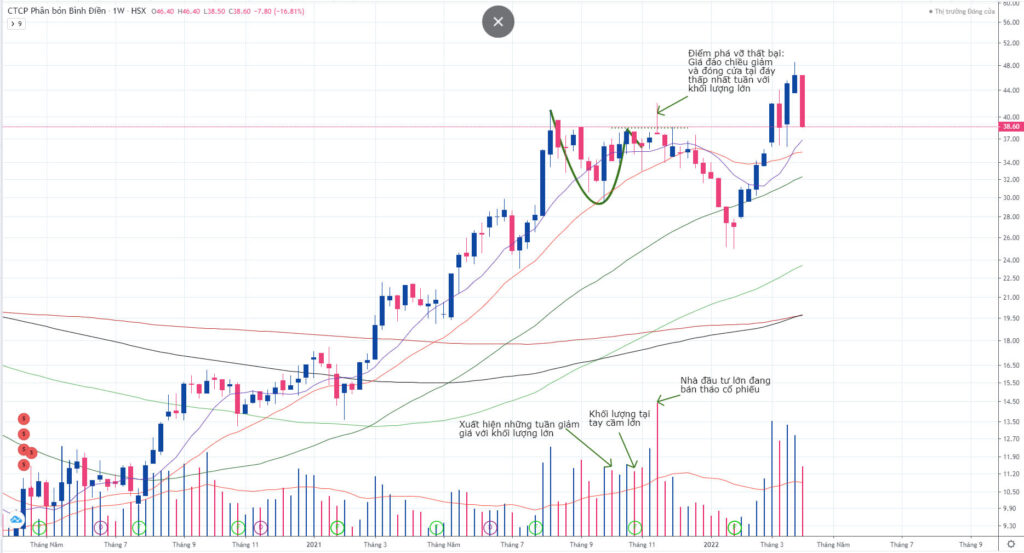
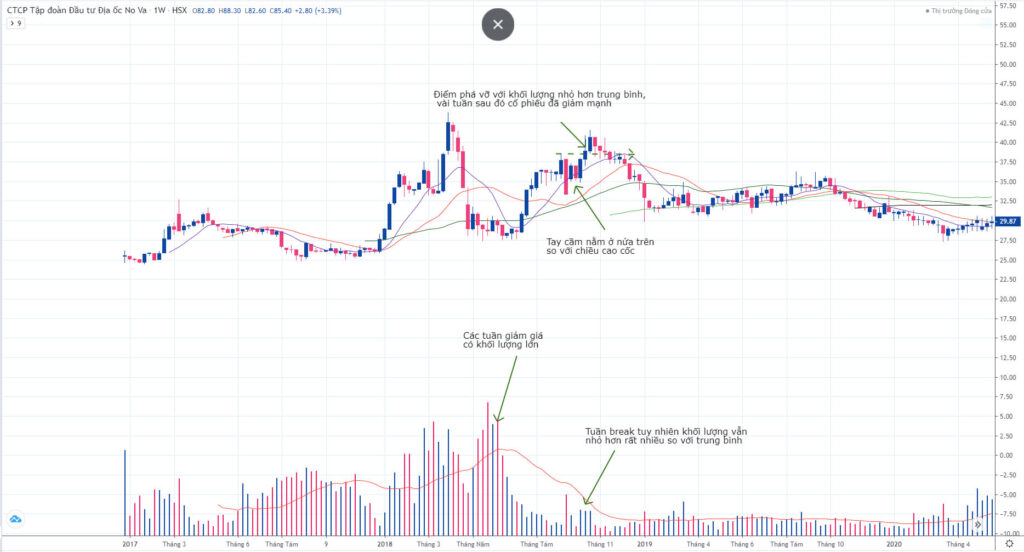
Sometimes the best way to know what is right is to know what is wrong.
Look at the following examples and see which features of a proper Cup and Handle they fail to meet. Learning to spot flaws will improve your stock-picking skills.
The cup without a handle
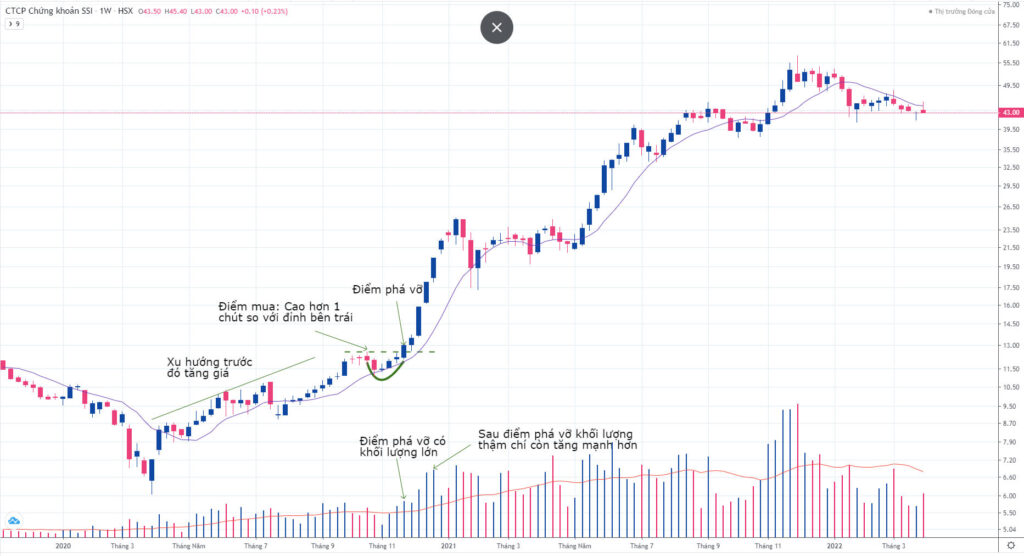
A cup without a handle can also be called a cup-shaped base, or simply a cup. It is a variation of the Cup and Handle pattern. As the name suggests, it is identical to the Cup and Handle except that it has no handle.
The next example shows how SSI formed a cup before rising 340% within 12 months.

Limitations of the Cup and Handle pattern
Like all technical tools, the Cup and Handle pattern should be used together with other price action signals and indicators before making a trading decision. More specifically, technical analysts have pointed out certain limitations of the Cup and Handle.
First, the pattern can take a long time to form completely, which may delay traders’ decisions and cost them a favourable entry price. Although one month to one year is the typical time for a Cup and Handle to form, such a wide range of lengths makes the pattern ambiguous to identify in some cases.
Another limitation is that the depth of the cup is hard to pin down with a fixed percentage rule.
In addition, the pattern can form without a distinct handle, which makes it difficult to identify a sensible buy point.
Finally, like many other chart patterns, the Cup and Handle may be unreliable for illiquid stocks.
Technical Analysis Course – CMT Level 1
Green Chart designed this course specifically for candidates in Vietnam who want to study and prepare for the CMT Level I exam. The programme includes 27 sessions of theory, practice questions and mock exams. Students also receive the course materials, question bank and mock exams free of charge, and can retake the course for free for life.
See full course details here.
Happy Trading !