Contents of this article

A price chart is a picture showing how price moves over time. A simple chart has two axes: the horizontal axis is time and the vertical axis is price. Each point on the chart tells us the price at the moment we are looking at.
There are three main types of price chart in use: the line chart, the bar chart and the Japanese candlestick chart. Of these, the last two are the most widely used.
The line chart
The line chart is the simplest type of chart, built by connecting the closing prices of successive trading sessions. For example, if you want to build a line chart of a stock over 60 trading sessions, you collect the 60 closing prices of 60 consecutive sessions and join them into a line, as shown below.
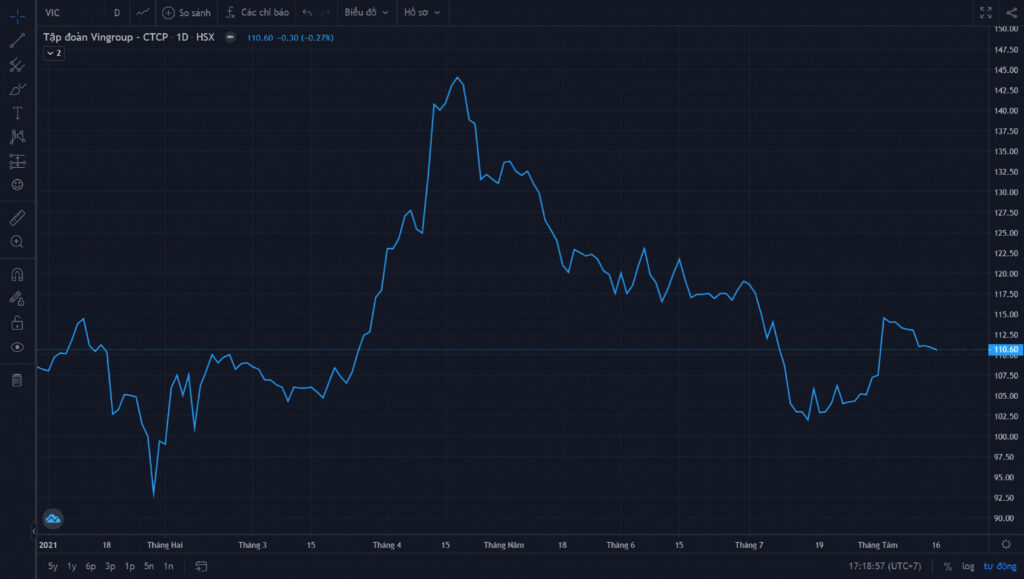
The line chart has the advantage of being very simple and easy to use. But precisely because it is so simple, it does not give complete information. For example, if a stock falls to VND 40,000 during a session before closing at VND 44,000, the line chart tells us nothing about that sharp 10% drop, even though it is a very significant price move.
One way to overcome this weakness is to use a line chart on a shorter timeframe: instead of one point per session, you can collect data once an hour to draw the chart, or even every 30 or 15 minutes. Such charts, however, are extremely noisy – compare the 1-hour line chart of VIC below with the daily chart above.
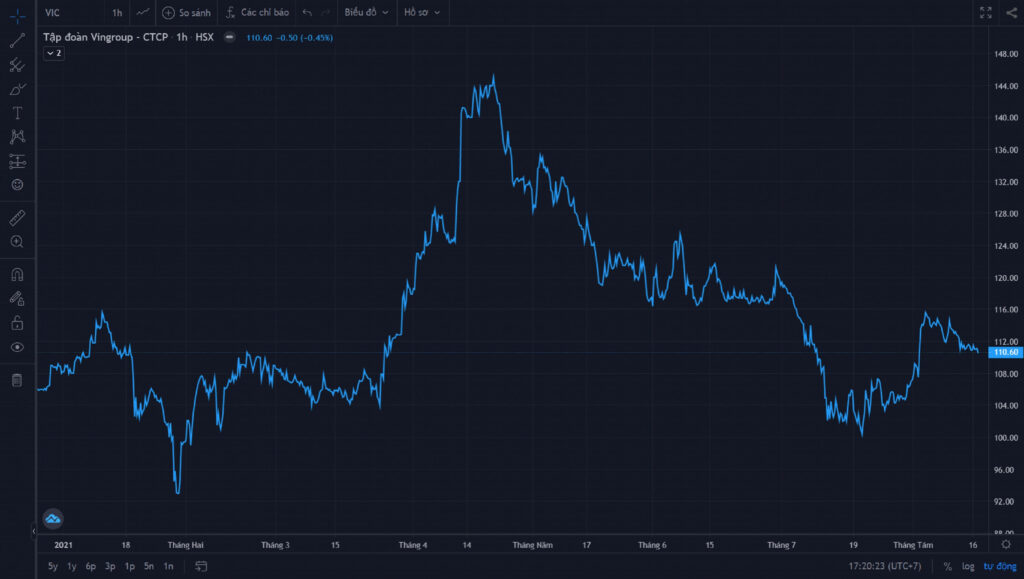
Line charts are therefore usually used only for illustration, for example in news bulletins. For technical analysis, we need bar charts or Japanese candlestick charts.
The bar chart
As you know, in each trading session we care about four prices: the open, close, high and low. A bar chart gives us all four of these prices for each session.
A bar has three parts: a vertical body and two horizontal ticks, one on the left and one on the right. The top and bottom of the vertical line show the high and the low, while the left tick shows the open and the right tick shows the close.
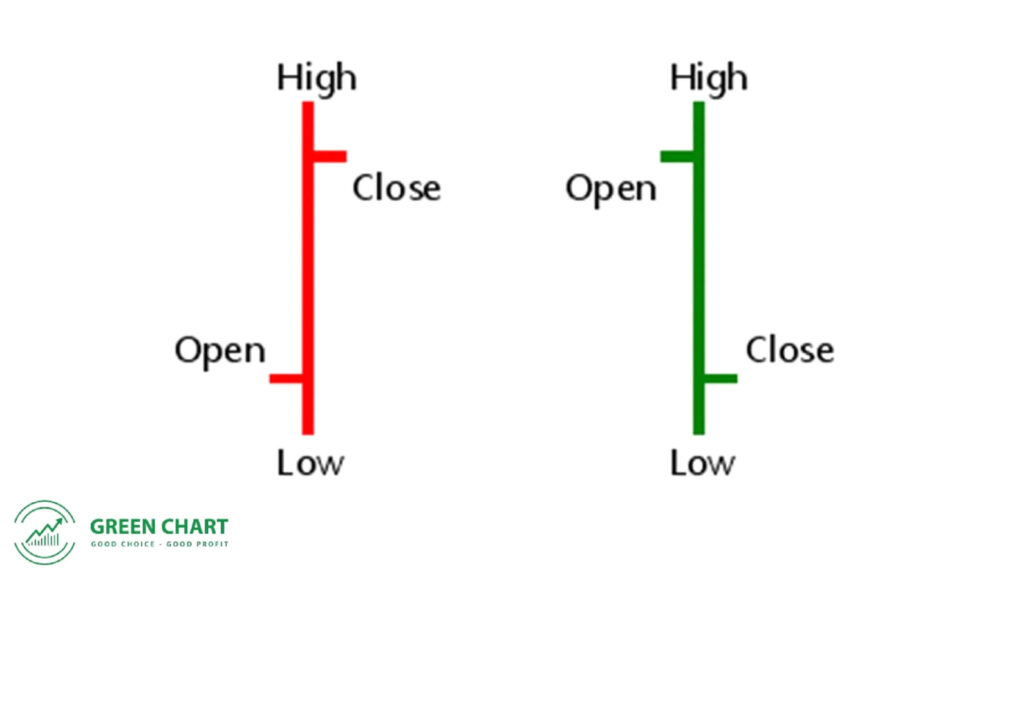
For easier reading, a bar is usually coloured green when the left tick is lower than the right tick, and red otherwise. This chart was very popular in the US and Europe until Japanese candlestick charts were introduced in the 1990s.
The Japanese candlestick chart
Like the bar chart, the candlestick chart provides the open, close, high and low. But Japanese candlestick charts are easier to read than bar charts, so they are used more widely.
A candlestick chart is made up of candles. Each candle has two main parts: the real body and the shadows (wicks). The lower shadow shows the lowest price of the session, while the upper shadow shows the highest. The real body comes in two colours to distinguish bullish from bearish candles, usually green and red. For a green candle, the bottom of the body is the open and the top is the close; for a red candle, it is the reverse.
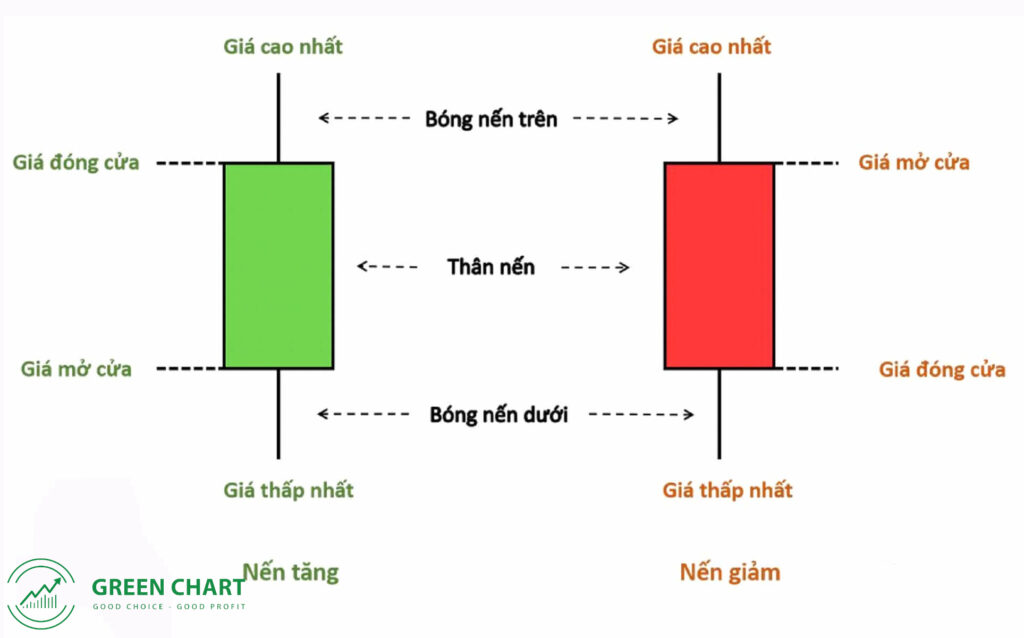
In what I have just described, I assumed a daily timeframe – one candle represents one trading day. However, we can use shorter timeframes (1 minute, 5 minutes, 15 minutes, 1 hour, …) or longer ones (1 week, 1 month, …). In that case, the open is the price at the start of the period and the close is the last price of the period.
The Japanese candlestick chart is the most popular chart today, because it provides complete information and shows price action very visually through the colour and length of the body and shadows. We will look at candlestick charts in more detail in the following articles.
Technical Analysis Course – CMT Level 1
Green Chart designed this course specifically for candidates in Vietnam who want to study and prepare for the CMT Level I exam. The programme includes 27 sessions of theory, practice questions and mock exams. Students also receive the course materials, question bank and mock exams free of charge, and can retake the course for free for life.
See full course details here.
Happy trading !