

Contents of this article
In this article we will focus on some of the statistical problems you run into when searching for alpha, and on how to recognise and deal with them.
Introduction
After many years of working, I have come to love statistics, because it is the one thing I have found to be free of fraud. Behind most of the problems I have met at work there was some story that wasn’t quite right, or some hidden agenda (mostly from rather powerful and very capable people). Statistics gradually went from being a tool to being my homie without my noticing, because it has one quality: I don’t think it lies! So when I see some recent (perhaps clickbait) articles with titles like “the deception of xxx…”, I’m not very interested, because in reality those are just statistical distortions caused by readers and analysts (mostly) getting things wrong. Numbers can lie, people can lie, organisations can lie… but statistics never lies!
This post is still about the market and backtesting to find alpha, but I will look more deeply at backtesting to unpack the common mistakes (with support from academic programmes and some tests in Vietnam) and tell them apart clearly.
Summary of results
Observing converging Sharpe ratios and the correlation between strategies helped us spot issues to watch out for when backtesting. Backtests and statistics do not “deceive” us; it is only we who are “stupid” (because of our biases) when we misread them and judge backtests by gut feeling in order to trade.
I. THE BACKTESTING AND SIMULATION PROCESS
Profits can come from personal observation, from reading research, or from plain luck. Alpha, however, needs a certain clarity (for example, evidence over some period in the past). Alpha is not a “holy grail” either; it decays over time for any given factor. There really is no “holy grail” at all (or maybe I just haven’t reached enlightenment), not even fundamentals, which many people worship. The best thing is to have a clear set of rules for analysis and execution to reduce irrationality.
When you have an idea for a potential alpha, the process for testing it is as follows:
- Data preprocessing: this step is not EDA; it is the filter for dirty data. Real data has many problems, such as non-standard OHLCV, dividends and splits, timestamp indices, units, missing data… —> All of this must be handled so the data is clean and consistent.
- Turning raw data into features (feature engineering): at this step, the factors that might create alpha can be plotted for a preliminary (visual) look to identify patterns and test them (signal analysis). In the CMT curriculum this step is called signal testing, and it is the most important one. Some of the quant research by the “high priest” Lopez de Prado also discusses causal factor investing in analysis (in practice it works very well).
- Modeling: these two parts form one step. Modeling creates strategies either as rules-based systems (if the user already has clear rules) or by using models that fit and predict on their own. The biggest advantage of rules-based strategies is that they are fast and do not need much data. The most important thing here is to build a skeleton flexible enough to switch between rules-based strategies and ML strategies, so the two can be combined when needed.
- Backtesting: backtesting checks how strategies would have worked in the past. Importantly, it must fit in-sample (IS) to train on the historical dataset and forecast out-of-sample (OOS) on new data. The problem is that with only one dataset, most people think of OOS as splitting it into two parts; more advanced approaches use walk-forward testing (WF) or, as Lopez suggests, Combinatorial Purged K-Fold (CPKF).
- After backtesting and finding the best strategies —> deploy them to the system for live trading.
II. BACKTESTING AND COMMON MISTAKES
Backtesting with more advanced methods such as CPKF or WF is still not enough, and they have the following limitations:
- CPKF is only useful for checking a strategy’s robustness; it is not a fully normative trading measure. It works by bootstrapping from historical data, and it cannot answer the key questions because the test sets are usually very small. Even if the data is large enough (very hard to obtain in Vietnam), computation is a problem, because CPKF runs very slowly in practice.
- Walk-forward testing is very useful in terms of realism, because it can fix a time window and fit historical data into it (much as an analyst compares a previous period’s figures with the current period), and its results are rolling, so the pieces can be stitched together to see how continuous it is over time. For example, the Sharpe ratio of a strategy over time, shown below:
A brief description of the strategy:
- Data: more than 1,600 stocks, filtered down to the most liquid group (x.xx%) that also have a trading signal. The data runs from 2020 to date (more than 1,500 days) and is filtered automatically on every trading day in this period to find signals. That means each time the universe changes, it selects 50–60 stocks to screen for signals (usually 4–5 tickers have signals), so the total number of choices could be 1,500*4 ~ 6,000 across the whole sample, ignoring overlaps.
- When trading, portfolio weights are rebalanced automatically (using HRP/Inverse Volatility/MeanRisk, depending on which model outperforms at each rebalancing) and market constraints are respected (T+2.5 settlement). Transaction costs are simulated with random slippage (of course still within the daily price limit of +/-7% for HSX and HNX or +/-15% for UPCoM) plus fixed costs for taxes and trading fees.
- This is a pure TA strategy with two basic moving averages, and its rules cover momentum and mean reversion. Momentum: price crosses above both MAs with volume confirmation —> MM buy signal. Mean reversion: price touches the fast MA while staying above the slow MA, with volume confirmation and a doji candle confirmation —> MR buy signal. The fitting principle is to fit the fast_ma window and slow_ma window so that the combination produces the signal with the highest Sharpe over a specific span (for example, 252 days). The windows to fit range from 10 to 50 for the fast MA and 80 to 150 for the slow_ma, in steps of 10, giving about 35 window combinations to fit to the data; combined with the 6,000 choices above, the optimal choices are selected from 35*1500*50 ~ 2,625,000 possibilities. The tickers also get portfolio weights to balance their risk, which is another overfitting filter for the strategies, and the optimiser automatically picks the best option.
- At this point everything looks pretty good: the backtest almost fully simulates real-world trading, with all the conditions needed to minimise risk and guard against overfitting. But is it really that good? Here are the results:
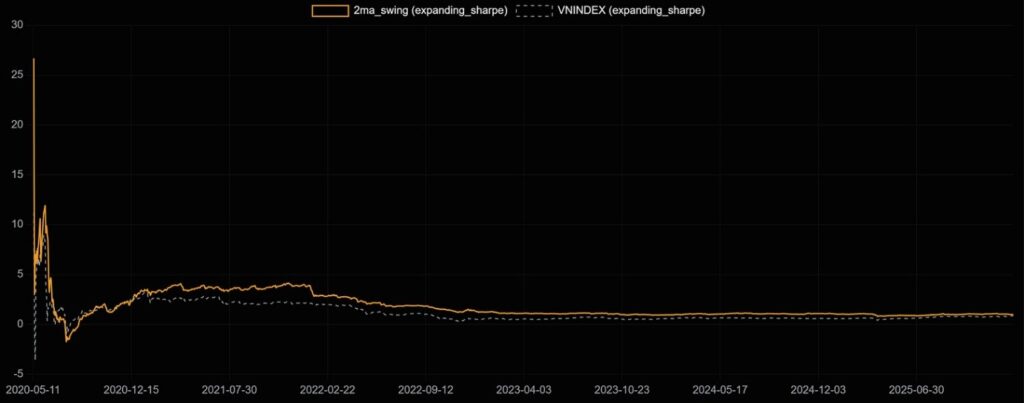
If we pick just one point in time, 2022, to evaluate it, its Sharpe ratio is clearly much higher than the VN-Index’s, and its performance looks very good indeed if we look at the OOS results:
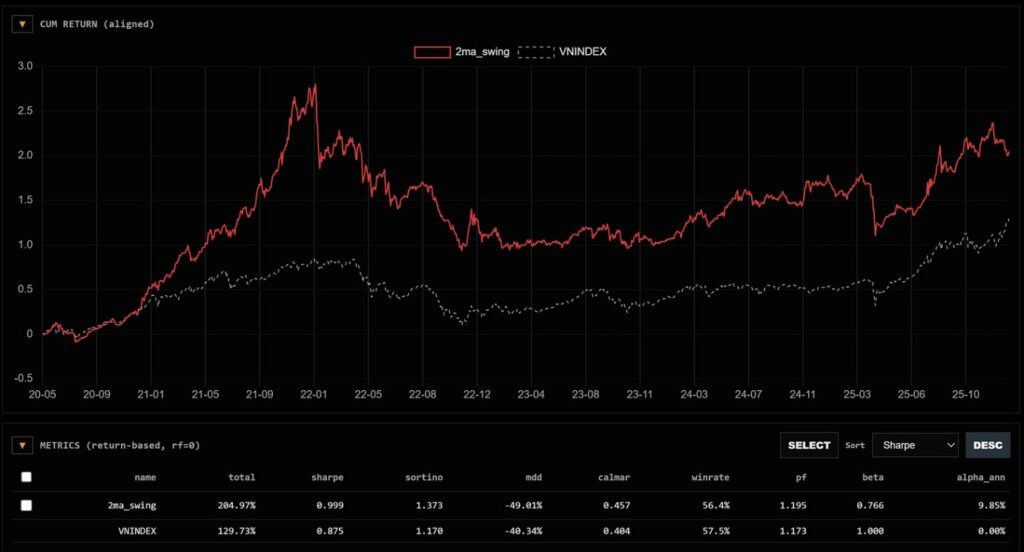
The strategy’s Sharpe ratio (SR) is 0.999, far ahead of the VN-Index to date. If I were impulsive, I would conclude it is great and run it live (then blow up the account and come back to blame the “deception of backtesting” =)))) —> This is a common and easy mistake to make.
In fact, looking at the SR curve over time, you can see it gradually converging on the VN-Index’s Sharpe ratio, which means that even just by eye, this SR is not reliable enough over time!
So what if we keep testing across other universes? A stable strategy should work well across most tickers, right? That sounds very reasonable. To test it, suppose we take the same ma_swing strategy above and run it with different filters; the results are as follows:
The equity curves of all the strategies look good compared with the index
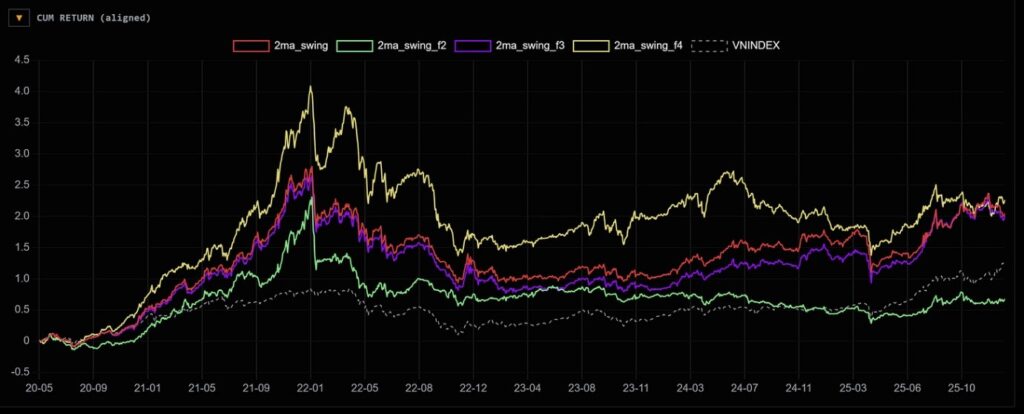
Performance also looks quite good: almost all of them are up 200% from 2020, and their Sharpe and Sortino ratios are far ahead of the VN-Index benchmark.
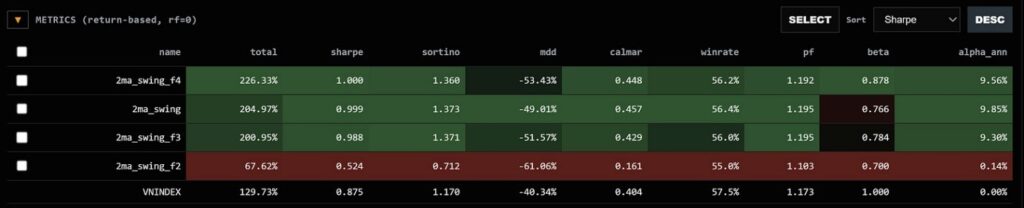
However, the strategies are highly correlated:
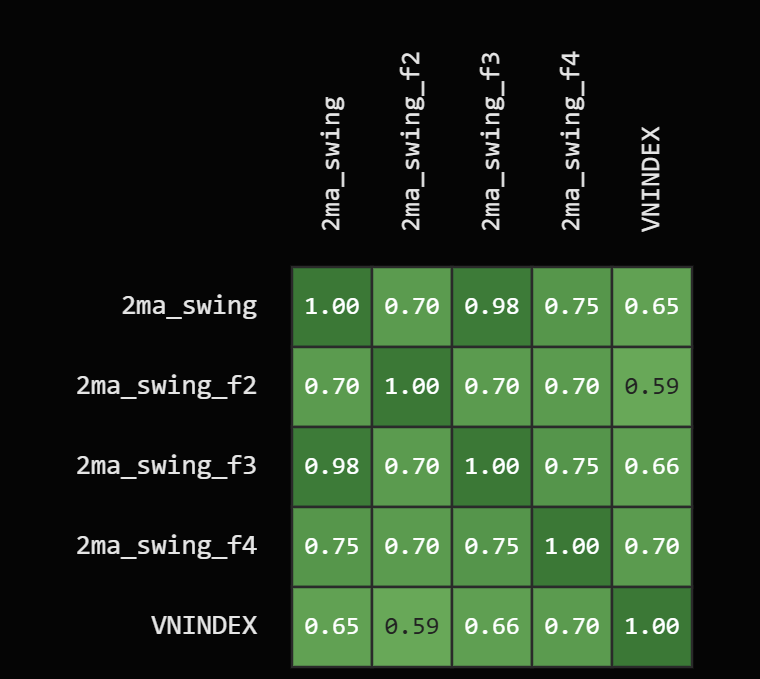
Averaging all the correlations between strategies in this correlation matrix gives ~0.81, which is very high; statisticians call this multicollinearity. It means that although these strategies use different filters, they are not meaningfully different because they are multicollinear.
This is simply because of the following issues:
- Latent factors across the whole market: the selected stocks are all still the same asset class, stocks —> they carry hidden risk factors related to the asset class as well as their own specific ones.
- Selection bias: although we think the filters can remove interrelated factors, the stocks’ past patterns do not change; all we are doing is cropping certain time windows across groups of stocks and stitching them together. Specifically, with 1,600 stocks there are exactly 1,600 paths that the stocks have travelled in the past, so the possible results are finite and very limited.
If you ignore these issues, it is very easy to fall into the trap called multiple-testing bias, also known as a Type I error in statistics (a Type II error is missing a strategy because it was misjudged; that is harder to see, so I will discuss it another time). What does this mean? Roughly, the more times we test on the same dataset, the more likely we are to reject the null hypothesis H0 and conclude that the strategy we found is alpha. But this is not alpha; we have been fooled by repetition on a single dataset. Some people call this survivorship bias; I think it is not entirely survivorship bias but should be called multiple-testing bias (false discovery from testing many times), because it is more general. This false discovery leads us to deploy ineffective strategies, or strategies that are overfitted because we tested too much.
So, observing converging Sharpe ratios and the correlation between strategies helped us spot issues to watch out for when backtesting. Backtests and statistics do not “deceive” us; it is only we who are “stupid” (because of our biases) when we misread them and judge backtests by gut feeling in order to trade.
So how do we identify alpha that can be deployed, once we have tested vertically (the depth of the strategy in guarding against overfitting) and horizontally (across many different filters)?
I’ll leave that for you to work out, because that will be your alpha.
Thank you, and best regards!
Technical Analysis Course – CMT Level 1
Green Chart designed this course specifically for candidates in Vietnam who want to study and prepare for the CMT Level I exam. The programme includes 27 sessions of theory, practice questions and mock exams. Students also receive the course textbook, question bank and mock exams free of charge for their exam preparation, and can retake the course for free for life.
See more details about the course here.