Contents of this article
This part analyses each factor from the standpoint of statistics and model selection. It also picks one sector (materials) to assess its level of efficiency.
Summary:
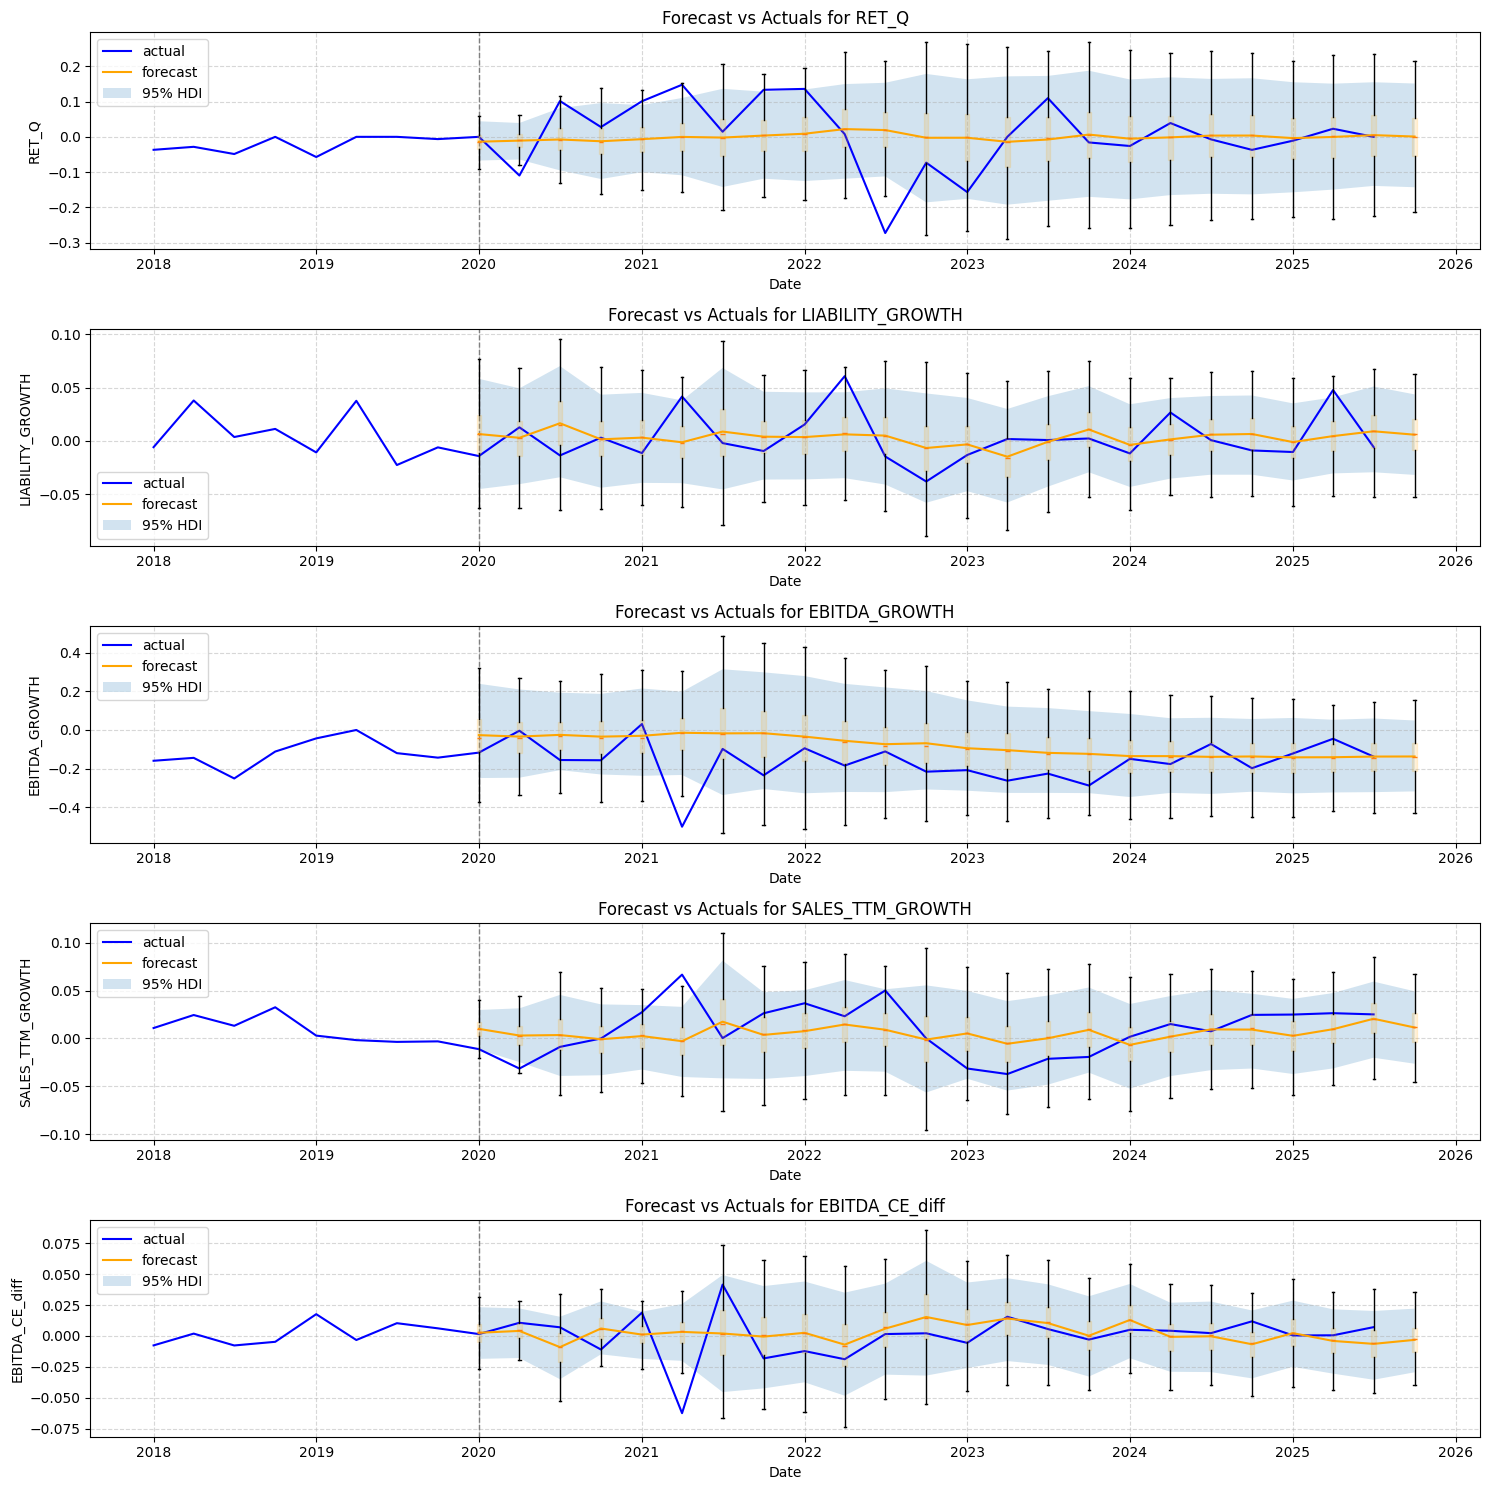
This is the forecast for one sector, materials. You can see there is only a single case, in mid-2022 (Q2), where price fell outside our forecast range. Going by falsification (as Karl Popper would), there were clearly times when the market was inefficient (specifically in 2022-Q2), but saying how efficient it is requires further testing (on lower timeframes).
INTRODUCTION
Imagine waking up one morning and being able to ask questions like:
- What is the probability that stock A rises by X%, and by how much?
- What is the probability that the market keeps rising today, as it did yesterday?
- …
These are very broad questions that some firms have recently used in their advertising – like a certain company F*** that keeps running ads on social media claiming to predict probabilities with AI or something like that. In reality, that is not forecasting but merely descriptive statistics: looking at the past to observe how often moves happened and estimating from that. If so, the estimated probability distribution has already been influenced by this “known” information. From exactly this idea, the great mathematician Thomas Bayes gave us the concept of conditional probability, which is what I will try to dig into in this part.
This concept actually has many applications. One of them is NLP (natural language processing) and, further on, some later LLMs such as transformers, GPT and so on. However, I think equating the NLP processing of LLMs or SLMs with using Bayesian methods properly is a mistake, simply because the two have very different goals. One uses Bayesian statistics to produce natural language that best matches the patterns users trained it on (and those patterns differ from financial patterns). In fact, if you look at ChatGPT’s training data, there is far more general material than finance, so for specific tasks like forecasting or analysis ChatGPT currently operates only at a “surface” level – broad, but lacking depth.
If we assume the market has some degree of efficiency, meaning all information in the market is reflected in price, then the model must be universal: almost all past price information, and even information such as financial statements, should be representable or computable from the model!
To estimate more accurately, my models must be able to learn all (or as much as possible) of the past information in order to forecast the price or price range one step ahead. The model I will use this time is Bayesian.
Interestingly, this model originated in physics and is used quite a lot to calculate rocket probabilities, specifically the probability of a failed rocket launch (perhaps the first-generation quants were often recruited from there =]]).
THE ONE-SIDEDNESS OF TRADITIONAL METHODS
With traditional valuation methods it is very hard to be objective when examining the relationships between variables, for the following reasons:
- If we use peer ratios for comparison, for example comparing a metric such as EBITDA margin across stocks in a sector, or a stock’s own EBITDA margin over time, we will be biased by a single number (perhaps the mean or median). This can be called point-estimate bias, and it is the fatal weakness of the frequentists.
- If a Beta coefficient expresses the relationship between an explanatory variable and a dependent variable, that Beta is a point estimate (usually an MLE, maximum likelihood estimate, in regression models such as AR). In reality, Beta also has its own distribution (for example, Beta fluctuates around some MLE value), so the final estimate will vary significantly.
- Traditional Excel models, and even traditional econometrics, still miss one big element: the prior distribution (prior). So they lack objectivity from the very way they estimate statistically. What is this prior distribution? It is an abstract statistical concept: there exists an initial probability distribution for the statistical data used in the model, and this distribution is called the prior (think of it simply as the ancestor). So statistical results must take this prior into account, or estimate it, in order to generalise. The probability distribution of the estimates given this prior is called the posterior probability distribution.
That said, Excel still has its value, especially for explaining things. A good Excel financial model helps users explain the reasons (from a bottom-up perspective) behind a company’s financial position. Excel can also generalise forecast scenarios by picking a few key drivers and running a sensitivity analysis, which looks like this table (example).

This is a two-way simulation. From it you can do a “rough” analysis of the risk or price expectations based on a few key factors. It is usually used more for negotiation than for forecasting, which is why there is often a large gap between valuation and market value.
With more than two drivers, a valuation only produces a single specific value, and the relationships among past factors cannot be described in a general way. For example, suppose company ABC’s EBITDA margin ranges from 20% to 50%, and ABC buys raw materials from company XYZ, whose EBITDA margin is only 20–25%. Clearly XYZ’s EBITDA margin is related to ABC’s (because it determines the raw-material cost before XYZ sells to ABC). If you run two Excel models for XYZ and ABC, how can you assess how much the two companies’ EBITDA margins affect each other?
Bayesian statistics solves this, as in the following chart:
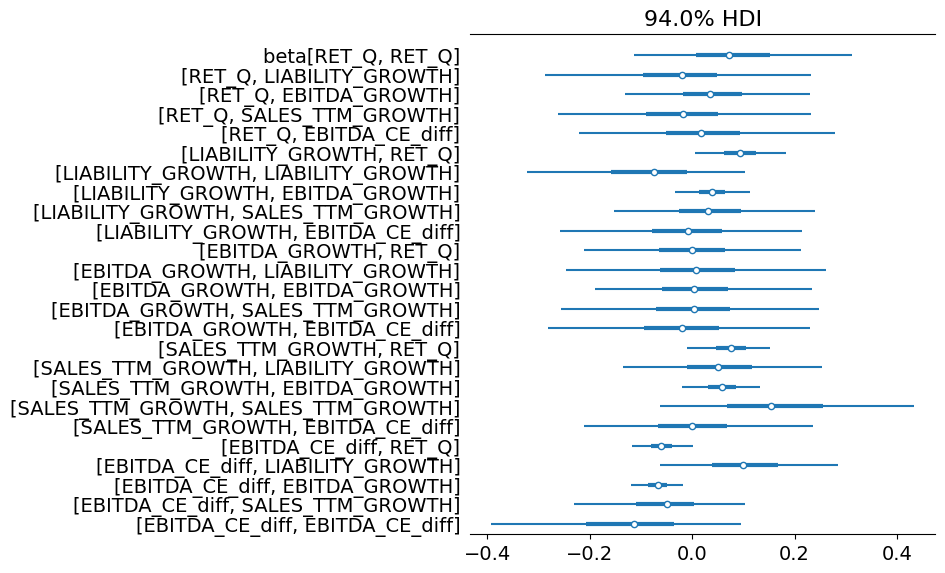
This is the distribution of the regression coefficients (betas) for each variable in the BVAR model I plan to run; HDI is the 94% credible interval. The key difference is that these regression coefficients have distributions (instead of MLE point estimates), and different combinations of coefficients produce different forecast values. These forecasts form a distribution, and only then can we draw conclusions in probabilistic terms.
At this point we need a more general view, and fortunately scientists have an information-analysis tool for this: Mutual Information.
MUTUAL INFORMATION ANALYSIS
To evaluate and select variables for estimation scientifically, I need a statistical method, and here I use mutual information.
What is mutual information?
Mutual Information can be thought of as a measure of uncertainty (entropy) in the information shared between two different things. The higher the MI, the stronger the relationship is likely to be, and MI can also capture non-linear relationships. For example, look at %NPL and the stock price change one quarter later:
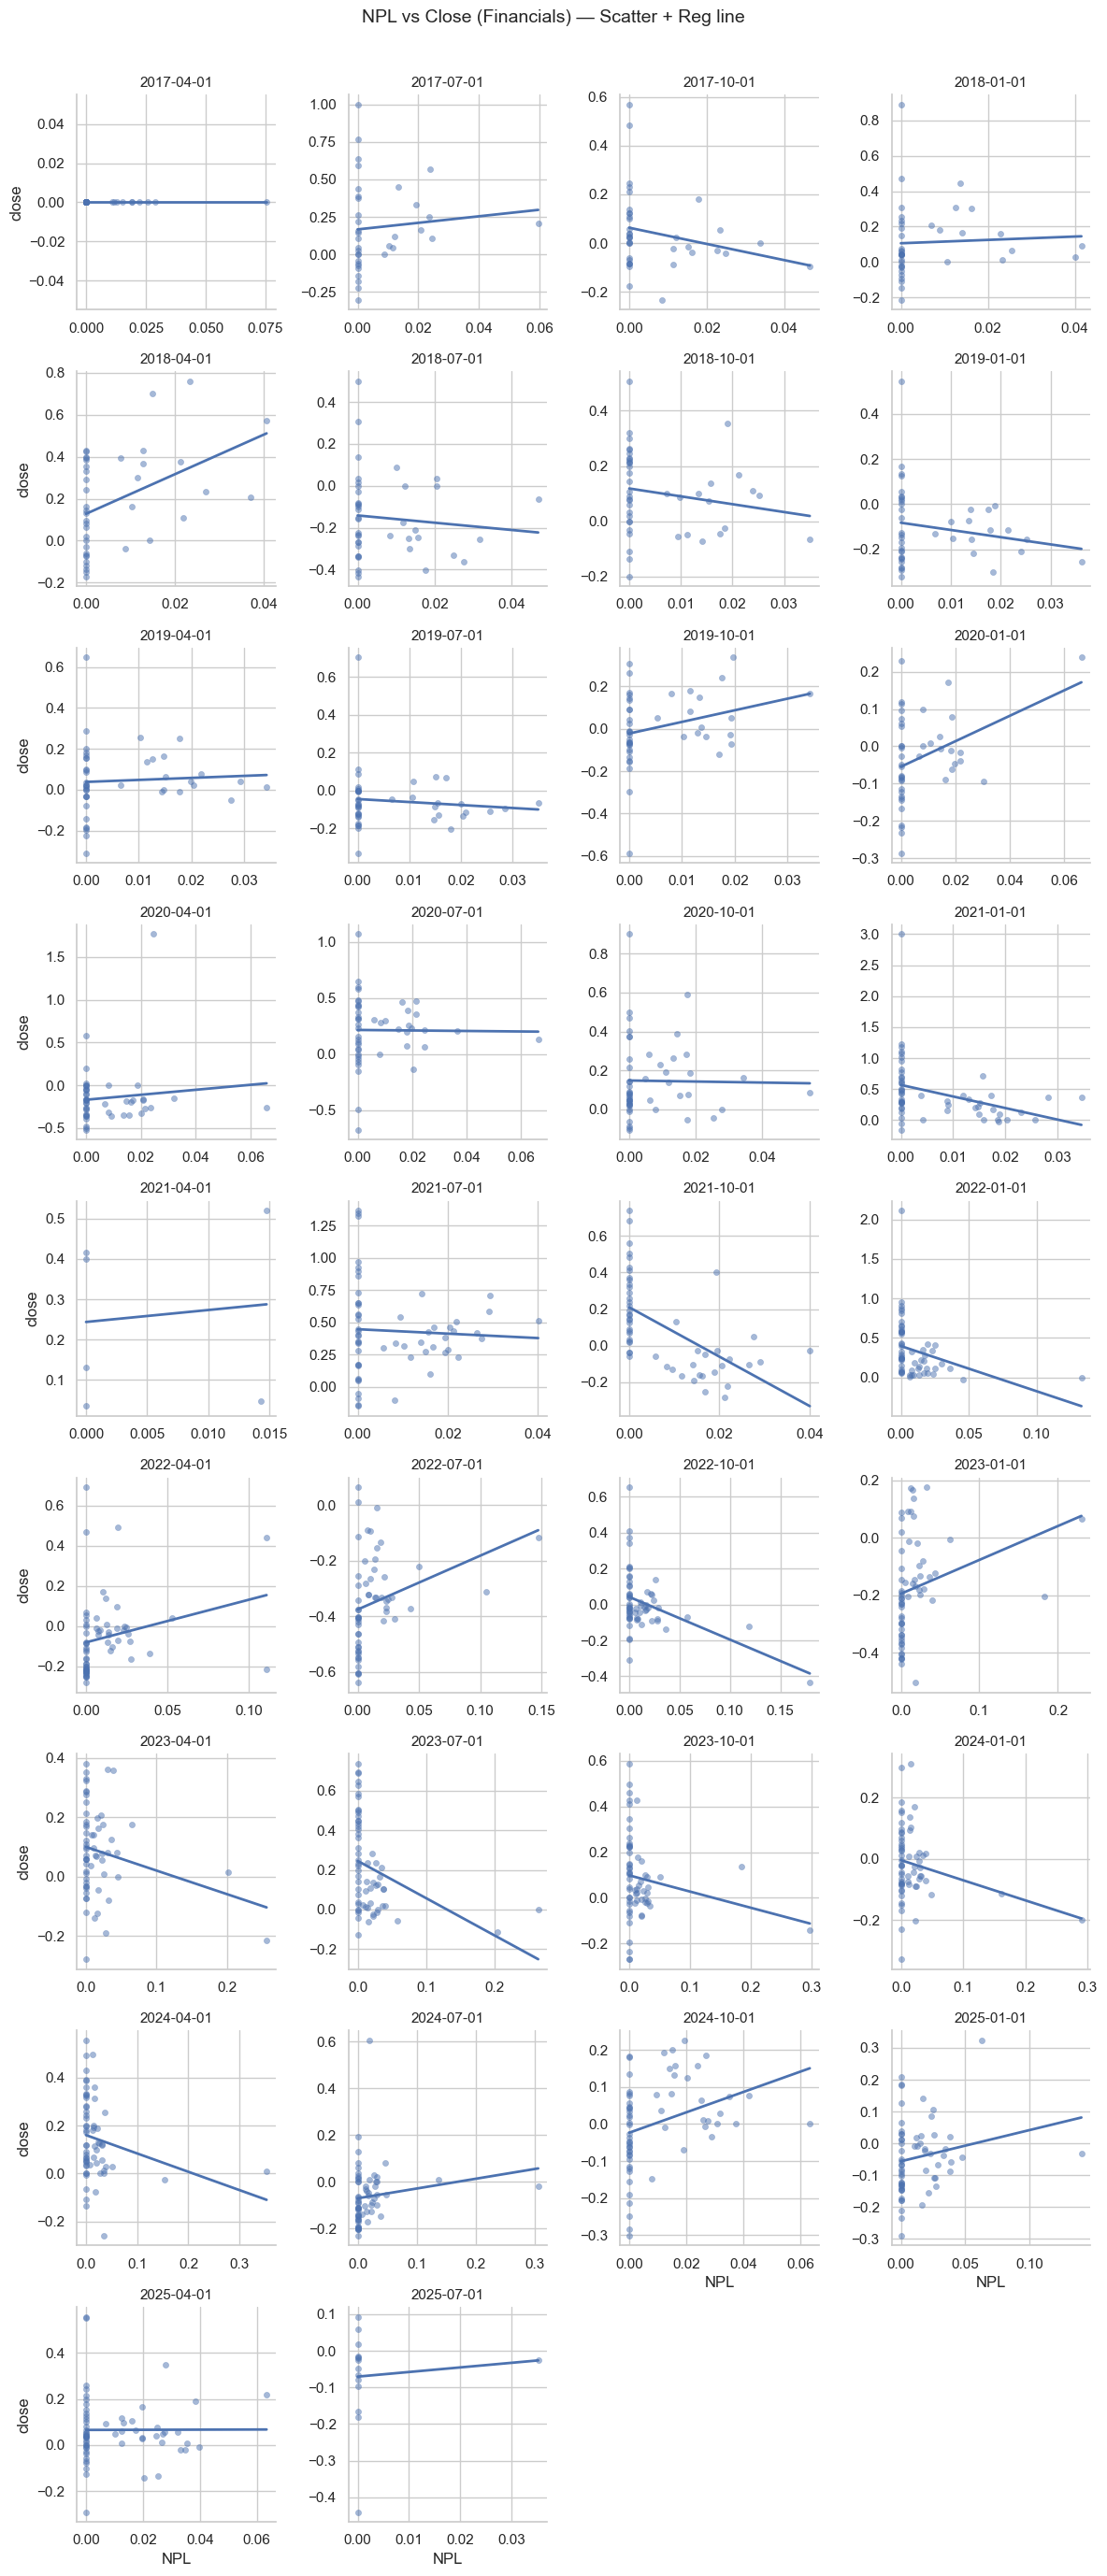
In some periods there is clearly a relationship between NPL and the stock price one quarter later, but not in every quarter. To see things more clearly, I will measure MI across sectors and against the fundamental variables briefly analysed in previous posts, to filter out suitable variables before feeding them into the model for deeper analysis.
For details of the MI formula you can search Google for a more complete picture; I have left it out of this post because it is fairly long.
Comparing MI across sectors
The figure below is a similar but condensed version of the table above, cross-analysing sectors against the (stock) returns of the whole market: I take one sector’s return this quarter and assess how much it affects the whole market’s return next quarter, to see which has the biggest influence.
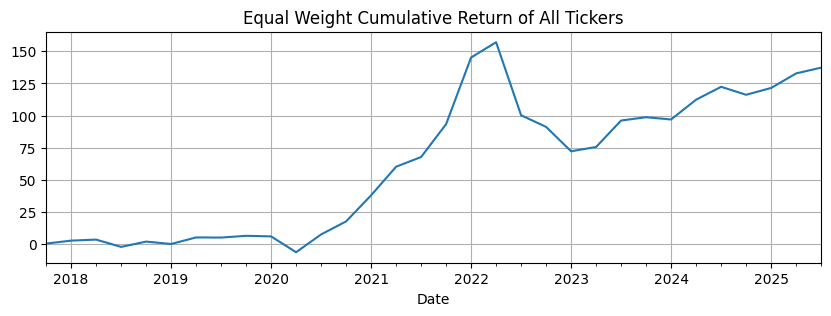
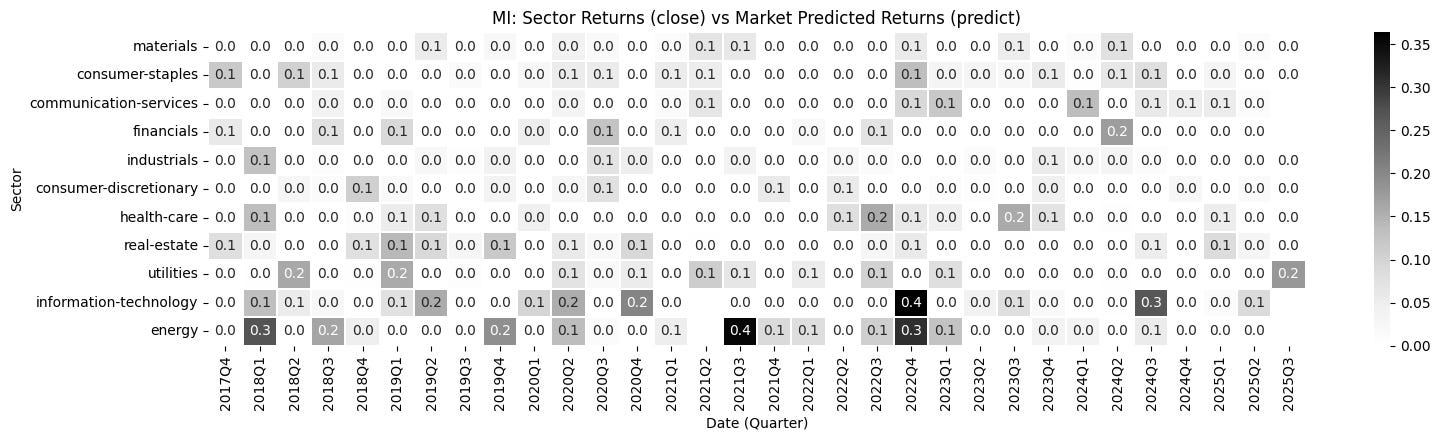
You can see that MI shows the influence of certain sectors standing out at certain times. For example:
- Energy: tends to have strong predictive power at times when the market is at extremes.
- IT: has had a fairly steady influence from 2020 to date, and at times has been the most influential sector despite having only 17 tickers! This is very interesting, because most people assume banks and real estate explain the most (given their large market capitalisation). But if you take the returns of the 17 IT tickers in one quarter and measure their relationship with the whole market’s returns in the next quarter, they sometimes show the strongest relationship (so could the insight at that time be that investors viewed IT only as an outperforming sector?)!
Clearly, sectors are interrelated with the whole market at the next point in time —> a model that can represent the interrelationships between sectors is preferred (to avoid losing information).
However, there are times when sectors do not explain much of the market. Could that be due to the momentum of the (stock) returns at that time? That is, at those times price can be predicted by historical prices (autoregressive) —> a model also needs an autoregressive component so that it can forecast from past prices.
These two factors point to VAR as the most feasible model for estimation. I will analyse this model in the next section; first I will continue looking at fundamental factors to select suitable variables.
Comparing MI of sectors with fundamental variables
In the previous post I discussed Credit Suisse’s HOLT framework for evaluating factors from a fundamental perspective. More specifically, I will classify the metrics that represent each factor as follows:
- Momentum (factors that reflect a company’s ability to keep growing and developing): profit growth measures such as EBITDA growth, Sales growth, NPAT growth
- Valuation (return on total capital invested; its inverse can be thought of as an adjusted EV/EBITDA): EBITDA_CE (EBITDA/Capital Employed)
- Quality (asset quality based on the structure of asset growth and debt growth): Liability_growth, equity_growth, asset_growth, %NPLs
Note: these measures may contain latent factors; for example, EBITDA/CE also measures quality, and asset growth also acts as momentum for real estate or banks.
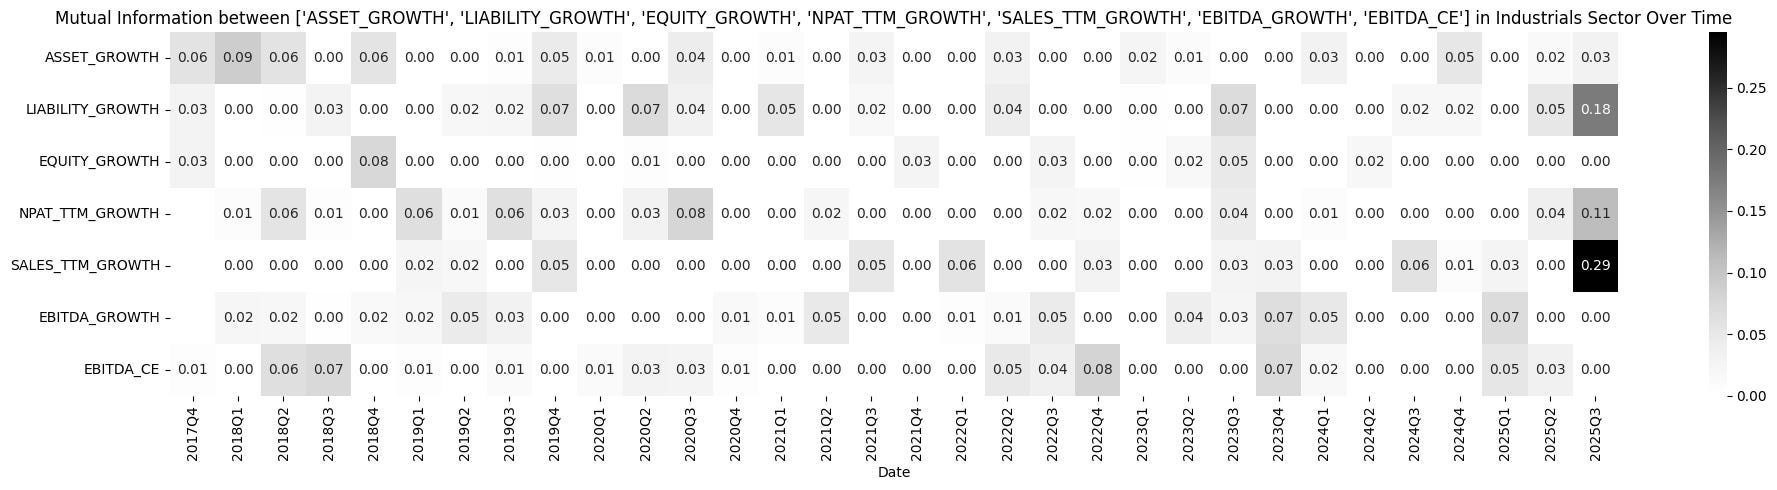
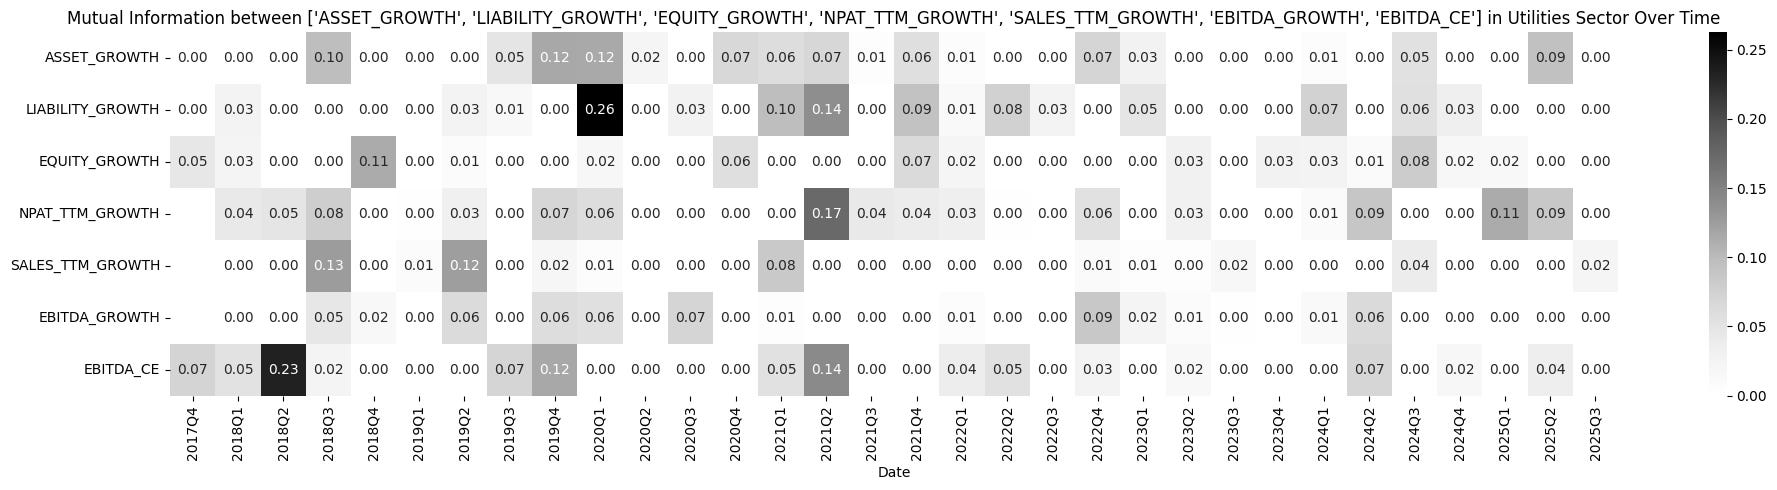
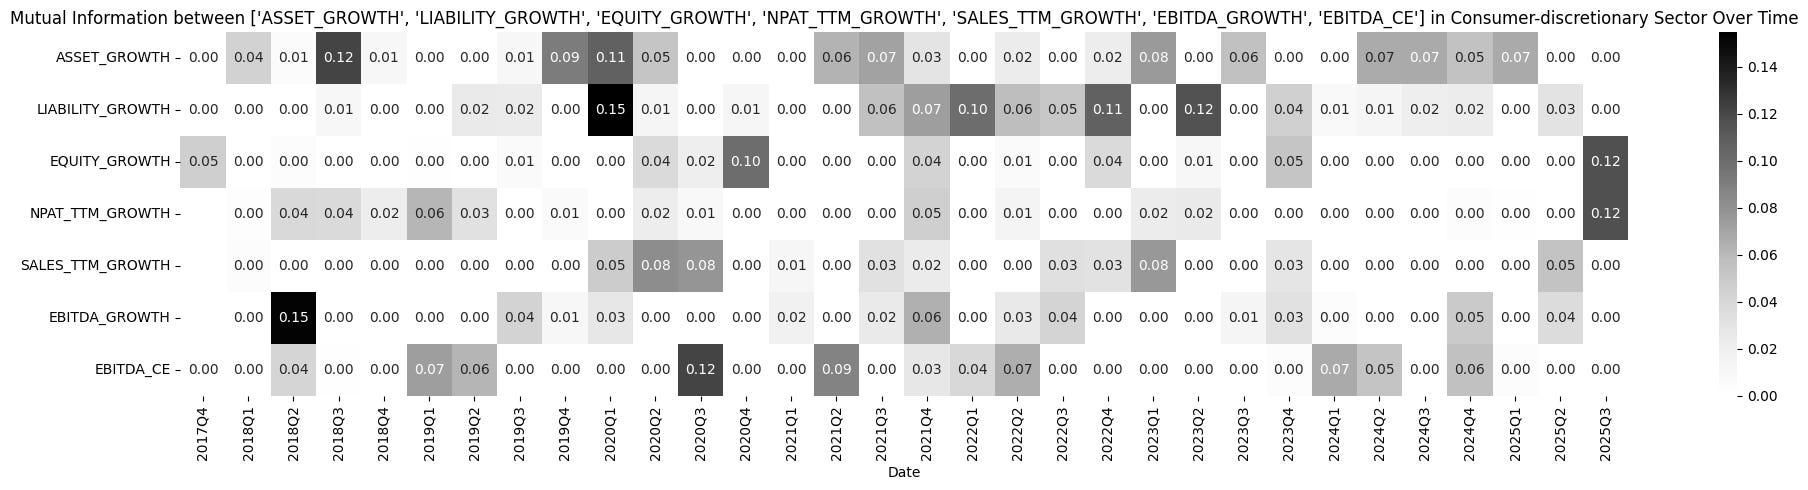
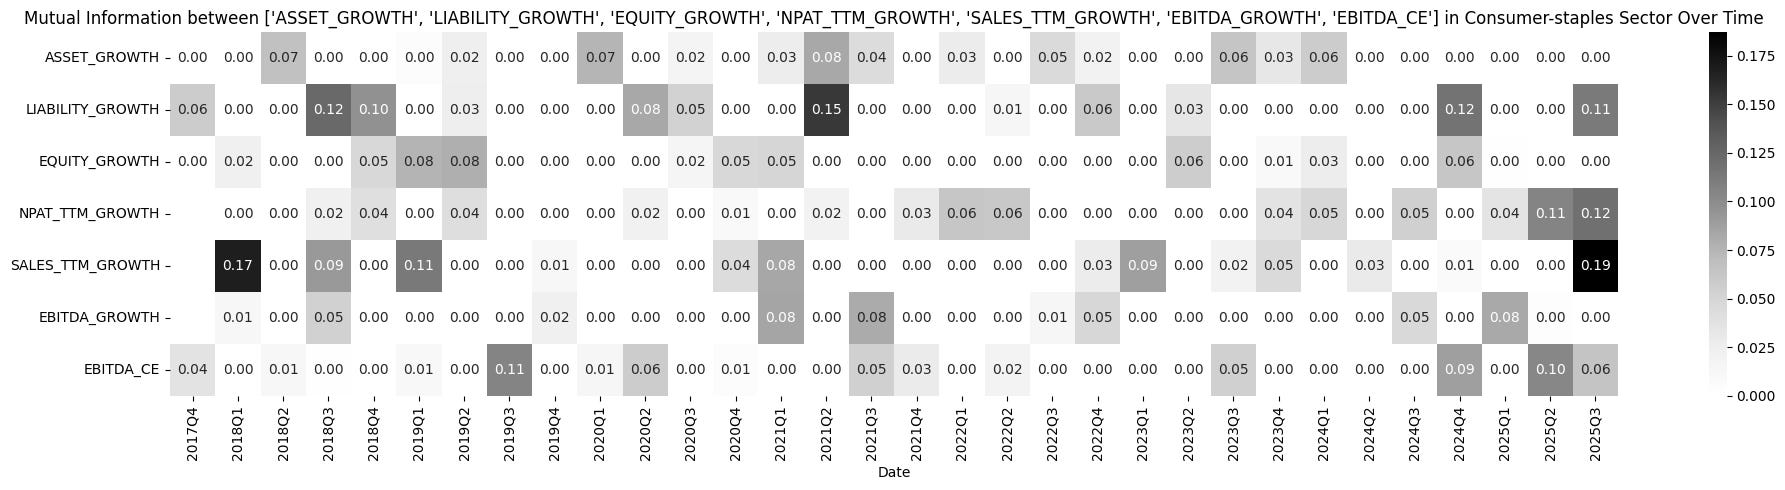
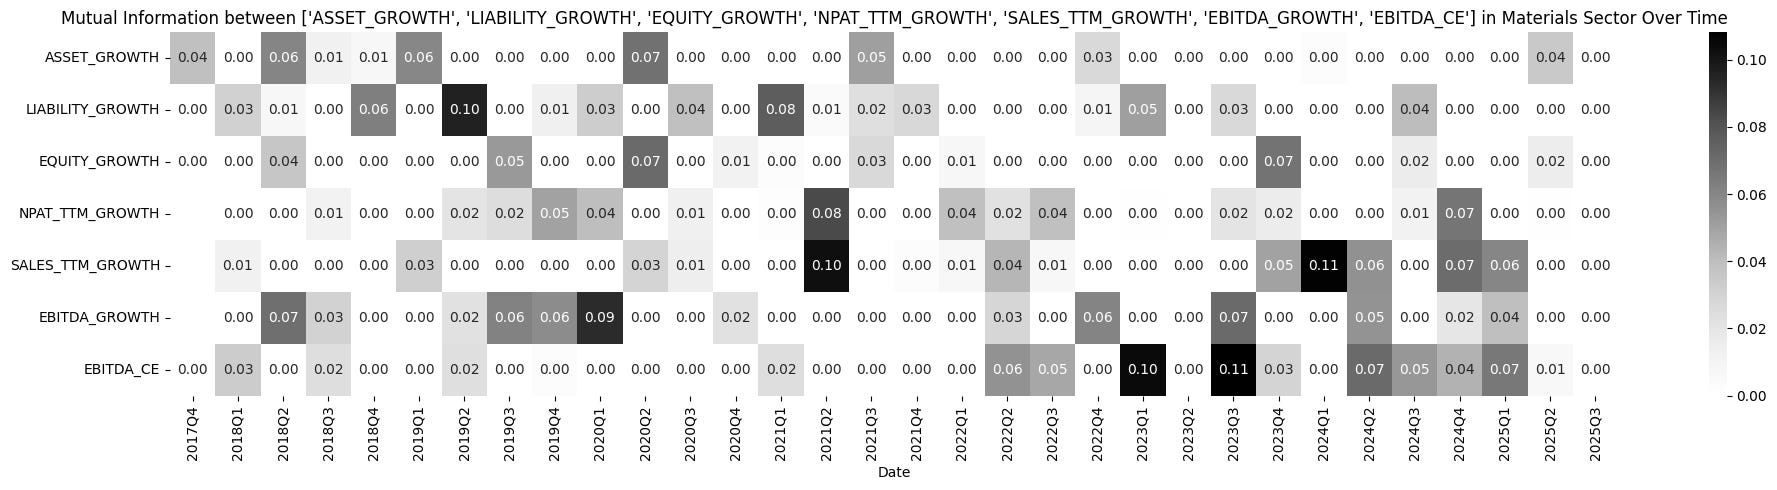
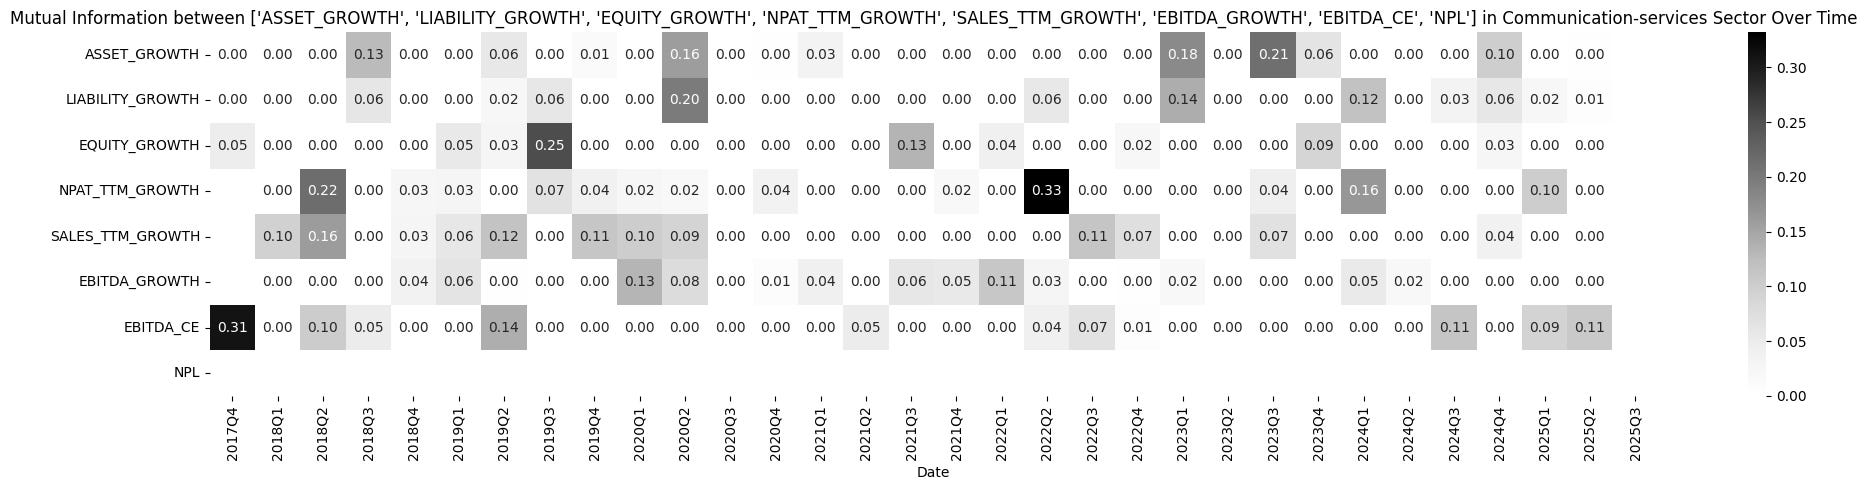
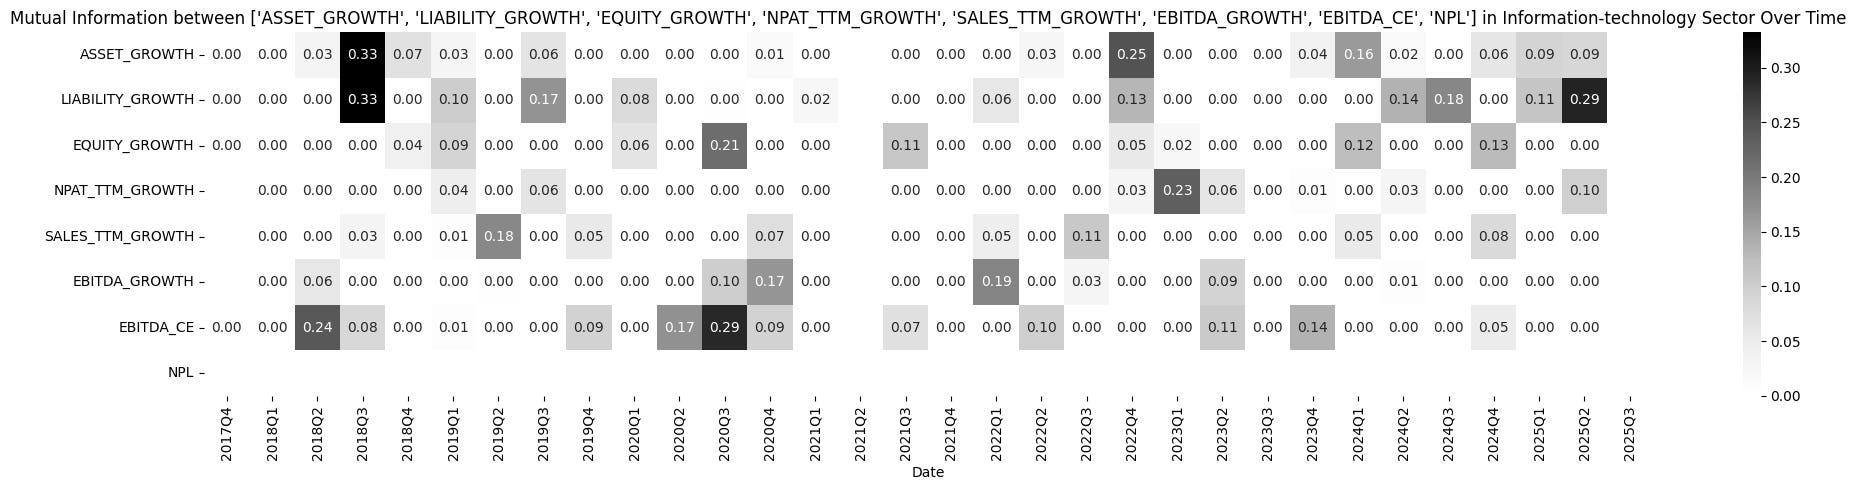
However, only by measuring (with MI) can we see how closely market prices are related to these factors, as follows:
Method: I rank the mean MI values and take the four variables with the highest means
Industrials: LIABILITY_GROWTH, SALES_TTM_GROWTH, NPAT_TTM_GROWTH, EBITDA_CE
Utilities: NPAT_GROWTH, EBITDA_CE, LIABILITY_GROWTH, ASSET_GROWTH
Consumer-discretionary: ASSET_GROWTH, LIABILITY_GROWTH, EBITDA_CE, EBITDA_GROWTH
Consumer-staple: SALES_TTM_GROWTH, LIABILITY_GROWTH, ASSET_GROWTH, NPAT_GROWTH, EBITDA_CE
Materials: EBITDA_CE, EBITDA_GROWTH, SALES_TTM_GROWTH, LIABILITY_GROWTH, ASSET_GROWTH
Health-care: EBITDA_CE, LIABILITY_GROWTH, SALES_TTM_GROWTH, EBITDA_GROWTH
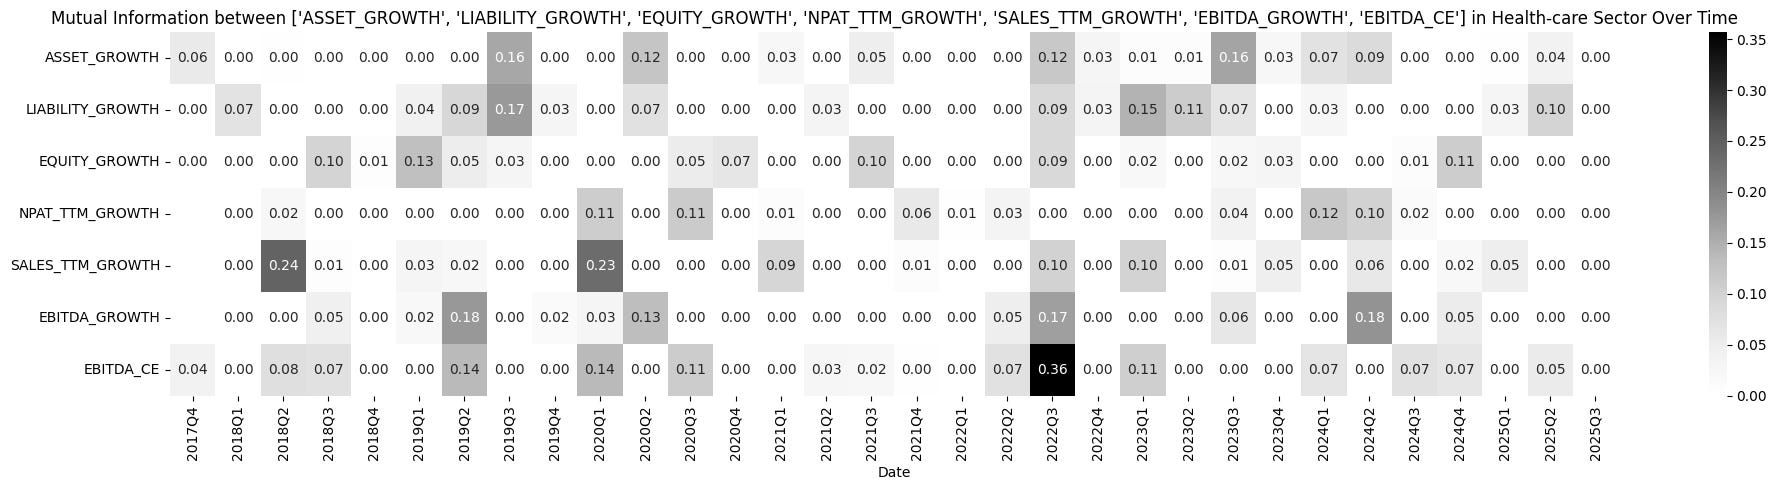
Real-estate: EBITDA_CE, SALES_TTM_GROWTH, ASSET_GROWTH, EQUITY_GROWTH
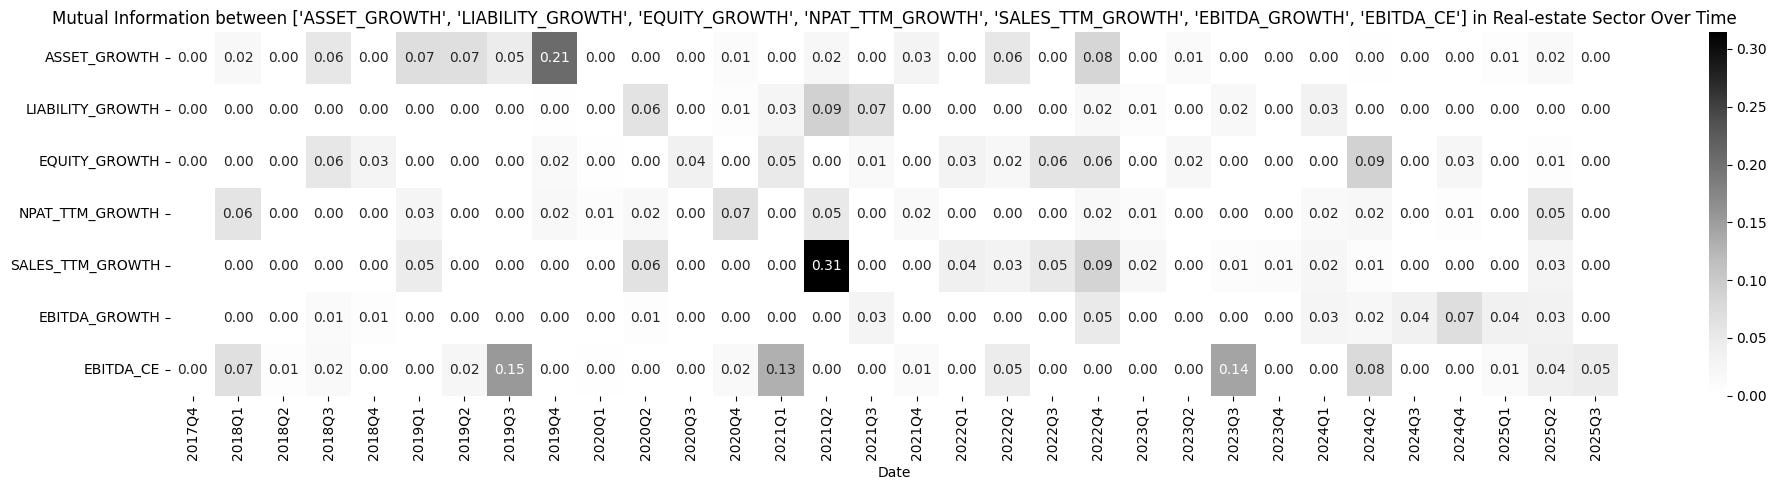
Financials: EBITDA_CE, LIABILITY_GROWTH, ASSET_GROWTH, NPAT_GROWTH
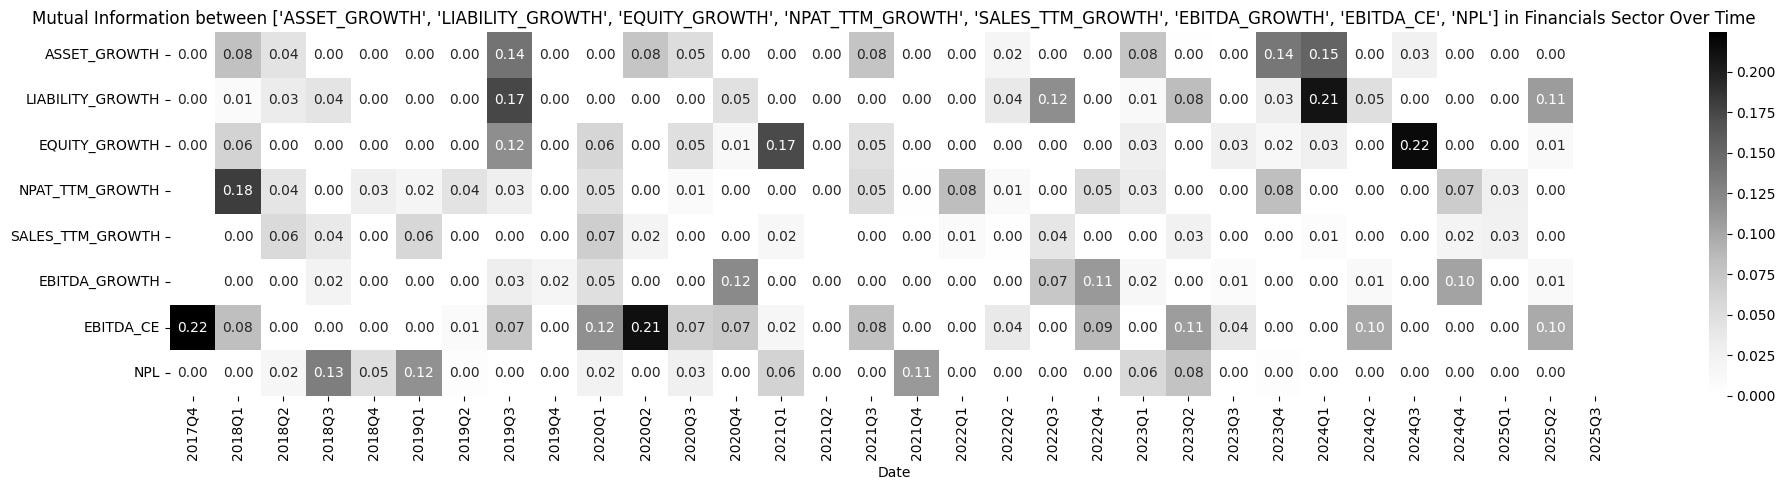
Energy: LIABILITY_GROWTH, ASSET_GROWTH, EBITDA_GROWTH, EBITDA_CE
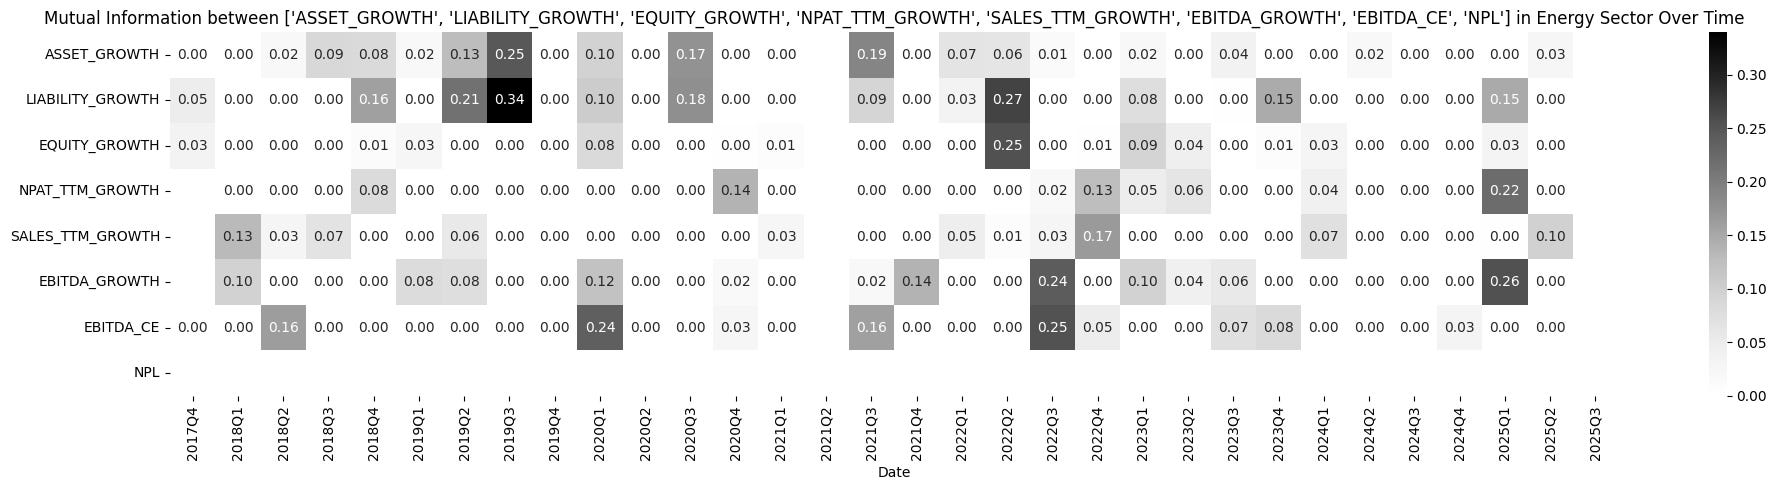
Communication services: NPAT_GROWTH, SALE_GROWTH, EBITDA_CE, ASSET_GROWTH
IT: LIABILITY_GROWTH, EBITDA_GROWTH, ASSET_GROWTH, EQUITY_GROWTH
THE VAR AND BVAR MODELS
If ARIMA is a model with three components – AR (autoregressive), MA (moving average) and Integration (stationarity) – then VAR is a combination of several AR models that are dynamic and explain one another. There are many variants, such as VARMA, VARIMAX and so on. Here, however, I am only interested in VAR and BVAR (Bayesian VAR). A VAR model looks like this:

This is VAR(1), meaning the AR terms have a lag of 1. You can see that x is explained both by its own lagged values and by other variables such as y and z.
This model is great because it can learn the past information of neighbouring variables that we believe affect it (in this case the ratios) —> The problem of looking around, raised in the previous post, is solved.
However, as mentioned at the start, the regression coefficients themselves (slopes or betas) have their own distributions. Note that these slopes are not estimated as simple averages, as we often think, but by a statistical method called MLE (maximum likelihood estimation). The plain VAR estimation we usually learn at university is called a frequentist model.
Here I need to extend VAR beyond plain VAR; in other words, I need to estimate it with Bayesian methods. A VAR model estimated with Bayesian methods is called BVAR, which lets the coefficients run over their distributions —> the forecasts are a set of results from these combinations of coefficients.
BVAR is very important if the model needs to be explainable. In particular, if you are an analyst or an economist, you need to explain how the factors exert their influence, rather than letting a model run without knowing what it does (a black box). Do not confuse this with AI agents (which are very popular right now) as if they were white-box models! At heart they are still black-box models, built on deep layers of classification algorithms (more specifically, tokenisation) and Bayesian methods (if you don’t believe me, look into it), and they explain things to you using the outputs of these algorithms and the tokens they were trained on. So AI agents produce good results when the task is summarising rather than explaining.
Long story short, a BVAR model looks like this chart:
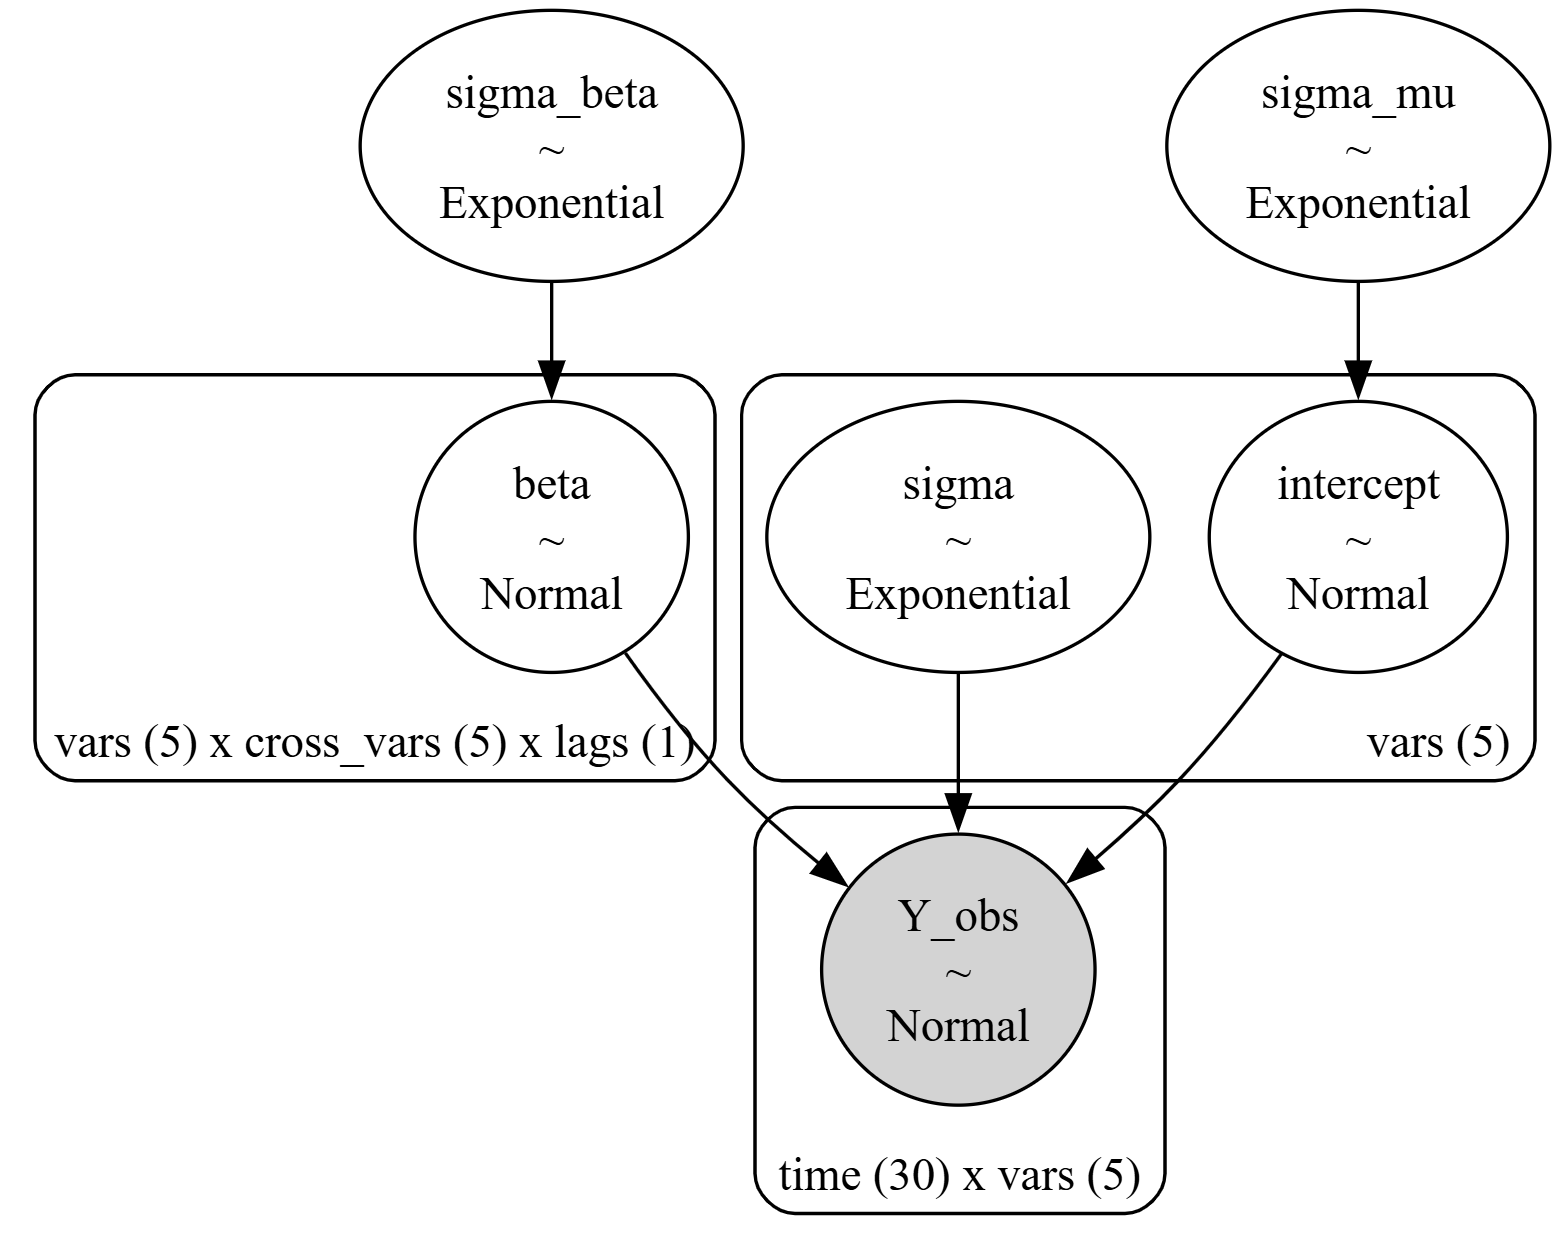
The chart above means that the distribution of the Betas I use for estimation is Normal (usually normal), and the distribution of the Betas’ sigma (standard deviation) is Exponential (so that sigma is always zero or above); likewise for the intercepts. As in the previous analysis, if the explanatory variables are statistically significant and explain well, the noise must be white noise —> the distribution of Y must be Normal, and the distribution of Y’s sigma must also be Exponential. The resulting distributions of these coefficients look like this:
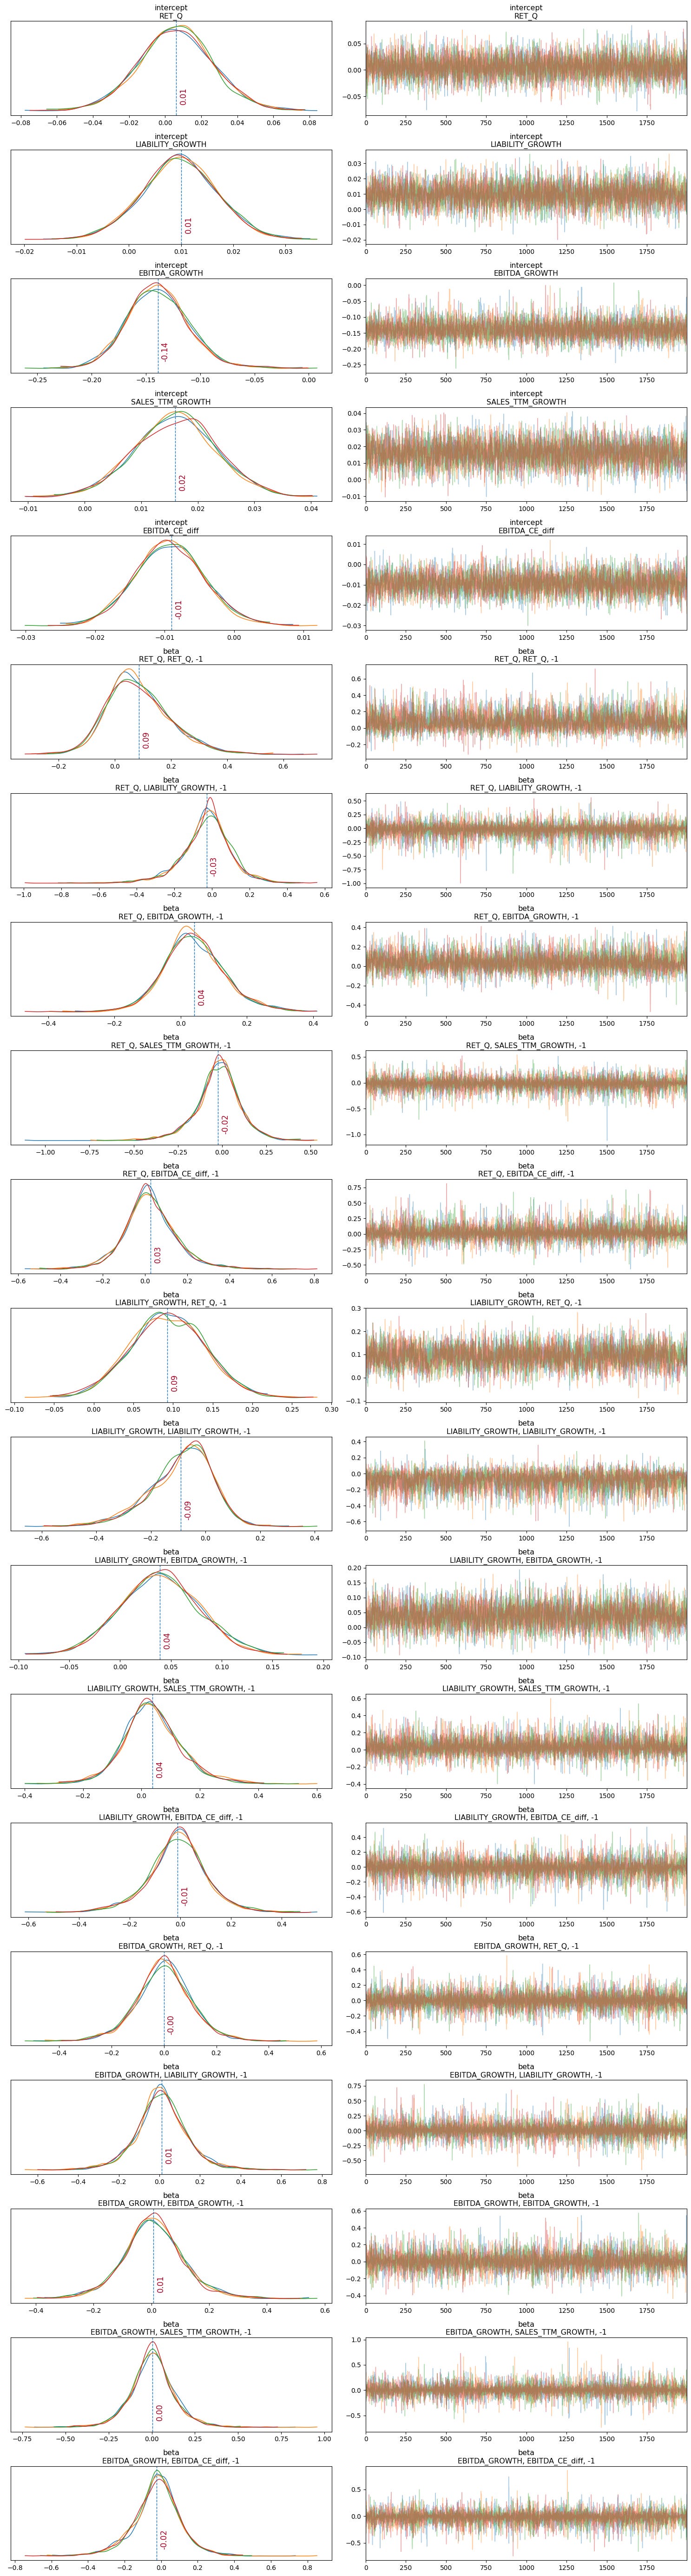
How do I measure this? I use MCMC (Markov-chain Monte Carlo) with the NUTS algorithm. A small digression: Monte Carlo did not start at the casino; it came from a rather famous project, the Manhattan Project. Physicists needed a way to estimate from scarce (and very precious) observational data, and they created quite a few algorithms (NUTS is one of them). Later, physicists gradually ran out of jobs, and maybe one of them went to Monte Carlo to become head of quant (just joking =]]). Many people who don’t understand its essence like to bring it up to dazzle others with jargon (amusingly, last week someone was holding forth on a forum, and I happened to know he was a salesperson for a CFD platform). In fact, it has many applications beyond physics, such as the one in this post.
Following the concept from Part 1, if I fit the model on a rolling basis, it must explain well the past information I let it learn and forecast based on what it has learned. This time, the difference is that it does not forecast a single value; instead it forecasts a whole set of values, as in this figure:
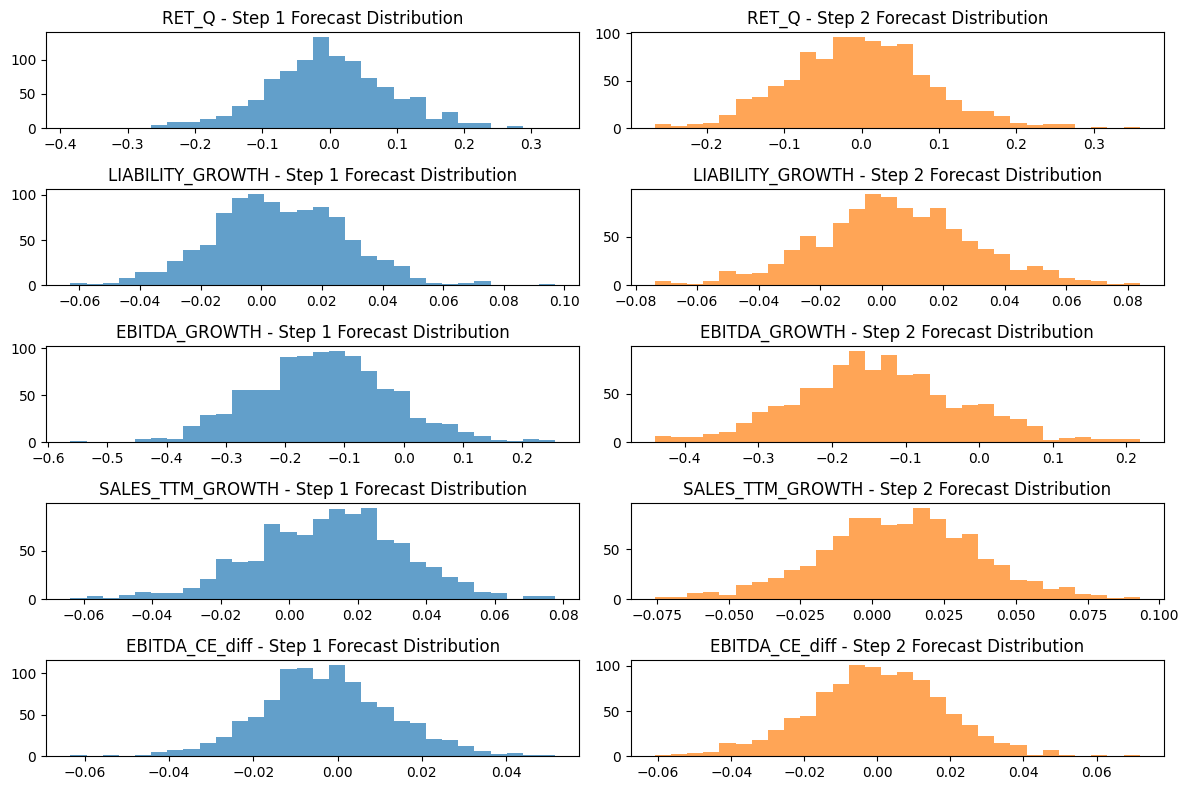
The figure above shows a forecast of 1,000 values for each variable, based on different combinations of betas and intercepts. Its distribution shows the probability of each value, and it answers the question posed at the start: what is the probability that the next quarter/period will rise, in % (a conditional probability grounded in statistics, not descriptive statistics like that F*** company).
So, with a rolling quarterly forecast, how would the results look if each quarter I forecast 1,000 values to see 1,000 possible outcomes based on what my model has learned? Here it is:
This is the forecast for one sector, materials. You can see there is only a single case, in mid-2022 (Q2), where price fell outside our forecast range. Going by falsification (as Karl Popper would), there were clearly times when the market was inefficient (specifically in 2022-Q2), but saying how efficient it is requires further testing (on lower timeframes).
Today’s post is already very long, and these calculations are fairly resource-hungry (for my machine with an RTX 4060 card), though of course still faster than building a “flimsy” Excel model. I will leave the conclusions and the analysis of all the other sectors for the next part. This post rambles a bit in places, and I hope you enjoy it!
Thank you, and best regards!
Technical Analysis Course – CMT Level 1
Green Chart designed this course specifically for candidates in Vietnam who want to study and prepare for the CMT Level I exam. The programme includes 28 sessions of theory, practice questions and mock exams. Students also receive the course textbook, question bank and mock exams free of charge for their exam preparation, and can retake the course for free for life.
See more details about the course here.