

Contents of this article
In this part I dig deeper into the data and build a framework for a broader assessment of how efficient the market is.
Conclusion
- Looking broadly across the financial and real estate sectors, fundamental factors seem to have some explanatory power when forecasting returns.
- Volatility clustering in fundamental factors seems able to significantly affect the stock prices of these two sectors.
Introduction
In the previous part I picked a few stocks to get a preliminary view of the correlation between price and the fundamental metrics in their financial statements. In this part I take a broader view, looking at the full financial statements of 1,615 stocks across the whole market from 2017 to date.
Notes:
- The data covers 1,615 stocks on the market from 2017 to date; periods with incomplete data are still used, applied to all stocks available at each point in time. I crawled the data from several sources and combined it; one of those sources, vnstock (https://vnstocks.com/), is quite good.
- Sectors are classified using the GICS standard, and sector indices are calculated as equal-weighted portfolios.
A preliminary look at the data to find a methodology
Observing changes in fundamental metrics overall
Figure: Book value (BV) growth by sector (GICS classification)
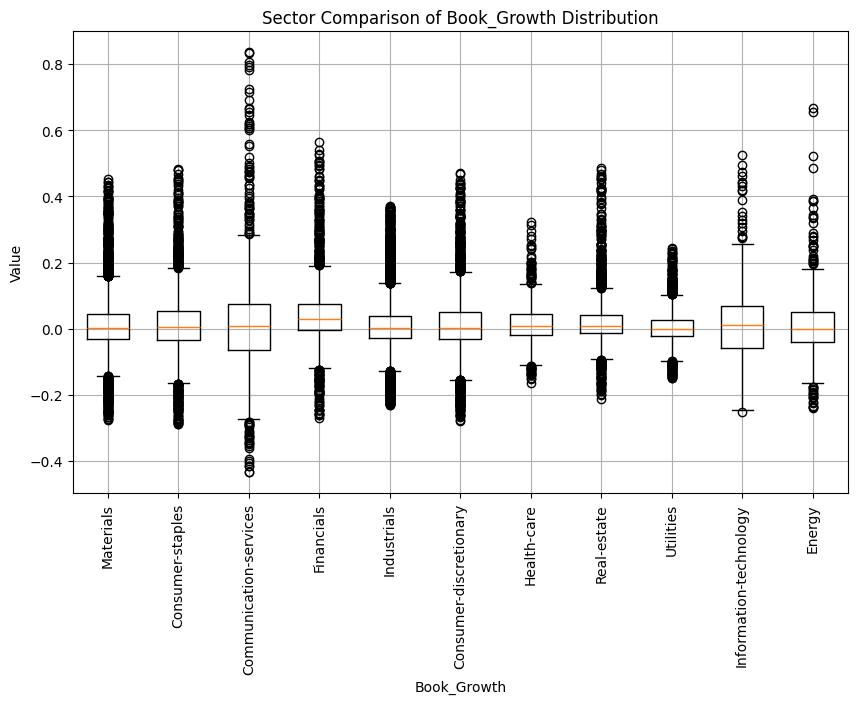
You can see that book growth varies quite differently across sectors. Financials have a significantly higher average than the others, and their range of values is relatively stable. If we divide each stock’s average growth by its volatility (or standard deviation) within these sectors to see how stable BV growth is (in other words, z-scoring or normalising), the result is as follows:
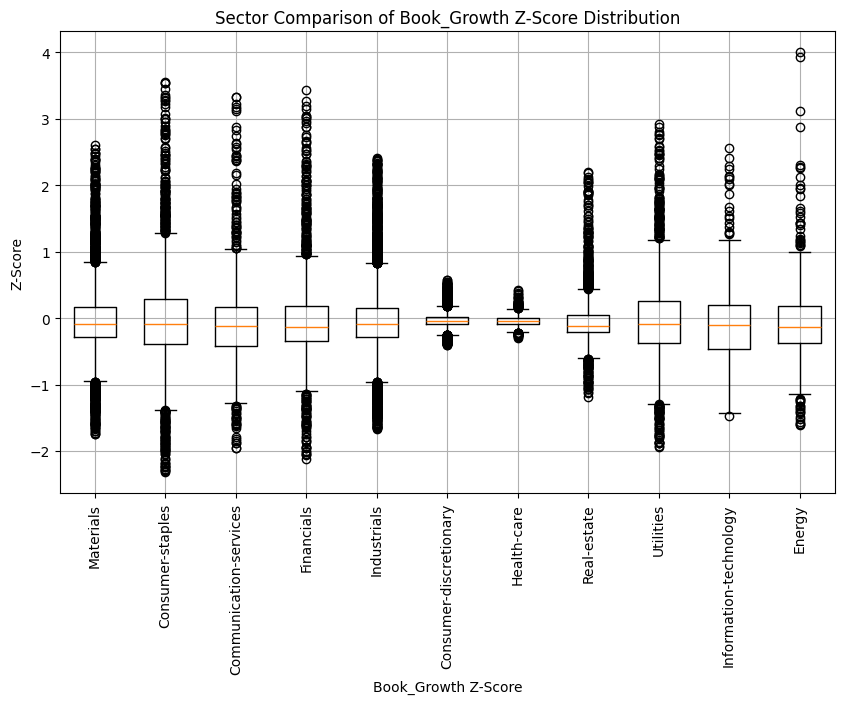
You can see that most of the variation in sectors such as financials and energy comes with quite a lot of positive outliers, while consumer discretionary and healthcare have higher averages and less volatility.
However, looking at TTM net profit after tax growth, the results are somewhat different:
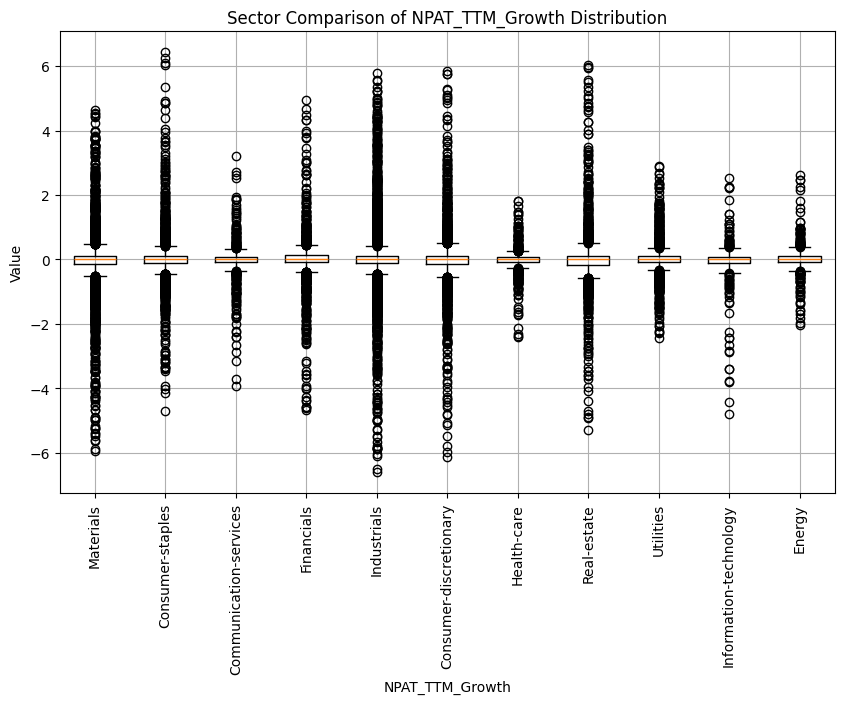
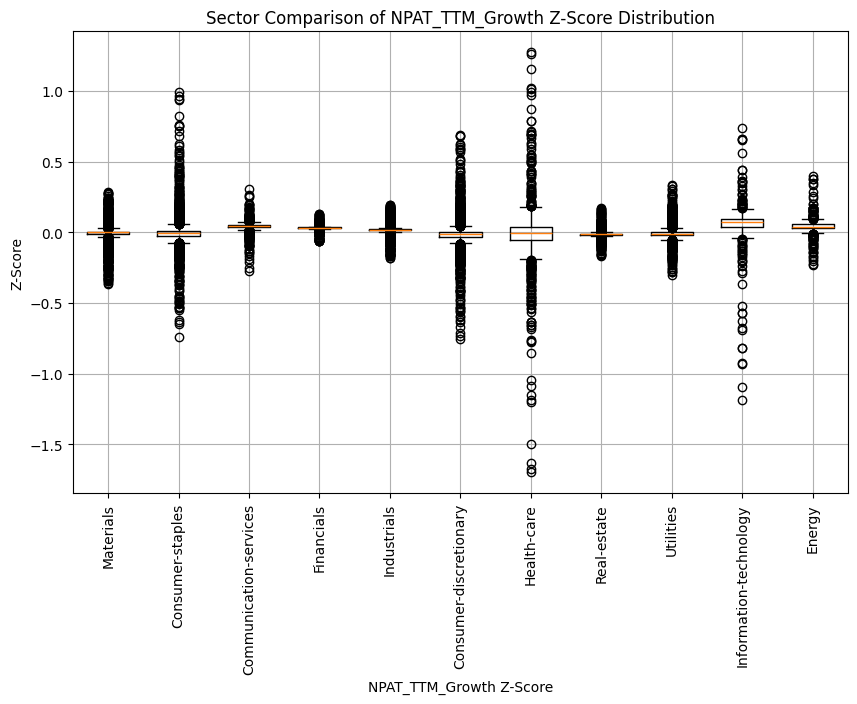
If everything is normalised by z-score, the sectors whose reported NPAT is genuinely good relative to one unit of risk (the standard deviation) are financials, IT, telecoms and energy.
A closer look at specific sectors
Financials
Taking the financial sector (which I find relatively sensitive to VN-Index moves) and analysing BV growth, NPAT and NPLs:
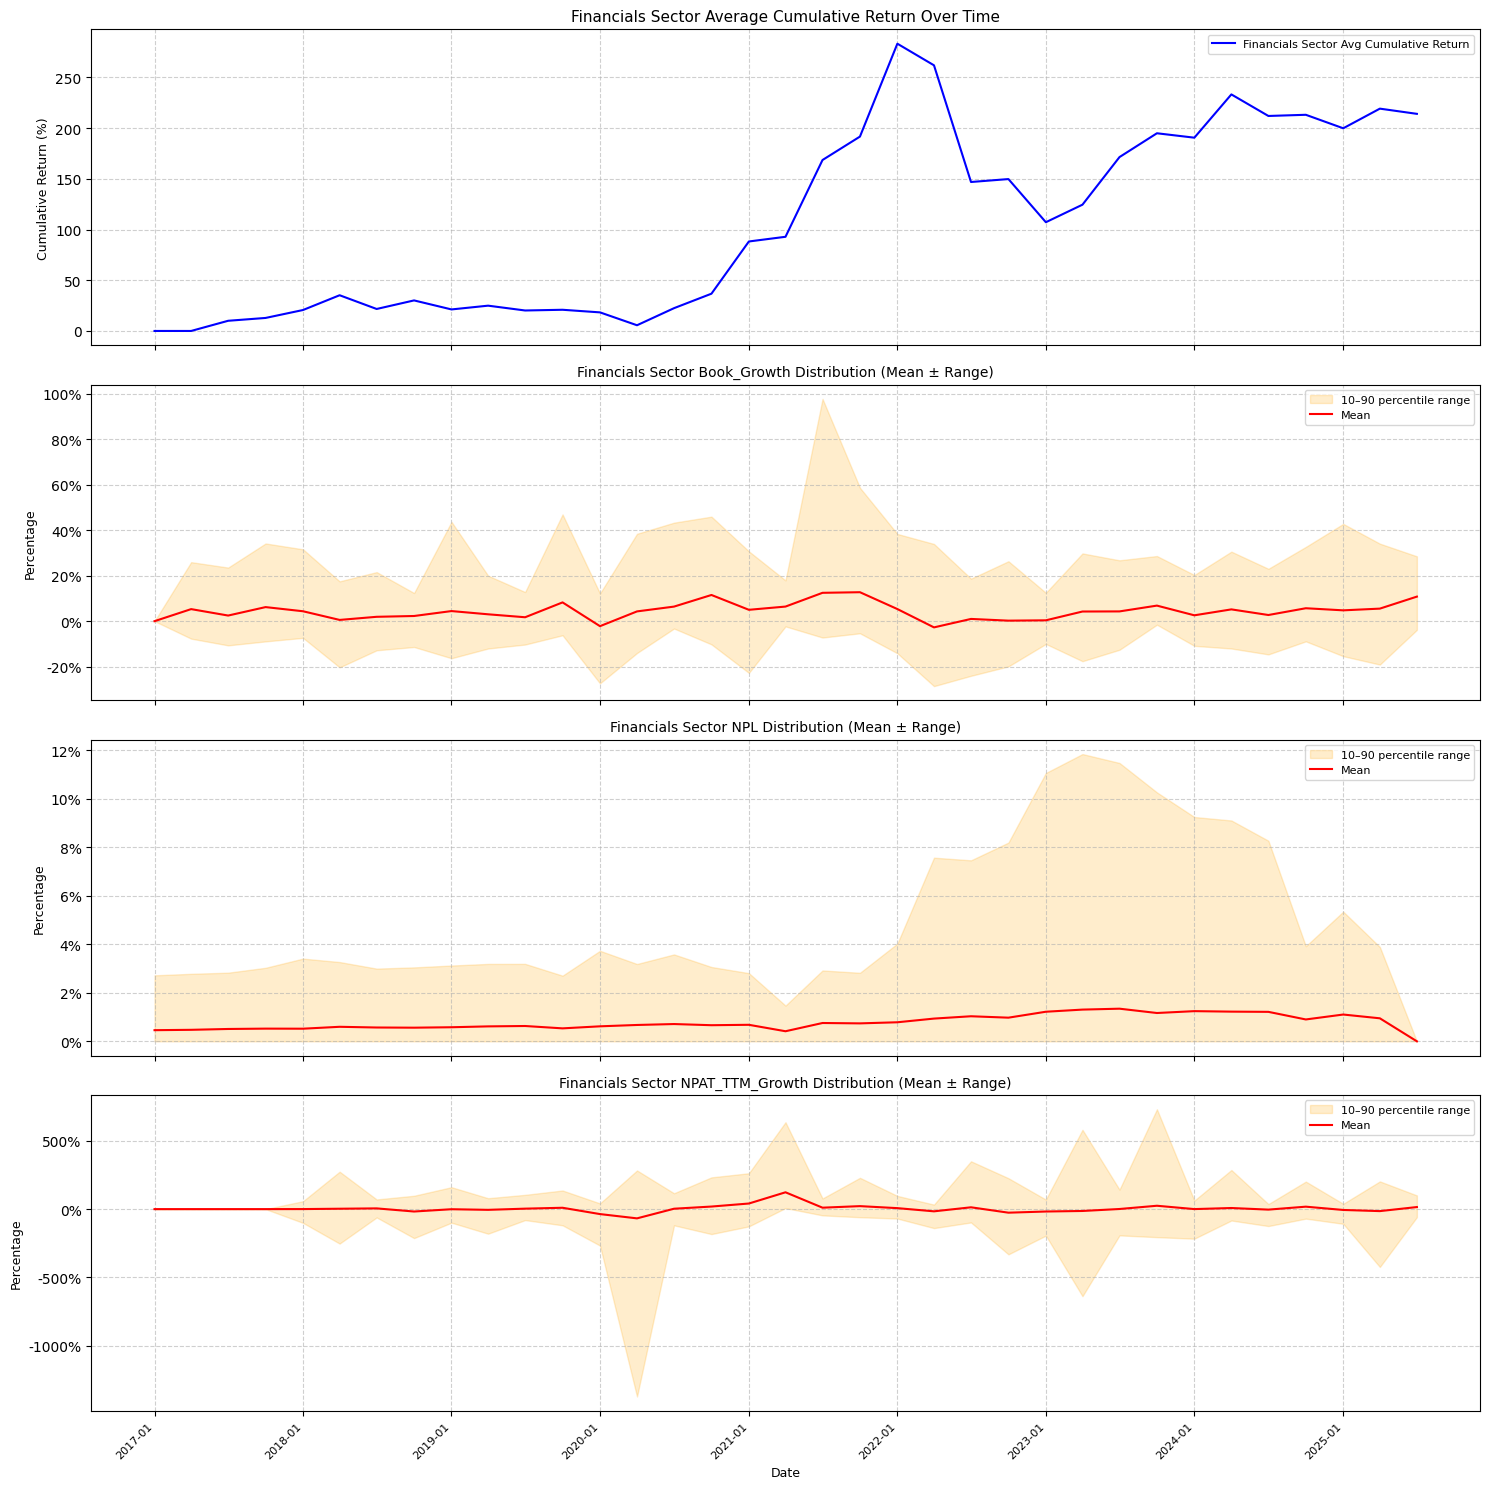
BV growth rose sharply over 2021, especially in July 2021. However, from early 2022 BV growth began to decline gradually, bottoming in October 2022 (the 25% quantile fell sharply).
Meanwhile, NPLs narrowed significantly during 2021 (almost all banks maintained a healthy NPL ratio below 2%). In 2022 they rose gradually, peaking in 2023; at the end of 2022 the market also crashed, partly due to concerns about bank NPLs in this group.
Rather amusingly, 2022 and 2023 also saw quite large swings in NPAT, with some banks even reporting strongly positive NPAT (=]], very interesting – what for, I wonder?).
It seems that looking at BV growth, %NPLs or NPAT growth to assess the LONG-TERM health of the banking group was impossible over 2017 to date! Why do I say this?
- The BV growth and NPL contraction in a period like 2021 were TEMPORARY: banks’ balance sheets were recorded as healthy at that time compared with earlier observations, and then they were recorded as gradually deteriorating (I will only use what is on the chart, not what I know or think I know, to be more objective in this data-driven analysis). Why call it healthy:
- NPLs stay clustered at low levels.
- BV grows strongly.
- Profits move steadily.
- So, to forecast a sector like banking, can we look at banks’ past balance sheets to know their future health?
- Based only on the metrics in financial statements, or better still on case-study research, I think we can. However, its accuracy needs to be clarified over time.
- Based on the factors in the chart, it looks fairly weak, but we can see some characteristics for assessing the overall risk state. For example, in a stable environment for banks:
- BV growth returns to around normal.
- %NPLs return to normal.
- NPAT growth volatility is small or stable.
Assessing quality over the long term is hard, but over the SHORT TERM it may be fine. Why:
- We can determine a bank’s health at a given time if we can identify the normal range.
- And something very interesting: BV growth and % NPL seem to exhibit momentum or clustering:
- Without statistics (just by observation), you can see that all three factors stay within the same range or move together.
- And quite interestingly, price seems to lag the changes in these fundamental factors!
Real estate
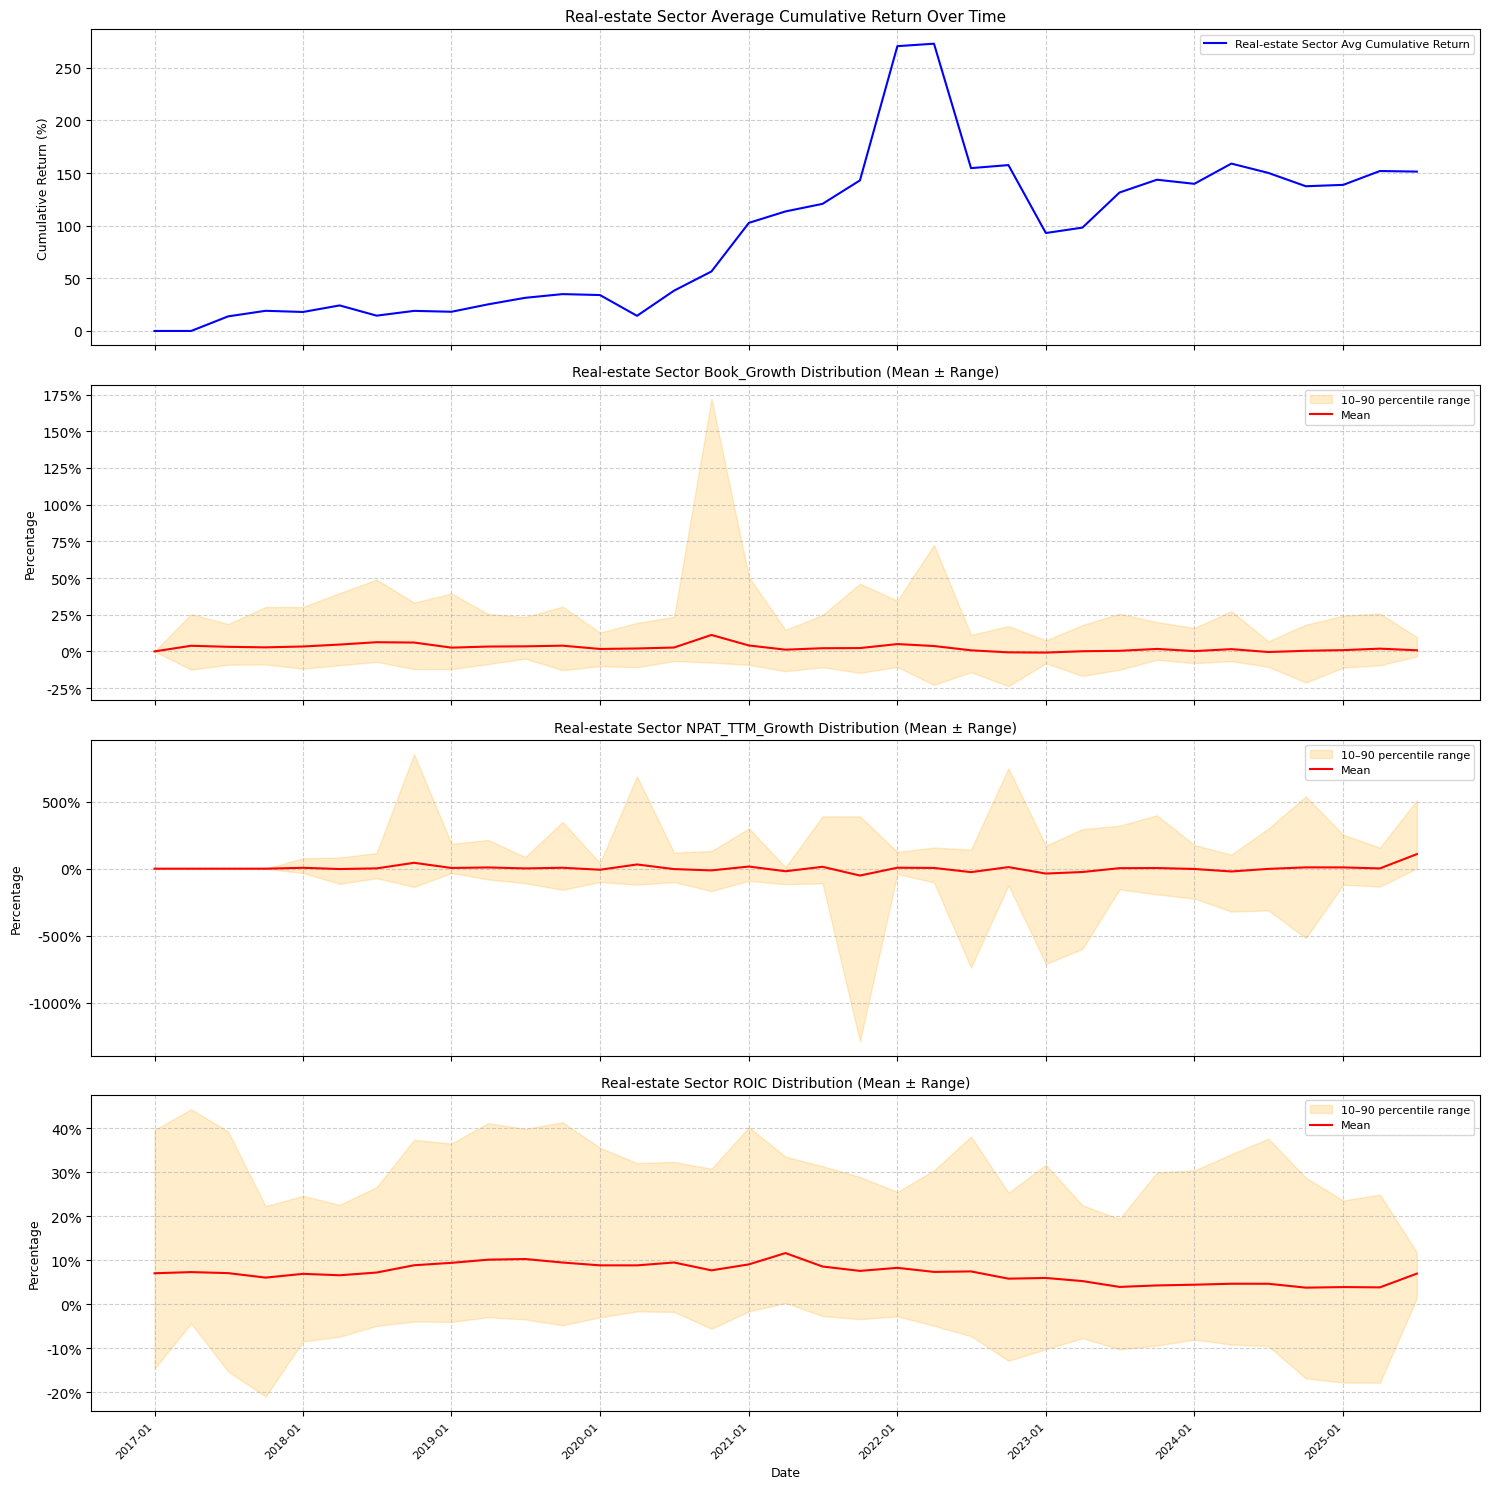
For this sector the data changes slightly: I do not use %NPLs but a different measure, ROIC (TTM). As with financials, these fundamental metrics show that:
- Rising BV seems to imply rising stock prices.
- Changes in NPAT have implications for stock price moves when the lower quantile is larger.
- ROIC is fairly stable, and its trend has implications for rises or falls in the stock price.
Very interestingly, these FA variables seem to act as drivers not only in the current period for these sectors but also for the next quarter.
So what do I take away from these two samples?
- From the perspective of these two sectors, price seems to be explained in advance by fundamental factors.
- Volatility clustering in fundamental factors is one of the important conditions for assessing price expectations for the coming period.
Very interesting! But for a more complete assessment, I need to do two things to make the research more rigorous:
- The FA valuation framework needs a more rigorous basis!
- The data is currently quarterly and unbalanced across stocks (because some companies IPO’d after 2017), so I need a suitable estimation method to value or forecast accurately!
Fundamental Framework
To address point 1, I will draw on a mainstream source: Credit Suisse (CS). Although it collapsed in 2023 and UBS was forced to take it over (=]] poor CS), in the investment banking (IB) world it remains a legend. CS produced some excellent research and a very famous system for assessing corporate quality: HOLT (Holistic Framework for Valuation), which has now moved to the UBS domain (how sad).
What is good about this framework:
- It normalises all accounting standards (such as VAS, IFRS, GAAP…) into a single way of measuring economic value. How? Through CFROI as a common basic measure (plus other factors in their scorecard), it determines enterprise value (EV) after adjusting for specific factors such as inflation and risk premia, and discounts it again by CFROI. This is called warranted value, with the following formula:

- Where:
- It is similar to EV/EBITDA, but more general than EBITDA because: EV is adjusted by an inflation discount on net assets; and it includes CFROI.
- CFROI: calculated as OCF/Capital Employed (OCF is operating cash flow; Capital Employed = Equity + Long-term Debt + Financial Leases). Why is it better than EBITDA? EBITDA only looks at actual cash earnings; it is not a relative measure of actual earnings against the resources invested (via Capital Employed). CFROI therefore reflects both of these relative aspects, putting everything on the scale much better than EBITDA.
- Why is this called the Economic P/E? Rearranging the formula a little: you can see that CFROI * Inflation-adjusted Net Assets = Adjusted Earnings
- It uses CFROI as a tool to assess a company’s health through:
- Momentum factor: a healthy company should show momentum in CFROI, price and liquidity.
- Valuation factor: determined by the Economic P/E, the gap between the Economic P/E and the actual P/E, the Value-to-Cost Ratio and dividend yields.
- Quality factor: historical CFROI and whether CFROI is better or worse than its average.
It is a good framework, and you have to admire CS’s thoroughness: they surveyed and assessed more than 6,000 companies from 1950 to date, supported by plenty of third-party, fourth-party… data (=]]). However, when it comes to actual valuation, the valuation method is very important, and truly understanding what the market is pricing is even more important. So what can I take from this framework:
- Analysis by factors: momentum, valuation and quality. CS’s approach is excellent in clearly classifying what defines each factor; rather than reinvent everything, I can tinker and customise it based on my own understanding.
- Why not use their framework for the calculations?
- When you actually build an Excel model, there is a huge barrier: assumptions! Assumptions differ between tickers, and understanding the nature of a business matters far more. For example, real estate is biased towards valuation by P/B and RNAV much more than manufacturing.
- CFROI works when the sample is large, so that noise is balanced out by companies with good cash flow. It also needs markets with a long history, many mature companies and long enough historical data to use CFROI.
- CS’s dataset is mostly from the US and EU, which differ from Vietnam. The US has clear profit criteria for companies seeking a listing, and some standards differ quite a bit between NASDAQ and NYSE: NASDAQ is more lenient on profit and cash flow than NYSE. Compared with Vietnam, listing standards here are certainly weaker, and companies cannot be classified by financial strength as clearly as in the US or EU.
So, in my view, the framework can be adjusted as follows so that it can be automated: I will use EBITDA (TTM)/Capital Employed growth, BV growth and NPLs (for financials) to measure the momentum, valuation and quality factors.
Now I need to think more about estimation!
Musings on estimation methods
To build something, I need an automated tool to determine how the market is valuing a stock, so as to value it in relative terms! Again: relative valuation! There are many methods with lovely assumptions, such as DCF, FCFF and so on, which assume that if cash flow stabilises at some point and continues to infinity, we get a terminal geometric series to calculate intrinsic value (ridiculous =]]). Then along come the value investors proclaiming things like “ABC’s IPO price was valued exactly as we valued it” (abc…), without having peeked at the answers or used a crib sheet (=]]). With a pile of assumptions like that, there is certainly no such thing as an accurate valuation, only a reasonable one. And “reasonable” is only fair from the standpoint of pricing correctly and understanding what the market is pricing on.
In practice, when valuing in Excel (even running Monte Carlo with Crystal Ball), everything is just assumptions with a little random variation added (if you add Monte Carlo), and that random variation subjectively assumes a single type of distribution (usually Normal or Triangular by default =]]). The problem is: what if the random variables do not share the same distribution? Or, more specifically:
- If there are many sectors, their return distributions are not the same (see Part 1), so how should sectors be estimated appropriately?
- Some sectors contain a great many stocks: industrials, for instance, has 459 tickers while IT has only 17. So how do we get enough statistical significance to compare them, or to make projections?
- The data is unbalanced: since 2017 several companies have listed, and if we balance the data by dropping missing values we lose a great deal, so how do we solve that? Even if some statistical methods can handle it, the data only runs from 2017 to date, so how can we use it to forecast accurately when ML models usually need at least a few hundred rows of data!
- In reality, sectors with similar characteristics share many expectations – in Excel, people call these peer ratios. So how can our results be referenced in this way?
- In practice, when forecasting, the average of previous periods may be referenced and used as a basis, which is especially common when forecasting annual plans (=]]). So projections will carry “anchoring bias” – how do we represent that?
If I reject the plain Excel-dragging approach above, I need a more robust approach that both answers all the questions above and is strong enough that the Excel-dragging crowd can’t argue with it. So I will use a multi-level model (=]]) – just kidding, it is called Hierarchical Bayesian – for the estimation!
However, this post is already long, so I will leave the estimation for the next part. I hope you enjoy it and find it useful. Thank you, and best regards!
[TECHNICAL INSIGHTS] – WHAT FORM OF EFFICIENCY DOES THE VIETNAMESE MARKET HAVE? (PART 3)
Technical Analysis Course – CMT Level 1
Green Chart designed this course specifically for candidates in Vietnam who want to study and prepare for the CMT Level I exam. The programme includes 28 sessions of theory, practice questions and mock exams. Students also receive the course textbook, question bank and mock exams free of charge for their exam preparation, and can retake the course for free for life.
See more details about the course here.