

Contents of this article
This post uses some technical analysis indicators (breadth) to find alpha factors for the VN-Index with the Information Coefficient.
Objectives of this post:
- Assess and filter the VN-Index’s extreme events.
- Mine suitable breadth-based strategies for alpha using the IC.
- Backtest the trading rules to get the final results.
Conclusion:
- New High MA works best with a threshold of 60% and gives the best trading results with a 20-day holding period after a signal.
- The trading signal outperforms the benchmark from 2020 to date, with a maximum drawdown of 31% and average Sharpe and Sortino ratios of 0.65 and 0.85.
Notes:
- This post is purely my personal view and analysis.
- The writing style is close to everyday speech, not very academic, and sometimes mixes in English terms; I hope readers will bear with this.
- The data is accessed and calculated from the vnstock library, calculated on the current VNALLSHARES basket.
- I set aside time-series cross-validation and walk-forward testing for now, so results may differ if these methods are used (though in my experience not by much).
- The data covers 2013 to August 2025.
I) VN-INDEX GROWTH OVER TIME
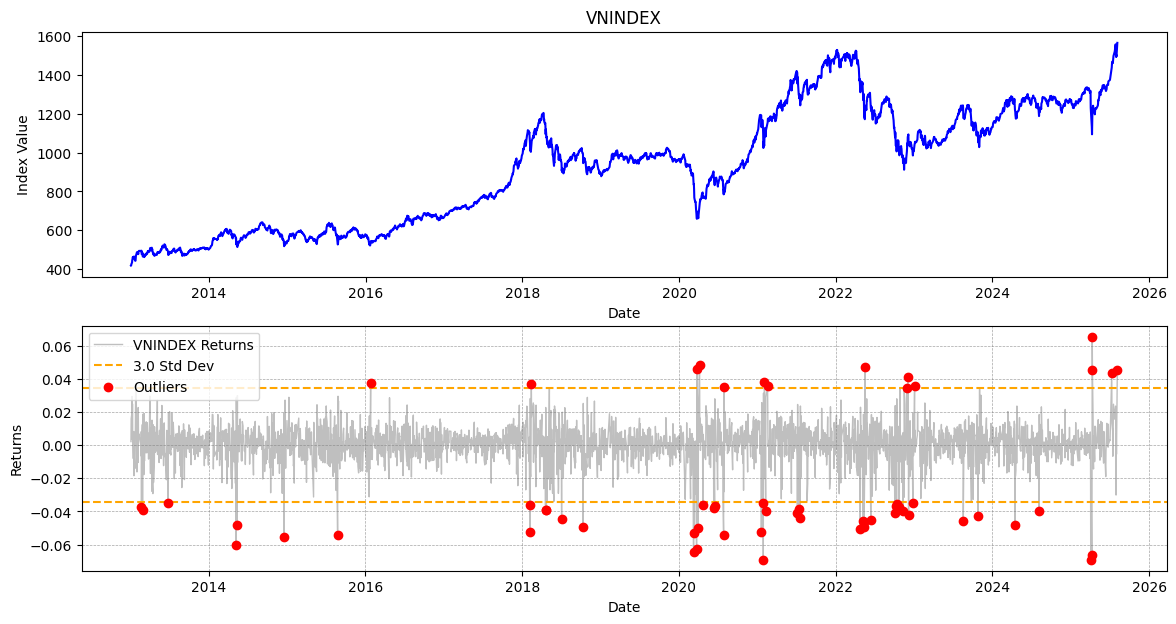
Filtering the VN-Index over more than 10 years at 3 standard deviations, there are more than 61 events (1.96%) with moves beyond this band (3.46%). At the other two levels, 2.5 (band: 2.88%) and 2.0 (band: 2.31%), there are 102 events (3.27%) and 170 events (5.45%) respectively. Just by eye, filtering at 3 standard deviations removes more noise, so I tentatively assume the filter level is 3 standard deviations.
II) OBSERVING MARKET BREADTH
Breadth is commonly known to reflect market sentiment, measuring and warning of changes in sentiment. However, I think this needs more testing to be sure. So I will test the most popular market breadth indicator:
- New High MA: the percentage of stocks trading above their 200-day moving average (200MA).
New High MA:
In theory, this breadth indicator usually signals positive market momentum (prices above the MA200), from which we can judge how reliable the VN-Index is and whether it still has momentum.
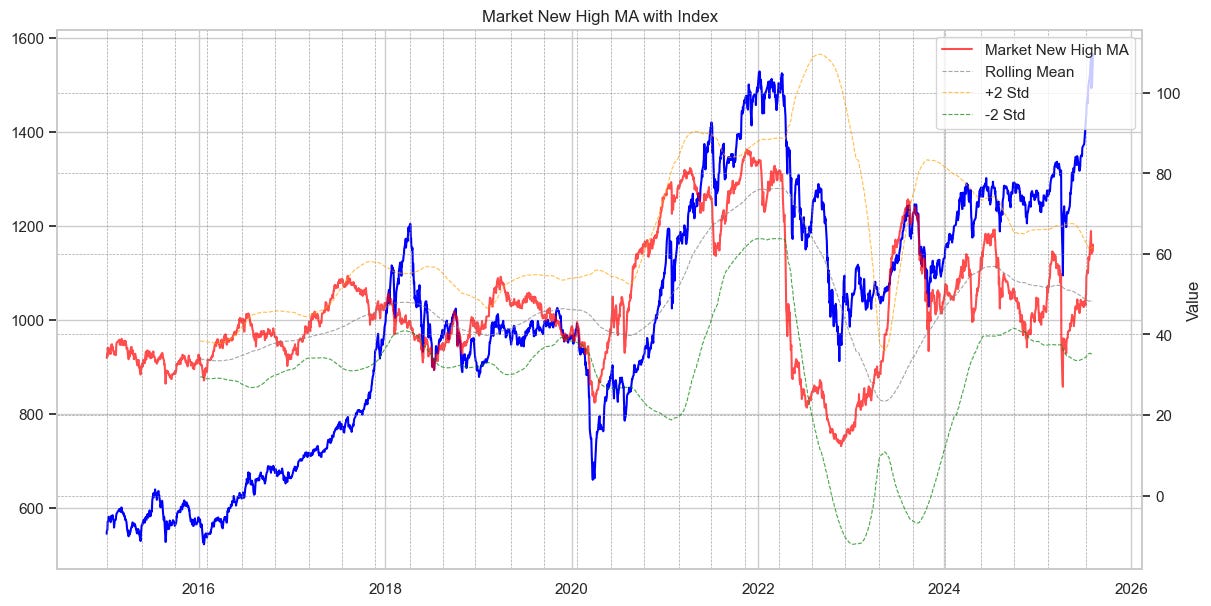
The chart above shows that, compared with the VN-Index, new_high_MA moves quite similarly and is relatively more stable. In particular, over the long term, a divergence between the VN-Index and New_high_MA seems to be a good signal of a strong bullish move, and vice versa.
In addition, new_high_MA also seems to mean-revert quite well, turning around whenever it touches the 2-std mark.
OK! That is all just speculation; now let me plot how this breadth indicator moves against the 1-day return.
To avoid look-ahead bias, I split the data into a training set and a test set. I will mine signals on the training set and test on the test set. The split date is 01-01-2020 (1 January 2020), and the overlap between the two sets can be “purged” to avoid look-ahead bias (I explain why below).
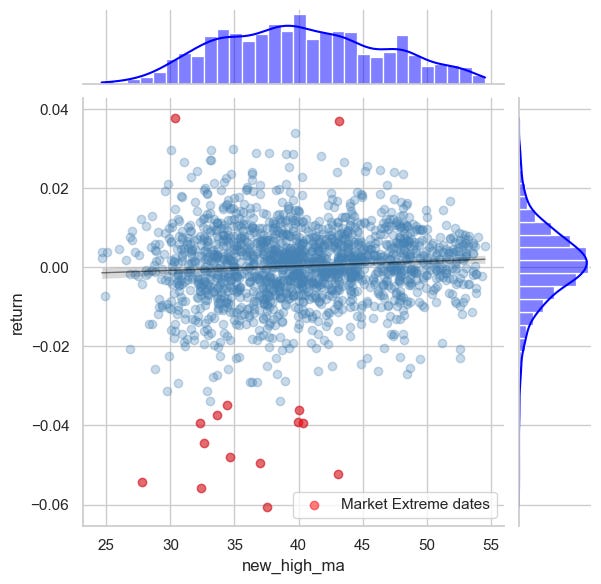
The chart above shows a regression line with a positive, very slight slope; the values cluster quite well around the chart, with outliers spread fairly evenly far out (:)))). However, such a slightly positive slope (almost 0) also means that a trading rule with a 1-day holding period (not feasible anyway, since trading the underlying requires T+2.5 settlement) would only have an expected return slightly above 0. So I need a more suitable holding period, long enough to trade profitably and statistically significant. To check this, I will use an Information Coefficient test to see what return horizon is reasonable.
The Information Coefficient (IC) basically uses correlation measures to see how closely an indicator correlates with returns over different horizons. The key difference is that the usual correlation measure is Pearson, which only captures linear correlation, so if one variable moves very little relative to the other (clustered on a scatter chart), Pearson explains it very poorly. IC usually uses Spearman or Kendall, which can capture non-linear correlation. Roughly, these measures rank first and then measure, which solves Pearson’s clustering and non-linearity problems; you can google for details. In this post I use Spearman. The IC of new_high_MA against returns over different holding periods is shown in the table below:
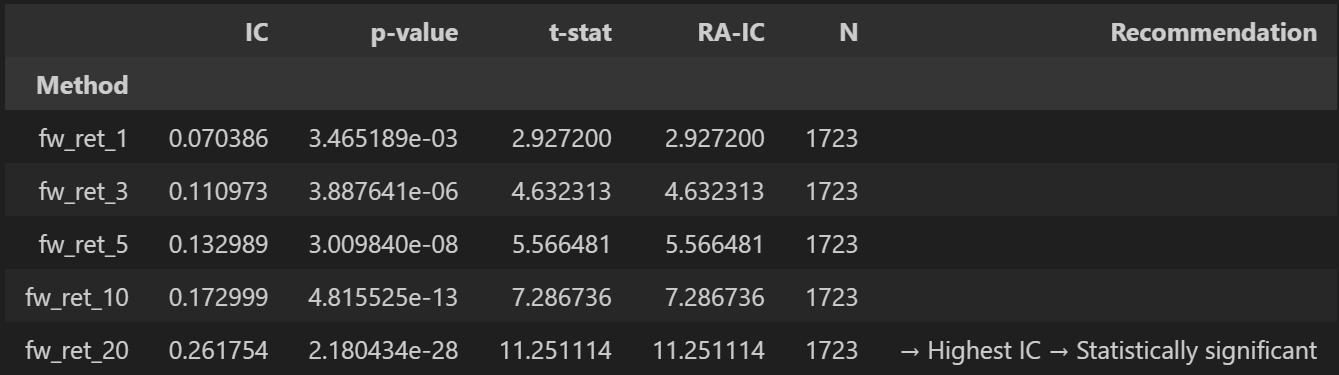
(fw_ret: the forward return over the subsequent number of holding days)
It seems that holding periods of more than 20 days have the highest IC and the most reliable p-values. At this point, overlap between the training and test periods can become an issue, since the holding period is 20 days: if a signal appears on the last day of the training set, it will take returns from the test set, and the test set will suffer look-ahead bias at its start. So I need to “purge” to make sure the test set is not affected.
So I have found a trading rule that seems to fit at 20 days; now let me replot fw_ret_20 against new_high_MA.
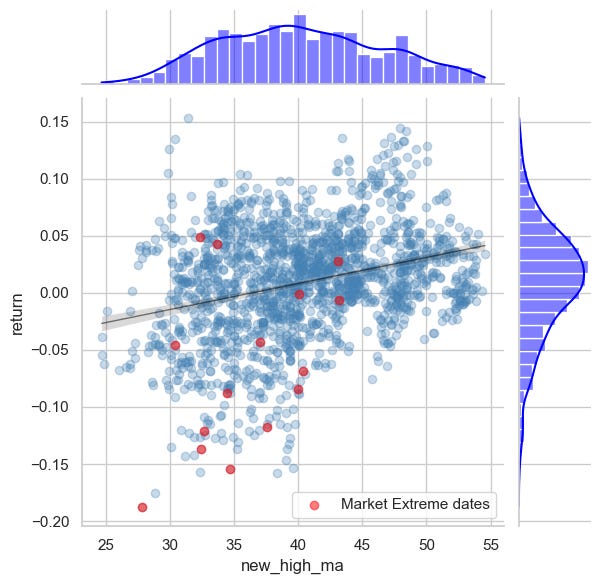
The result is much better: compared with fw_ret_1, this rule clearly has a much steeper slope, and the expected return is much higher too —> I basically have a rule to trade this indicator with a holding period of about 20 days.
Besides the 20-day holding period, there are many other elements to keep searching for in the trading rules. For example:
- Take-profit and stop-loss levels, and how to calculate them.
- Whether the rules suit a trailing stop, or whether I just bail out once the expected level is reached (=)))
- Bet sizing: how much to put into each trade, or what percentage?
All these elements can be tested with the IC to find suitable rules that are, in some way, statistically significant. In my view, this should come before backtesting, partly to save time and partly to avoid meta-look-ahead bias (the cognitive distortion of not realising you already knew about the events you are backtesting).
Now that I have a rule for the holding period, using similar IC tests for the issues above, I have the following specific rules for the VN-Index:
- Holding period: 20 days
- Take Profit: 1.0 ATR(14)
- Stop Loss: 0.5 ATR(14)
- Trailing stop: not suitable (just bail out when done)
- Bet sizing: for now, assume 100% whenever there is a signal.
- Style trading: Long only.
Next, I will backtest these rules.
III) BACKTESTING
To trade, I need a basis for deciding which signals are more reliable. The regression line in the chart above also captures the linear relationship between the indicator and returns, but its tail fans out quite widely, especially below the regression line, where there are also quite a few outliers. Values in this zone are clearly not reliable enough to trade. By eye, I tentatively assume that a new_high_MA of 45% or more is reliable for trading. But I need to find a suitable threshold for the signal, so I will backtest thresholds from 45% to 65% to find the best one – note that I test only on the training set to find the threshold:
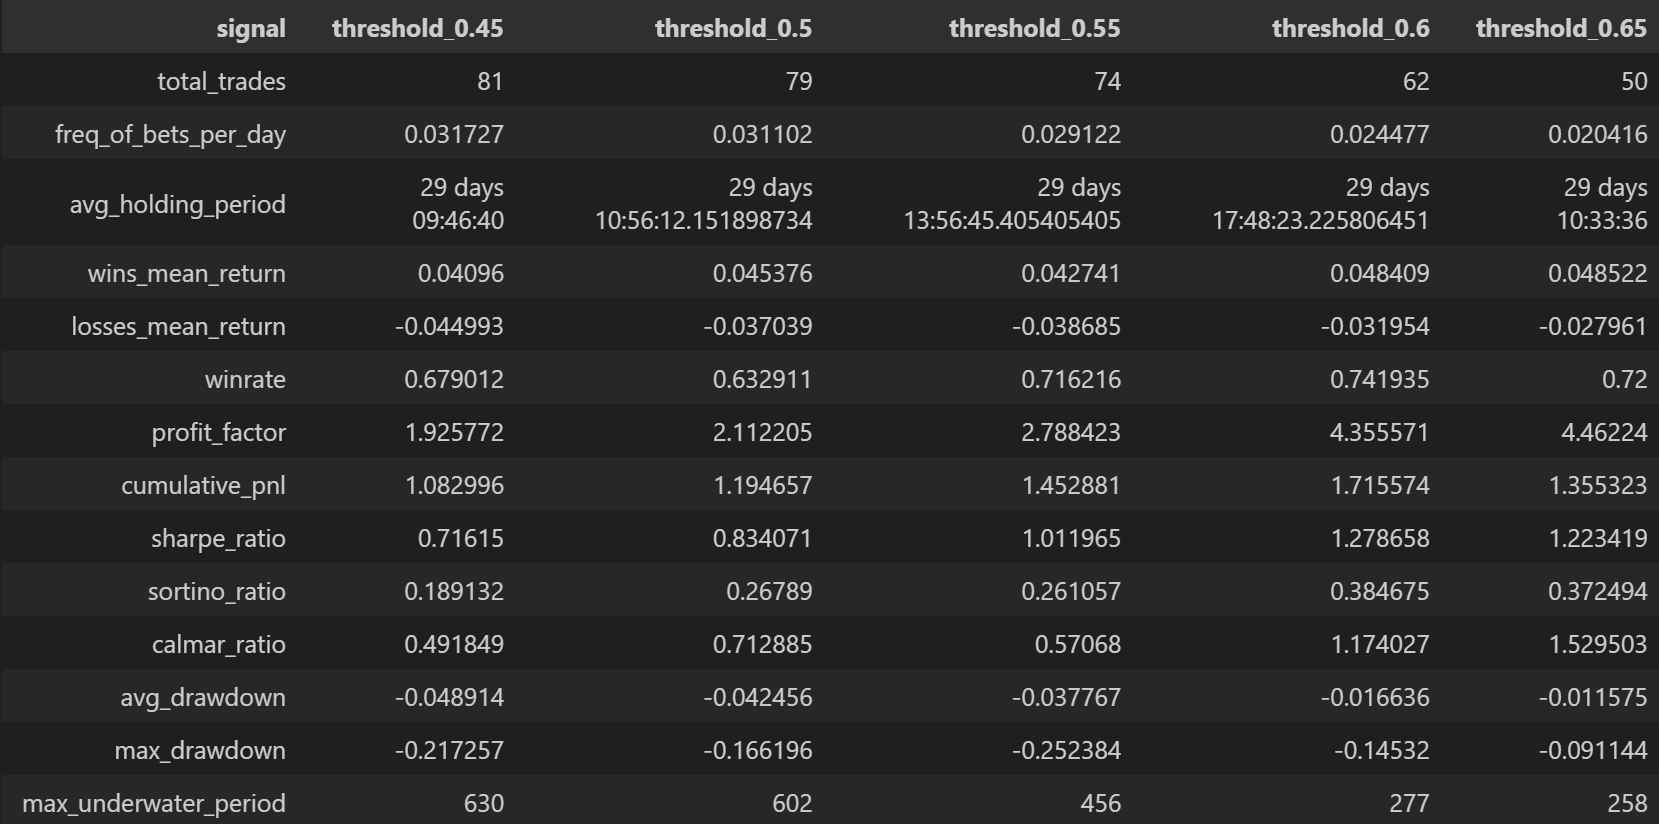
You can see that a threshold of 60% gives the highest Sharpe and Sortino ratios. Even so, its Calmar ratio ranks only second, behind the 65% threshold. The Calmar ratio assesses how well the strategy recovers from a drawdown back to its old high, so anything above 1.0 is acceptable. The trading frequency at this threshold is 60 trades, roughly 0.5 trades a month on average. That is quite steady for my taste.
So, based on this, I choose a threshold of 60%, which has good Sharpe and Sortino and a reasonable Calmar, to test the strategy.
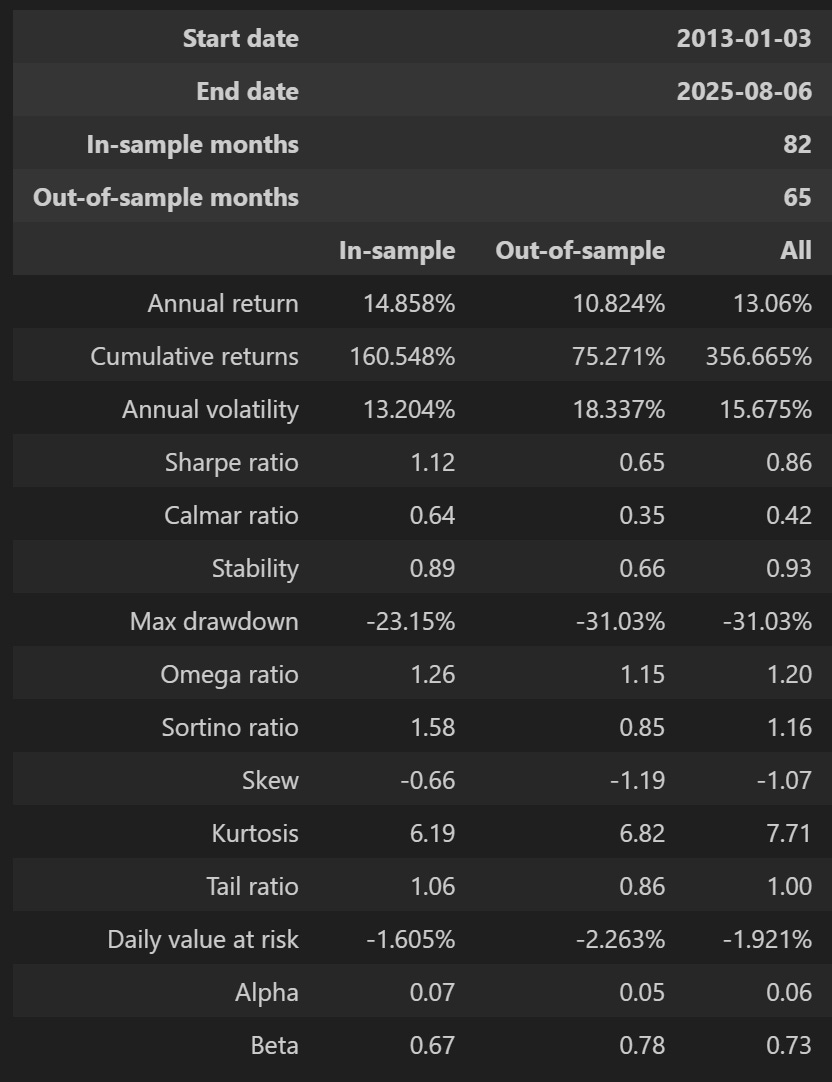
The test shows quite impressive growth across IS (in-sample) vs. OOS (out-of-sample). However, the test set’s Sharpe ratio drops to only 0.65 and its Sortino to only 0.85, versus 1.12 and 1.58 on the training set. Average alpha is fairly stable, though, at 0.05 versus 0.07.
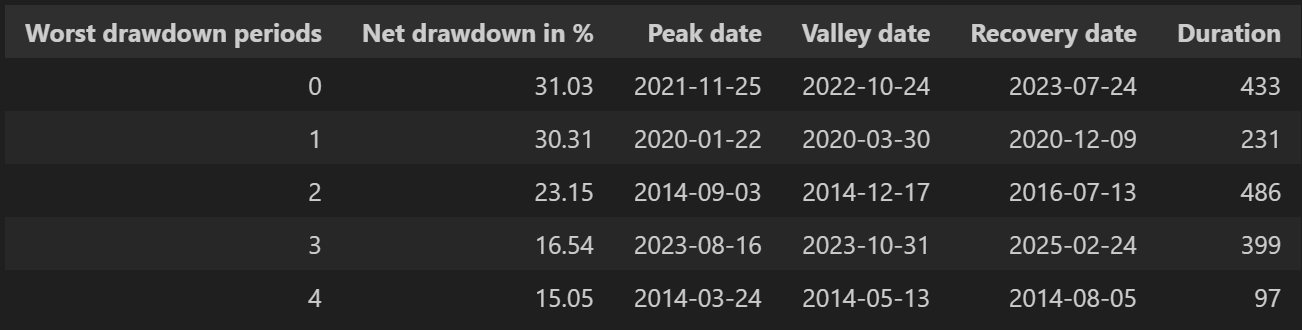
The drawdown over the whole dataset also shows a maximum decline of 31%, versus 23% on the training set. However, for a better assessment I will compare it with the index over the same period.
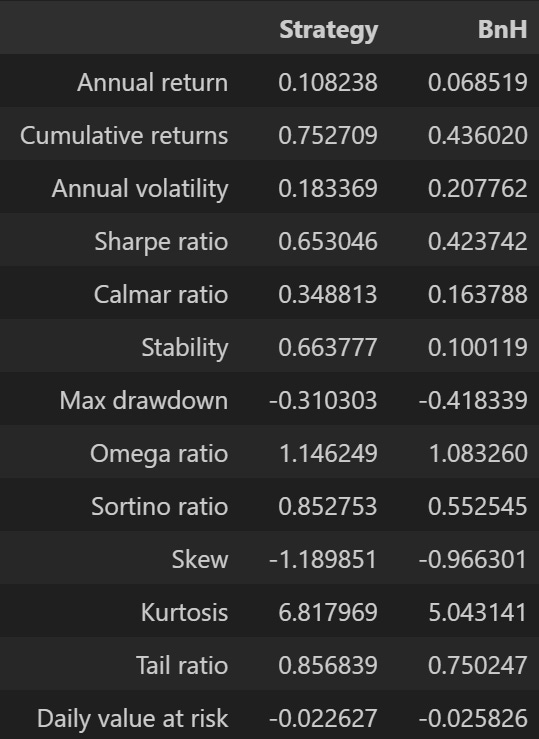
The backtest results on the test set are shown in the table above; the chart below shows them in more detail:
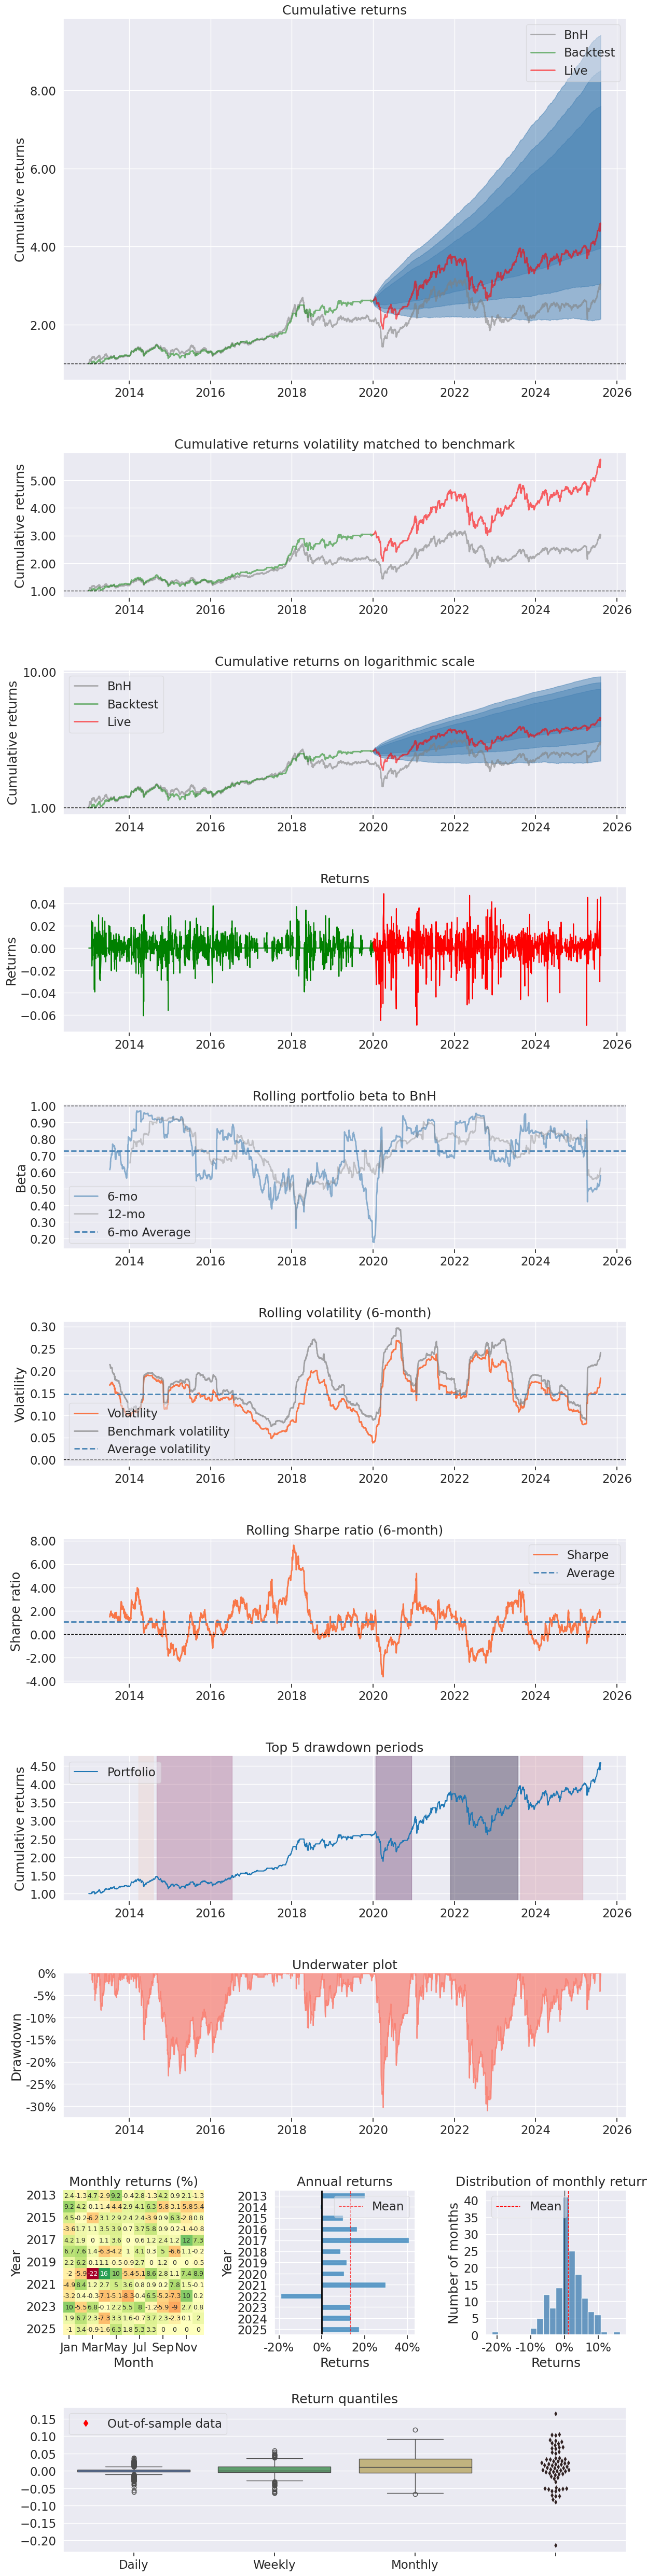
The results show that the strategy fully outperforms the index’s buy-and-hold (BnH) benchmark. The live test from 1 January 2020 is quite good: most of the drawdown came in 2022, and every other year returned 18% or more on average.
In my view, this indicator is “acceptable”, with good performance against the benchmark, and it can be used as a feature in a larger trading model.
This post has become fairly long, so I will stop here.
[TECHNICAL INSIGHTS] – WHAT FORM OF EFFICIENCY DOES THE VIETNAMESE MARKET HAVE? (PART 2)
[TECHNICAL INSIGHTS] – WHAT FORM OF EFFICIENCY DOES THE VIETNAMESE MARKET HAVE? (PART 3)
Thank you!
Nguyen Le Khanh
Technical Analysis Course – CMT Level 1
Green Chart designed this course specifically for candidates in Vietnam who want to study and prepare for the CMT Level I exam. The programme includes 25 sessions of theory, practice questions and mock exams. Students also receive the course textbook, question bank and mock exams free of charge for their exam preparation, and can retake the course for free for life.
See more details about the course here.