
Contents of this article
In this post I focus on analysing the fundamental factors that affect the VN-Index, without limiting the type of model used to evaluate them. Besides models, I will also test how effective labelling is for finding strategies.
Objectives of this post:
- Use fundamental information (P/E, P/B, …) to assess its impact on the VN-Index and to forecast it.
- Find a suitable trading strategy based on this data.
Conclusion:
The eyeballing method in Part 1 for trading on fundamentals can work, but there are still many doubts about its alpha!
Specific trading rules:
- Holding period of 5–10 days, ideally 10 days.
- A z-score threshold of 3.0 for both P/E and P/B; the signal fires on either one (whichever flips the switch triggers an entry).
- The strategy is trend following for z-scores between 0.0 and 3.0, and mean reversion for z-scores below -3.0.
- The remaining rules are as in the previous post.
Notes:
- This post is purely my personal view and analysis, based on my limited knowledge, so it is somewhat subjective. I would very much welcome everyone’s feedback!
- The writing style is close to everyday speech, not very academic, and sometimes mixes in English terms; I hope readers will bear with this.
- The data is accessed and calculated from the vnstocks library (http://vnstocks.com).
- I set aside time-series cross-validation and walk-forward testing for now, so results may differ if these methods are used (though in my experience not by much).
- The data covers the VN-Index from 2017 to date.
Terminology:
- Sharpe Ratio: measures return per unit of risk. Return is the average return (which can be adjusted to a more specific level, e.g. by subtracting the risk-free rate), and risk is the standard deviation of returns. In my view, a Sharpe ratio of 0.6 or above is only just acceptable.
- Sortino Ratio: similar to the Sharpe ratio, but risk here measures only downside moves, i.e. the standard deviation of negative returns. So this ratio focuses on return per unit of downside risk. In my view, a Sortino ratio should be 0.8 or above to be considered decent.
- Calmar Ratio: this is the recovery ratio from a drawdown; it can be thought of as a measure of how returns recover, so it should usually be 100% or more to be considered safe.
I) OBSERVING THE FUNDAMENTAL FACTORS
P/E and P/B are fundamental factors that get a lot of attention in trading and analysis. There is already plenty of research on P/E and P/B, the most famous probably being the Fama-French five-factor model (for details, see (Fama & French, 2015). A five-factor asset pricing model), one of whose factors is the inverse of P/B. Here, however, I will focus on finding strategies that can be traded with these metrics.
As in the previous post, I scan the impact of strategies using the IC and use the outliers from the previous post. First, for P/E, I get this result:
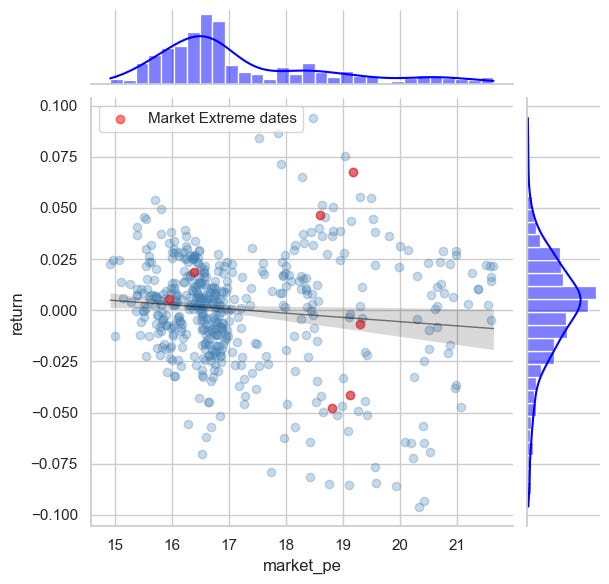
The return here is the 5-day forward return, fw_ret_5 (with a statistically significant p-value), which also means a 5-day holding period works best. The chart above also shows an inverse relationship between P/E and returns: the higher the P/E, the lower returns tend to be (=]]). There is also a “fanning tail”, which is common in statistics; the textbooks call it heteroskedasticity when the return series is non-stationary (such a headache). The issue is actually very simple: because my return estimate is the forward 5-day return, it is influenced by the preceding days, so the tail gradually fans out. Here I am only looking at the relationship between the indicator and returns to mine strategies, not building a return-forecasting model, so I don’t need to fix this statistical “defect” – besides, I’m lazy. So a 5-day holding period looks fine.
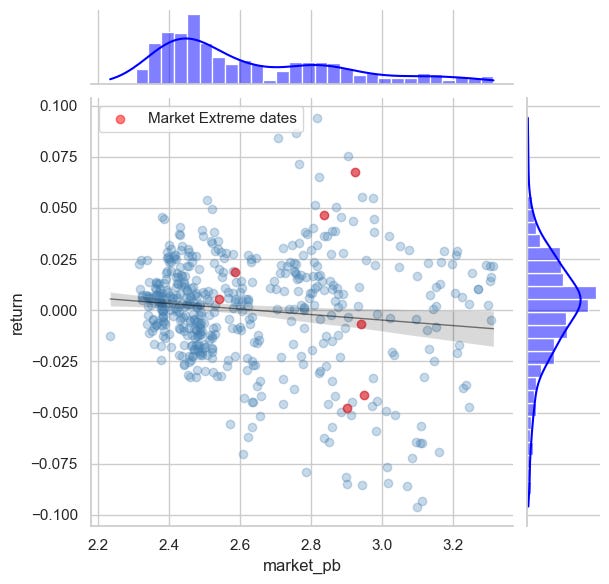
For P/B, the 10-day forward return, fw_ret_10, is more statistically significant, meaning the holding period is twice that of P/E. Both charts show an inverse correlation, and both indicators are heavily concentrated on the left (positive skew) and fan out to the right. More notably, P/B seems to have two zones in its distribution, with two high-density peaks (peak 1 at P/B ~ 2.5x and peak 2 at P/B ~ 2.8x). It looks to me as if there is a regime switch in the market’s valuation range. In that case the market can keep moving or stay anchored at normal levels even though P/B is already relatively high —> a mean-reversion strategy may not work well here.
At this point I have drawn a few observations:
- Issue 1: The holding period would be 5–10 days if both factors are used. So what is reasonable?
- Issue 2: How should the indicators be read?
- There seems to be some relationship between these two indicators and returns, possibly inverse: the higher the indicator, the more likely price is to fall (mean reversion?);
- However, there may also be periods of high valuation in which the market keeps behaving normally and mean reversion may not work in those zones (trend following, perhaps?).
OK, so here are some ways to address the issues above:
- Eyeball the charts to filter signals (=]]), combined with traditional technical analysis.
- Use some machine learning model (ML :))) to evaluate and filter signals.
I’ll do both to see which is better (=]]). In Part 1 I experiment with option 1 first.
II) EXPERIMENT
Observation and experimentation
Evaluation flow
OK, here I observed what seems to be an inverse relationship. I will subjectively treat it as a “dual-nature” signal (both mean reversion and trend following), and I will test to find sensible trading thresholds for these indicators following the technical analysis flow. This is the flow, as I understand it, that the CMT Association applies for technical analysts. The flow is simple:
Observation —> Signal testing (finding the strategy with the highest predictive power) —> Backtesting (re-checking the trading simulation on new data to compare the strategy’s performance in the experiment and in practice).
Note that signal testing means searching for the signal with the best trading potential; it is completely different from backtesting, which only evaluates the results of a signal on a historical dataset.
Because the data is thinner than last time (2017 to date), the train/test split is set at 01-01-2024 (1 January 2024) for a fuller assessment.
Preliminary transformation
From the preliminary observations above, both P/B and P/E seem to have both trend-following and mean-reversion characteristics, but I have not yet found a way to identify signals of this kind. For a quick shortcut, I will rescale the values by their volatility – in other words, calculate z-scores for these two metrics. The z-score is calculated simply as follows:
Where:
- PE_mean: the rolling average P/E, roughly a 60-day P/E moving average.
- PE_Std: the rolling 60-day standard deviation of P/E – like PE_mean, but calculating the standard deviation instead of the average.
Likewise, I use the same formula for P/B:
After the z-score transformation, the distributions of P/E and P/B look like this:
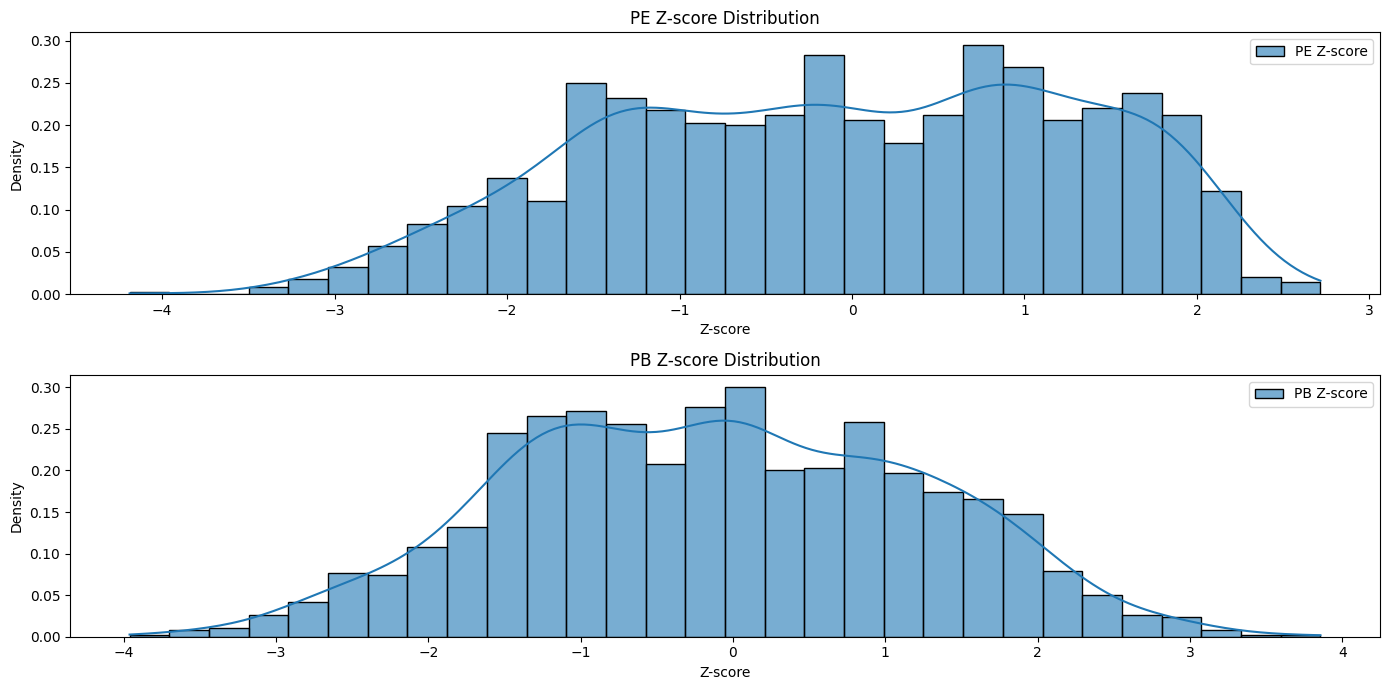
You can see the values are now concentrated in one area much more (still with quite a few peaks =]]). This reduces false mean-reversion signals: I can choose the zones with few outliers in the two tails of the distribution to define mean-reversion signals —> Mean reversion signal completed!
For the trend-following signal, in theory trend following believes that past momentum (price inertia) persists and will continue into the present. One of the most classic ways to define a trend-following signal is price above the moving average, i.e. price minus the average > 0. Wait a moment – price minus the average greater than 0 means (PE – PE_mean) > 0 or (PB – PB_mean) > 0. Since PB_std and PE_std are clearly positive, momentum also means the z-scores of P/E and P/B are positive (heh, so convenient, no extra calculation needed). So to identify trend following, I only need to check z-score > 0 —> Trend following signal completed!
Trading execution: since Vietnam only allows long-only trading in the underlying, I cannot short the extreme highs, so my signals consist of:
- Dip-Buying: buy at the bottom when there is an extreme signal in a downtrend.
- Trend-Following: buy in the safe zone above 0 and below the extreme zone on the upside.
Signal Testing
Now I will test these signals to see which set works best. There are a few issues:
- The values here are rolling, and above I have tentatively assumed 60 days (i.e. one quarter of observations). But that window may not be effective, so I need to test which works best. I will test windows from 20 to 100 days (1–5 months)
- To filter the extreme points for mean reversion, I need to know what threshold is reasonable. From the z_score distribution above, its absolute values range from about 0.0 to 4.0; by eye, I set the test range at 1.5–3.0
OK, now let’s test and see the results:
5-day holding period:
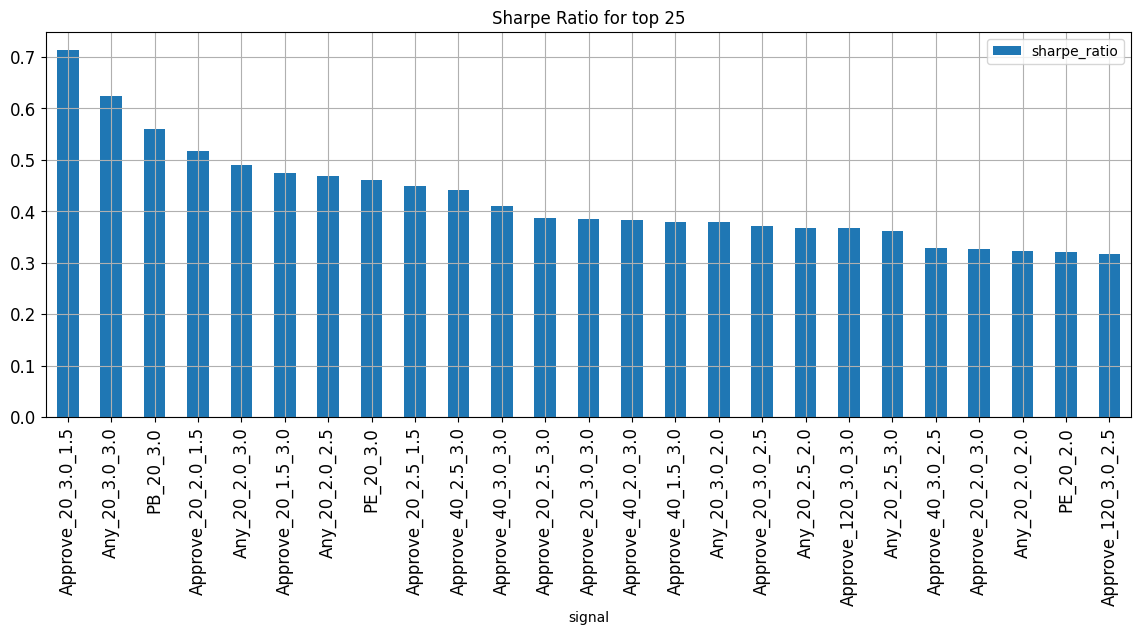
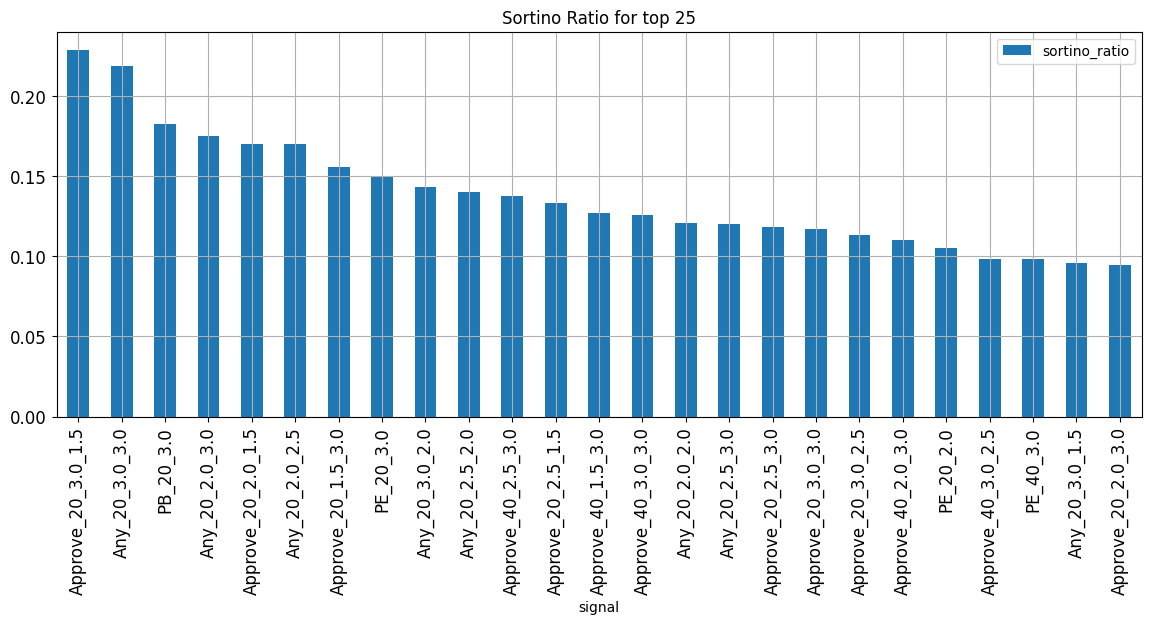
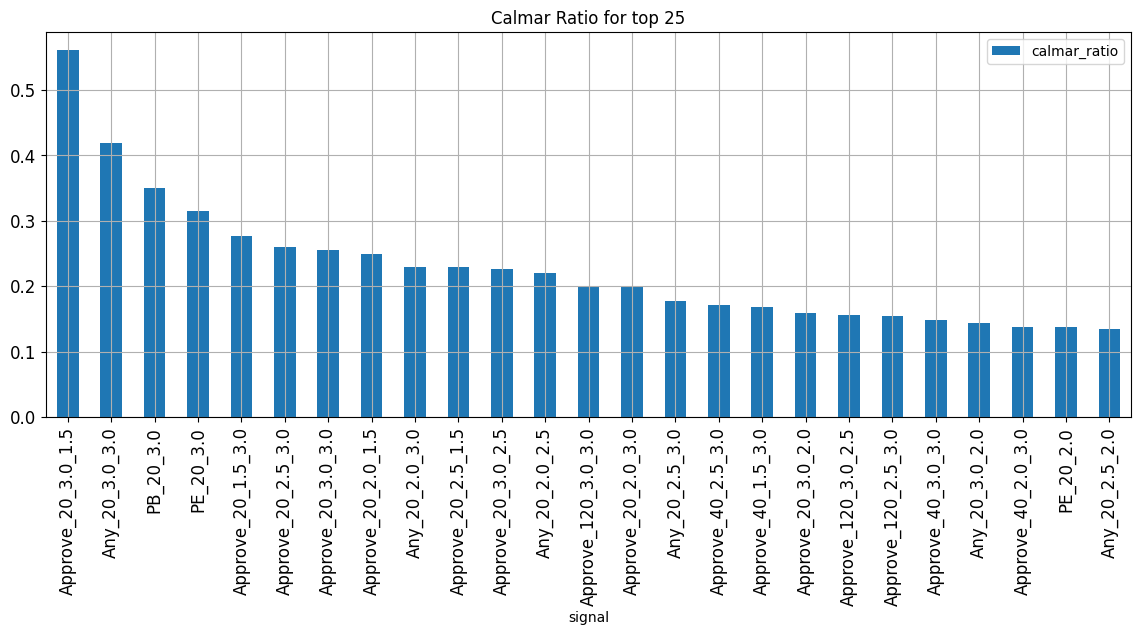
(where: Approve means a signal is required from both P/E and P/B before trading; Any means a signal from either indicator is enough to trade)
Only the Sharpe ratio is decent; Sortino and Calmar are low.
Now let’s try a 10-day holding period:
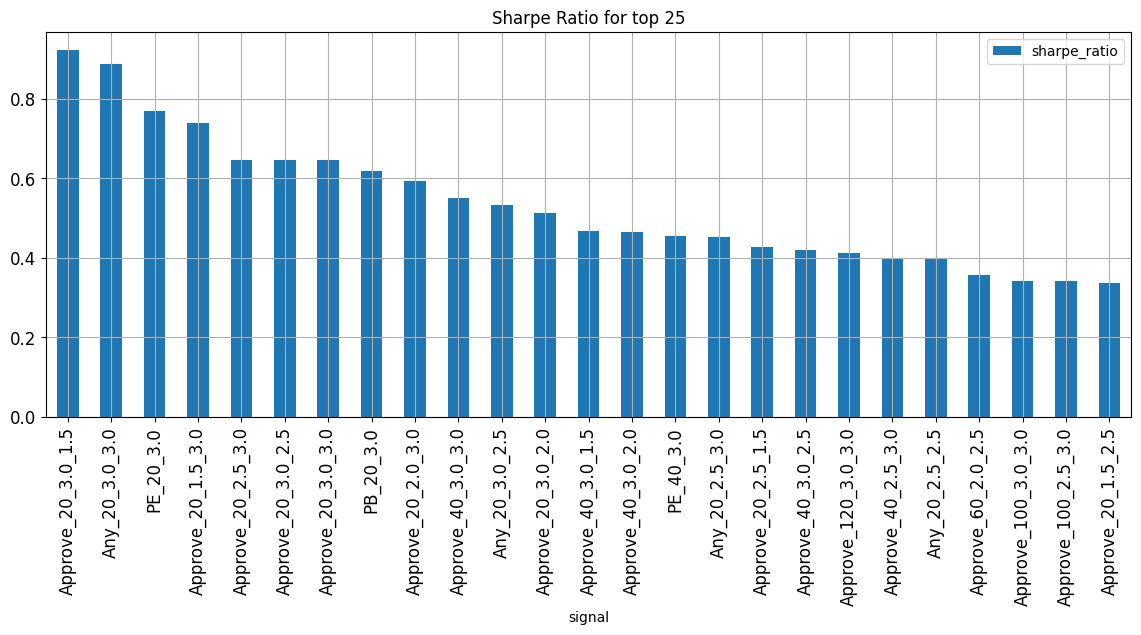
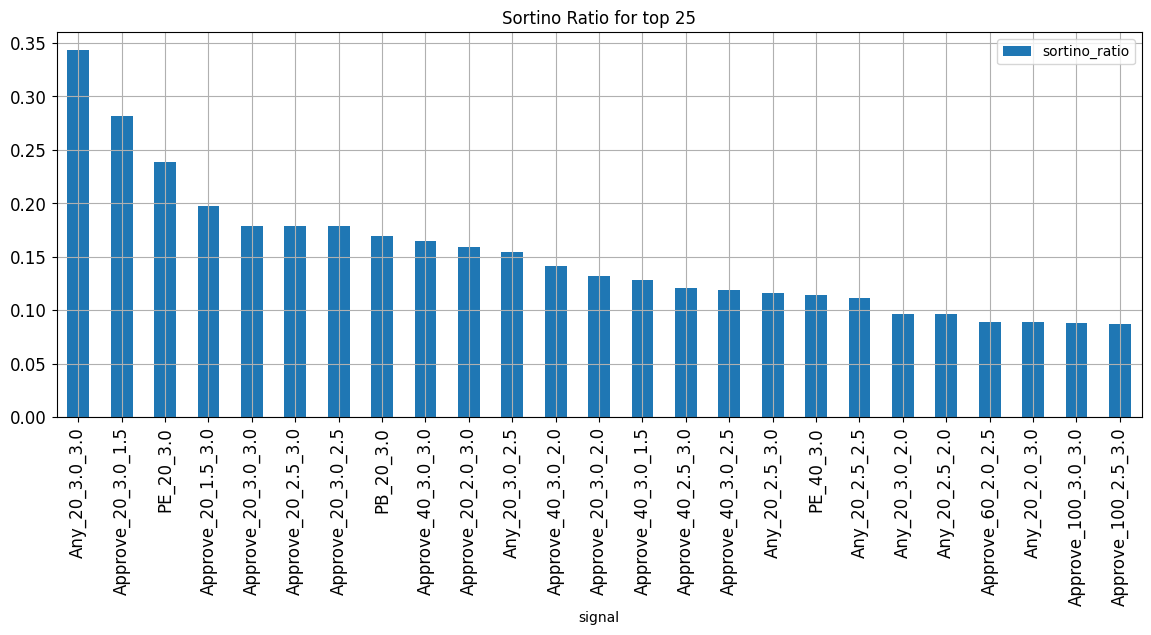
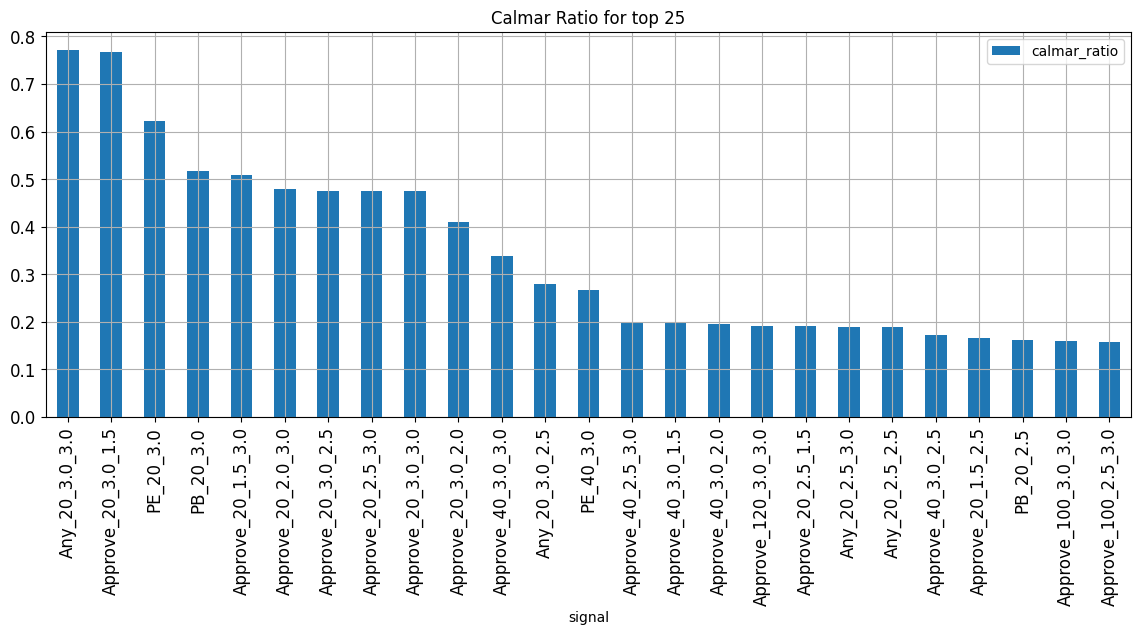
Testing the strategies on data up to 01-01-2020 (1 January 2020) shows that:
- A 10-day holding period is much better: Sharpe and Calmar are significantly higher, while Sortino improves only slightly.
- A 20-day observation window gives better Sharpe, Sortino and Calmar values.
- The suitable threshold is 3.0 for both, which notably improves Sortino for both holding periods.
- The strategy combining both indicators gives the highest Sortino, with Sharpe in the top five, using the rule that a signal from either one triggers an entry.
Based on this, I choose the strategy that watches both indicators, with thresholds of 3.0 for the z-scores of P/E and P/B.
Backtesting
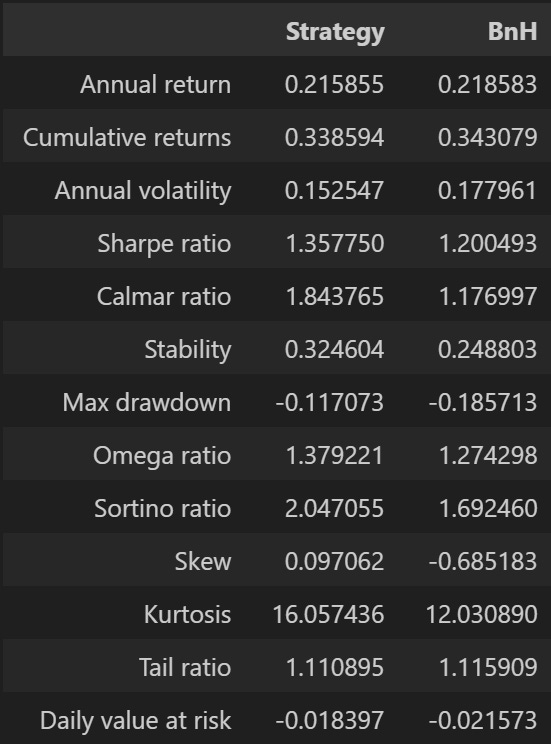
The backtest results for this strategy are as follows:
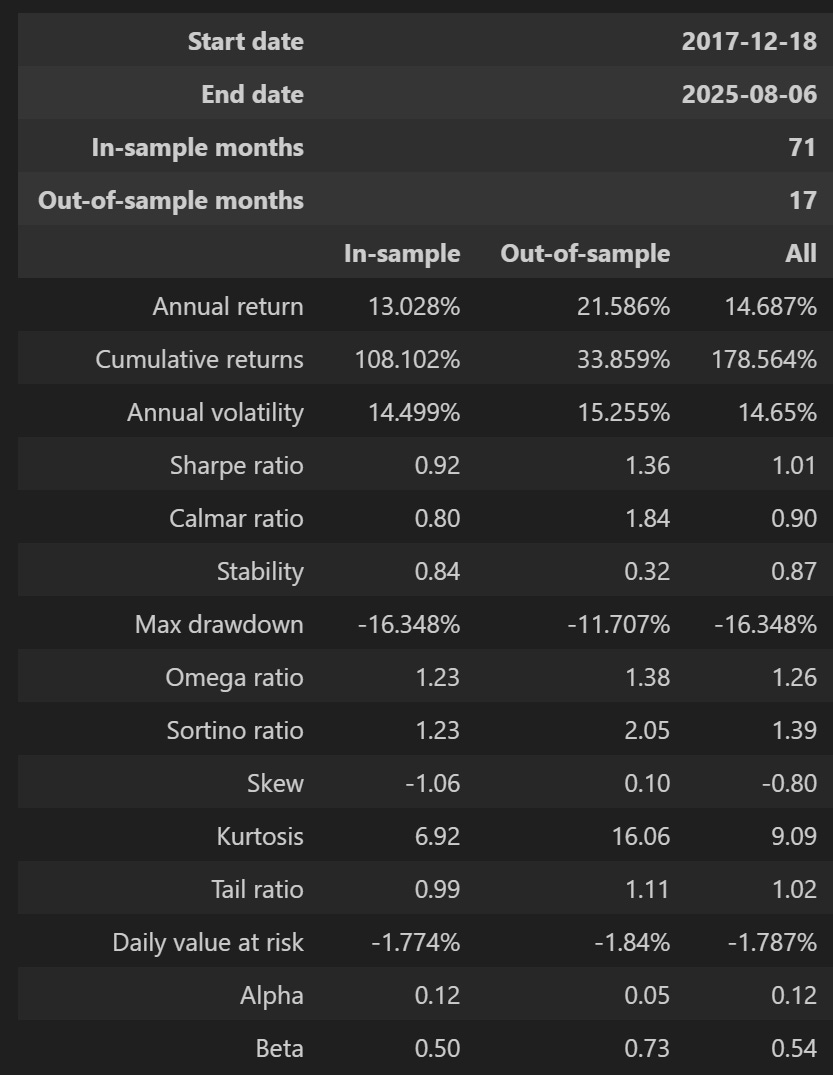
The strategy performs relatively steadily, with good Sharpe, Sortino and Calmar ratios. Alpha is somewhat erratic.
Let’s plot it and see:
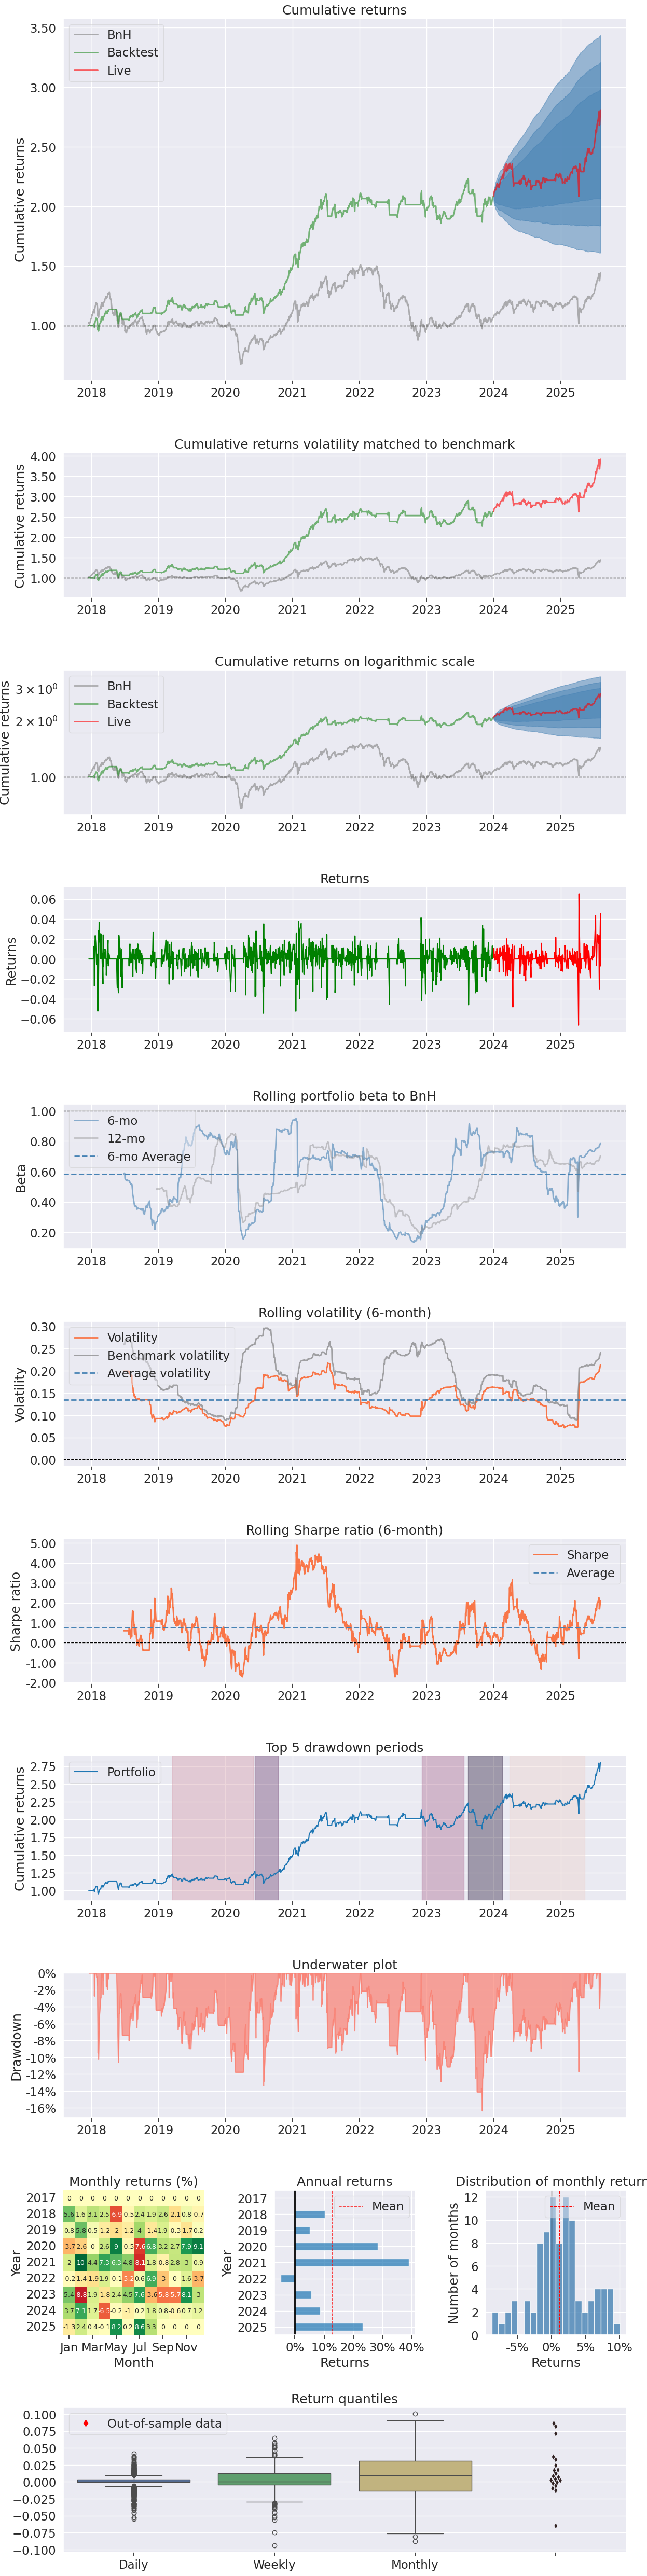
It basically beats BnH (buy and hold), but we still need to watch how volatile the alpha is.
Assessment:
This basic strategy can basically work, but there are still many doubts about its alpha metrics!
This post is already very long; I hope it is useful to everyone. In the next part I will write about using an ML model to assess the impact and find trades for these two indicators.
Thank you all for reading!
Nguyen Le Khanh
Technical Analysis Course – CMT Level 1
Green Chart designed this course specifically for candidates in Vietnam who want to study and prepare for the CMT Level I exam. The programme includes 25 sessions of theory, practice questions and mock exams. Students also receive the course textbook, question bank and mock exams free of charge for their exam preparation, and can retake the course for free for life.
See more details about the course here.