
Contents of this article
In this post I focus on analysing the fundamental factors that affect the VN-Index, without limiting the type of model used to evaluate them. Besides models, I will also test how effective labelling is for finding strategies.
Objectives of this post:
-
- Use fundamental information (P/E, P/B, …) to assess its impact on the VN-Index and to forecast it.
-
- Find a suitable trading strategy based on this data.
Conclusion:
-
- Despite my best efforts, the model could not outperform the benchmark!
-
- Over the same period, the eyeballing approach still seems to score better, with good alpha!
-
- Even so, I am not judging which is better, because I may not have mined the ML model correctly. Machine learning has many advantages: I can minimise observation time and replace it with statistical tests to use as many variables as possible. However, computing resources and the intuition to find models remain the key factors.
Notes:
-
- This post is purely my personal view and analysis, based on my limited knowledge, so it is somewhat subjective. I would very much welcome everyone’s feedback!
-
- The writing style is close to everyday speech, not very academic, and sometimes mixes in English terms; I hope readers will bear with this.
-
- The data is accessed and calculated from the vnstocks library (http://vnstocks.com).
-
- In this part I use TimeseriesCV to evaluate and select features and models.
-
- The data covers the VN-Index from 2017 to date. The train/test split differs from the previous post so that I have a validation set within the training period; specifically, I chose 01-06-2024 (1 June 2024) as the cut-off date.
Labeling
Labelling means attaching labels; to keep it simple, I think of it as evaluating signals from past data. After some time researching these models, I found this step very important, because the model is trained on these signals. In this post I try labelling in two ways:
-
- Method 1: simply based on the daily return: if it is a gain the value is 1, if it is a loss the value is 0.
-
- Method 2: I classify by regime based on a regression algorithm, which I quote verbatim as the “trend-scanning method” from Lopez (2020), Machine Learning for Asset Managers. The algorithm follows this formula:
-

-
- Where: l is the extended observation window (looking into the future from the current point); x is the price of the observed asset —> x at [t+l] is the value of x at time t over the next l days.
-
- The algorithm regresses x to find the value of l in the range 0 to L-1, where L is the look-forward horizon, and from that calculates Beta 1, the regression slope between price and forecast time. This Beta shows the linear relationship between price and observation time. However, Beta 1 also varies with the observed values, while I need the signal to be up, down or flat (corresponding to signals of 1, -1 and 0). So Beta has to be scaled by its standard deviation (heh), and this scaled value is the t-value:

- From this we find the t-value with the greatest statistical significance within the window [0,…,L-1] to evaluate the signal. Roughly speaking, we find the trend with the highest statistical significance and label the signal from it. So we have found the trend, but how do we determine the signal (up or down)? We just… look at the sign of the t-value to get the trend (=]]), and that’s it (heh).
-
- Here I scan with L = 20 to find the most suitable trend signal within this period.
-
- However, as in the previous post, I cannot short the underlying, so every signal with a value of -1 (downtrend) is replaced with 0 to make classification easier.
-
OK! Now let me plot these signals:
These are the signals from method 1:
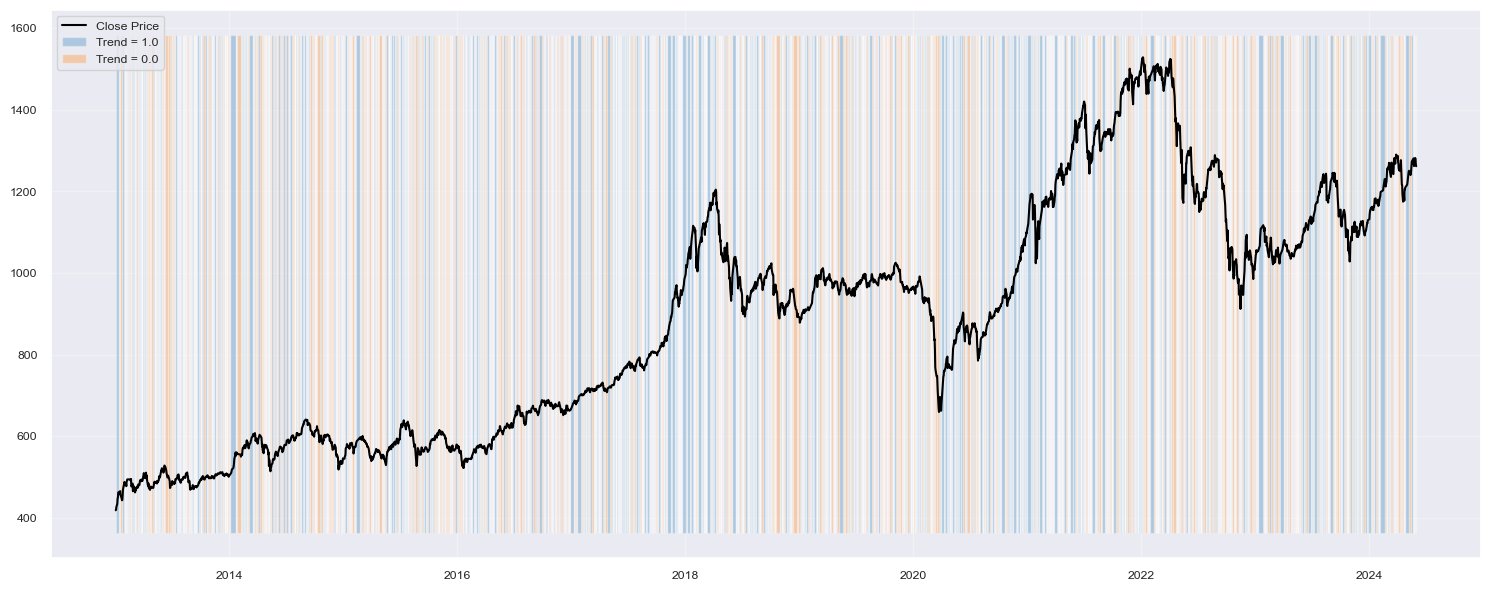
These are the signals from method 2:
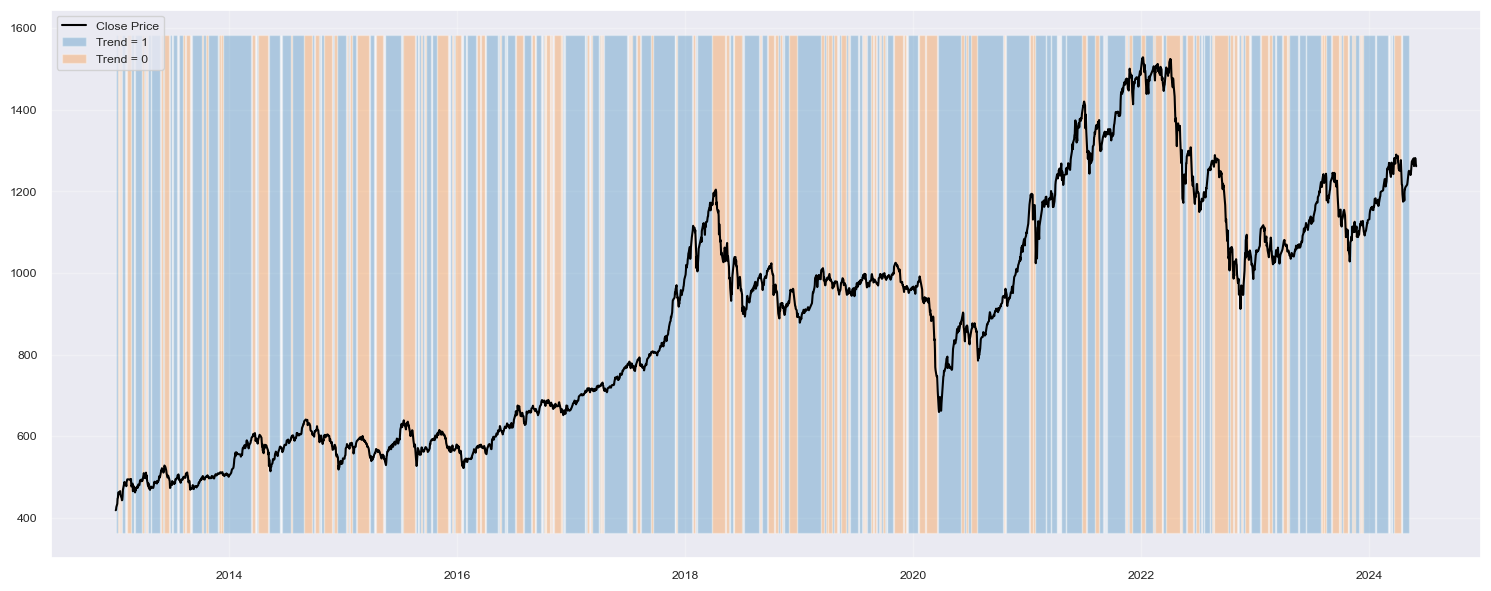
You can see that, compared with method 1, method 2 is much less noisy and reflects the market’s drawdowns quite accurately (yellow marks drawdowns or neutral).
—> I will choose method 2 to label the data.
Feature Engineering
Feature engineering, as I understand it, means constructing the variables fed into the model. Unlike the approach in the previous post, where I fixed a few observed metrics in advance to trade on, here I create observed values and feed all of them into the model for it to learn. A model can be thought of as a formula for finding signals: in the first approach that formula came from observation, whereas in this approach the machine finds signals with good trading value.
In Part 1, to choose the observed values, I manually calculated the threshold cases for the z-scores of P/E and P/B for each specific observation window, then picked the values that produced the most stable profits according to three measures: the Sharpe, Sortino and Calmar ratios. In this part I calculate all of these values and combine them into a single data table to find the variables with the highest explanatory power.
The features used in the calculations are:
-
- P/E and its variants based on the rolling mean, standard deviation and z-score for each group, and the % rise or fall in P/E over each rolling window, using the windows from Part 1 (likewise for P/B).
-
- The P/E and P/B signals based on the thresholds observed in Part 1.
-
- Day, month and year features.
-
- And some new breadth and volatility features, as follows:
-
- Market volatility: I calculated this from the volatility of all stocks in the VNALLSHARES basket to create something like the US VIX. Of course, it is only historical volatility, so it cannot capture the time element the way the VIX does (the VIX is based on options, and options have a time-value component). The index is shown in the figure below
-
- Market new high MA: this is the indicator I used in the breadth post to find alpha.
-
- Market High Low Breadth: this measures the number of advancing stocks out of all stocks in the VNALLSHARES basket. It looks like this:
-
- And some new breadth and volatility features, as follows:

This gives me a data table with about 168 features for forecasting. Now there is a new problem: all these variables are calculated over different time windows, so they are very likely to be multicollinear (yet another statistical defect). Multicollinearity inflates the model’s results during training, which leads us to pick the wrong model as the genuinely good one. There are several ways to limit this, for example:
-
- Use correlation to remove multicollinearity; usually a correlation > 0.8 is considered multicollinear.
-
- Use VIF to assess multicollinearity; a VIF > 10 indicates a very serious multicollinearity problem. What is VIF?
-
- VIF (Variance Inflation Factor) is calculated as follows:
-
- Where R2 is the R-squared of the linear regression of the features on one another. Roughly, you regress every feature on all the others; if R2 is above 90% => VIF > 1/0.1 = 10. The higher R2, the larger the VIF and the bigger the problem, so only an R2 below 90% is considered acceptable.
-
- Use VIF to assess multicollinearity; a VIF > 10 indicates a very serious multicollinearity problem. What is VIF?
-
- Use Factor Analysis or PCA (Principal Component Analysis) to transform the variables into meaningful factors.
-
- Use other regression methods such as Ridge, Lasso, PLS… to assess which variables matter
It is quite a headache. Here I use only the most classic method, correlation, but with Spearman correlation (similar to measuring the Information Coefficient in the breadth post).
Running the correlations on the features gives the following results:
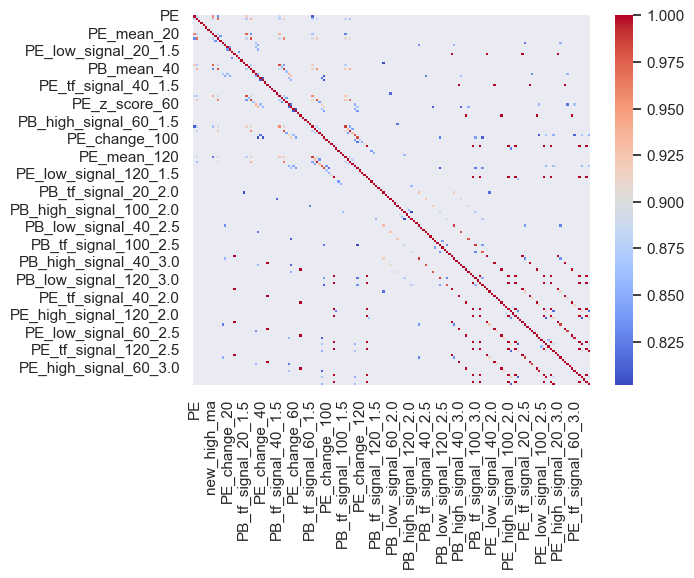
These features seem to be heavily correlated with each other, leopard-print style. I need to find the features with strong multicollinearity that I can see at a glance, while still keeping the necessary characteristics. How do I keep the necessary characteristics? I only know by putting them into a model, so I have to filter features and train the model at the same time. But which model?
OK! These questions lead to the main issues:
-
- Which model are we looking for?
-
- Is there a way to combine correlation and the model to find suitable features?
-
- Which metrics should be used to assess fit and select models?
Now let me move on to the next section to answer these questions.
Train model
Here, subjectivity appears once again (=]]): I will make some assumptions, or set a subjective scope, to answer these questions:
-
- The model is a classification model. Here I train the following models: Logistic Regression, Random Forest Classifier, Support Vector Machines and Decision Tree Classifier (there is plenty of material explaining these models; here I just run them to find the best one).
-
- For fit, I use a method available in Python’s scikit-learn library: TimeseriesCV (time series cross-validation). Why?
-
- Financial time-series data has a big problem: serial correlation (or autocorrelation). Roughly, past prices can affect current prices (which is what gives us momentum to trade, after all =]]).
-
- TimeseriesCV looks like this figure: the dark area is the range used to estimate the model parameters, the light area with a gap in the middle is the range used to calculate the test values, and this rolls forward until all the training data is used.
-
- Why split into these stages? So that I can train and test the model on the selected features to find the right number of features, for the right models, with the right metrics (=]]), while limiting data leakage. Why would there be data leakage? Because it is a time series and we do not know how long momentum will persist in the data, so if we randomly pick test sets from the data, they may well carry momentum from certain periods, which leads to data leakage.
-
- For fit, I use a method available in Python’s scikit-learn library: TimeseriesCV (time series cross-validation). Why?
-
- The metrics for choosing the right fit are an even more subjective area, and honestly I feel a bit shaky on this part, but I will try to evaluate it as follows:
-
- There are several metrics for evaluating a model: Accuracy, Precision, Recall, F1 Score and ROC-AUC. Accuracy usually gets attention first; it simply measures how often the model is correct. However, if the labels are skewed or biased, accuracy is meaningless, because the model will fail to classify the minority label, or vice versa.
-
- In our observations with the “trend-scanning method”, the label balance is as follows: labels with a value of 1 make up 63%, meaning the data is imbalanced. If we train a model on it, the model is likely to give more predictive weight to labels with a value of 1. I can increase the weights to reduce this bias, or use metrics such as AUC, F1-Score and the Precision-Recall Curve.
-
- Subjectively, I choose the Precision-Recall Curve to select the best model and features.
-
- The metrics for choosing the right fit are an even more subjective area, and honestly I feel a bit shaky on this part, but I will try to evaluate it as follows:
Then I put all of this into something called a Pipeline. scikit-learn has a pipeline like this: it runs each task in sequence while I iterate through cross-validation (so convenient =]]), then saves all the results and outputs the optimal values.
Now I train the model, with the following results:
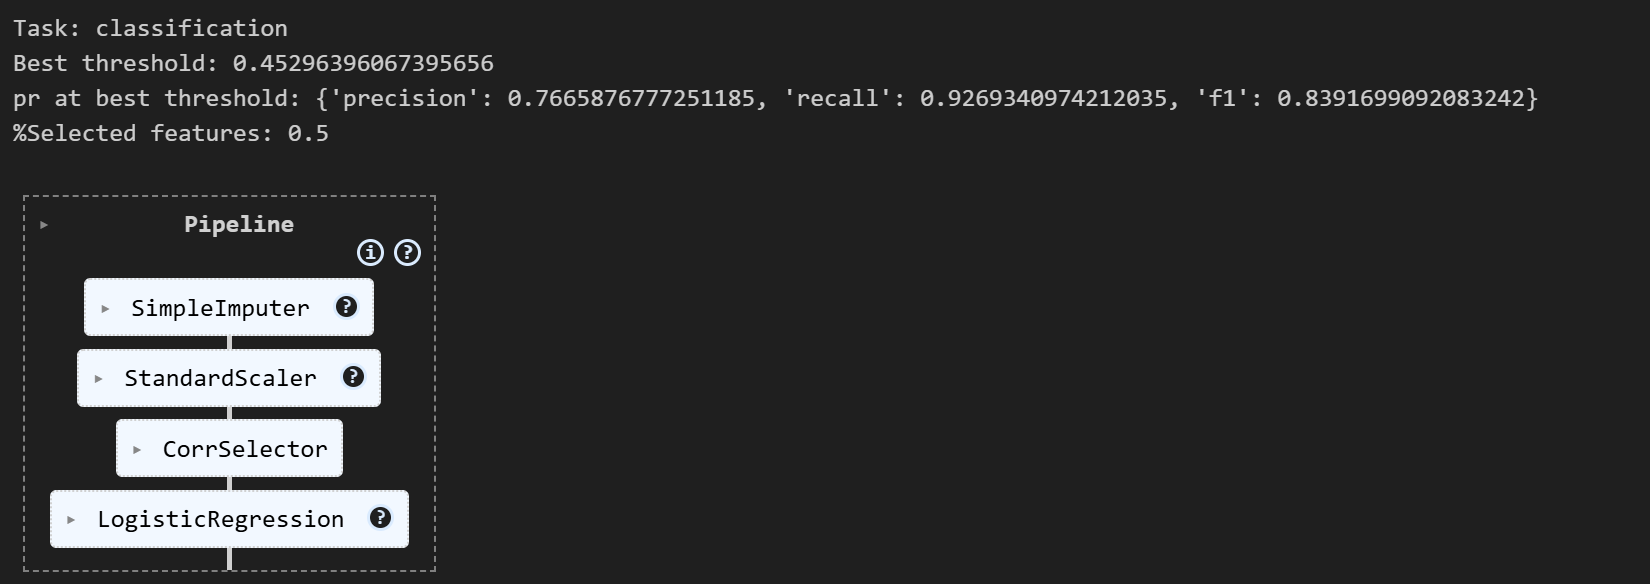
So the beauty queen of classifiers is Logistic Regression! The selected features make up 50% of the total (about 81 features).
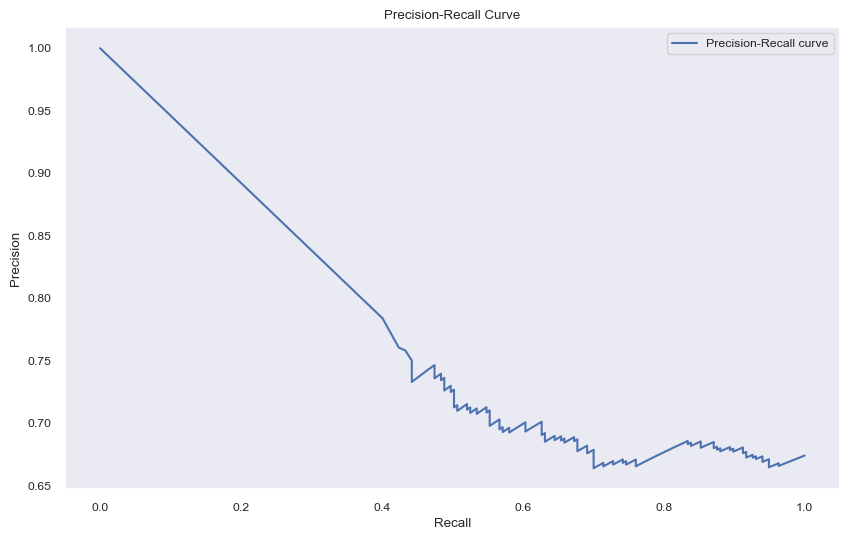

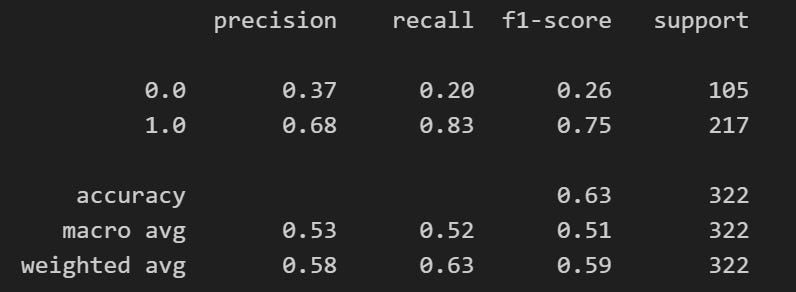
In the sample, prevalence (the % of 1 values in y-test) is 67%, and our beauty queen predicts higher than that. That is only so-so, since 0.73/0.63 = 1.09, meaning the model improves only 9% over a random signal. In addition, at high recall (→ close to 1), precision drops to ~0.66–0.68 ≈ very close to baseline ⇒ the model’s tail cannot discriminate.
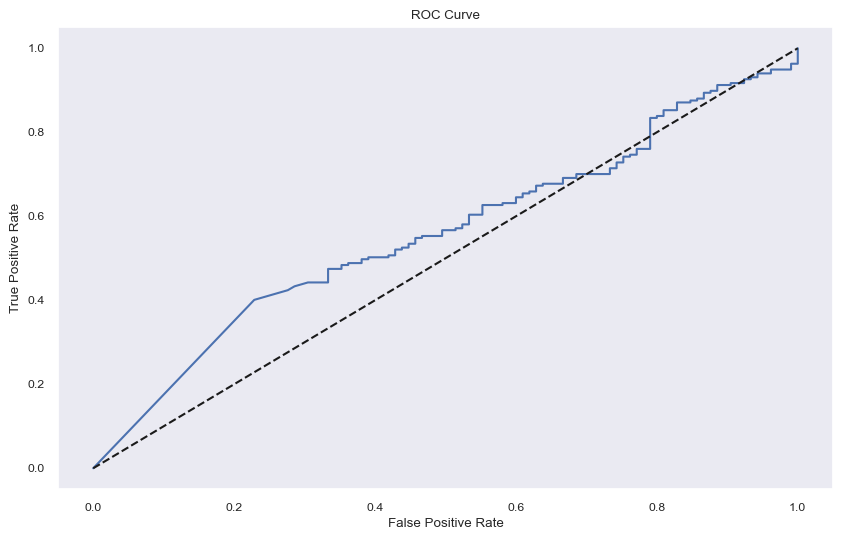
The AUC here is quite low, only about 55.9%, i.e. just above the 50% line in the chart, which means the classification results are still significantly skewed. This is a tough problem, and it can come from several factors:
-
- Missing features: many features may have been dropped by the correlation method, or the basic set of features may simply be weak (168 is not enough and more need to be found). However, with too many features you run into the so-called curse of dimensionality (=]]), where the data history can be shorter than the number of observed variables, leading to wrong or skewed forecasts.
-
- Labelling problems: the labels are fairly noisy and the data history is not long enough to train all this. Or the label weights may be wrong! In fact, Lopez offers some solutions in his books, such as time-decay weighting and weighting by overlapping label periods.
-
- The model is not powerful enough to forecast!
Checking the data again on the y-test set, I get this result:
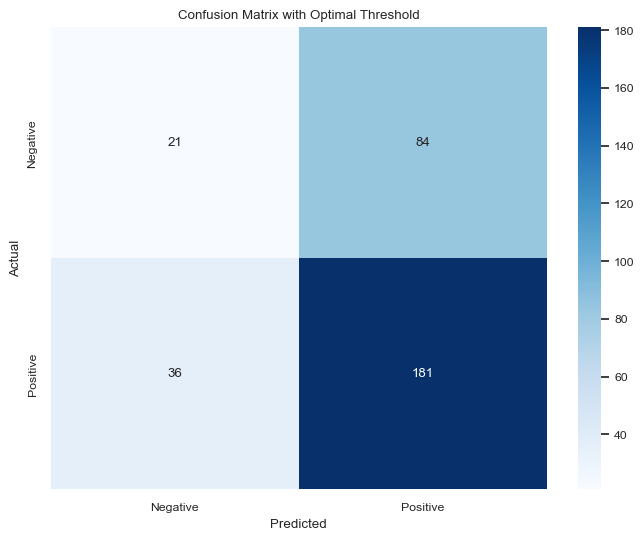
You can see the data is quite skewed, and my predictions only classify buy signals (1) reasonably well. Looking more closely at the results in this table, the model performs quite poorly at finding exit points (value 0).
OK! Overall, these problems may require a lot of mining, both of models and of data processing! I also tested Lopez-style weighting extensively, and the results were not very different. In my view, what matters is:
-
- Features that are genuinely meaningful;
-
- A model that can genuinely classify: each model is good at evaluating particular patterns, particular stocks or particular datasets; if I am too rigid in training one model for one stock, it will not work on another dataset.
-
- Using a meta-model to improve results: a type of model that takes only the outputs of other models as its training and forecasting data (like a model that forecasts the market regime from the predictions of stock-market KOLs =]] – sometimes doing the opposite of what the KOLs say works, and sometimes it doesn’t =]]).
Testing and mining features will probably have to wait, since it is resource-intensive and beyond the scope of this post (which focuses only on P/E and P/B). OK! After training the model on the results I found, I will run a backtest!
Backtesting
The backtest on data from 2018 to date gives the following results:
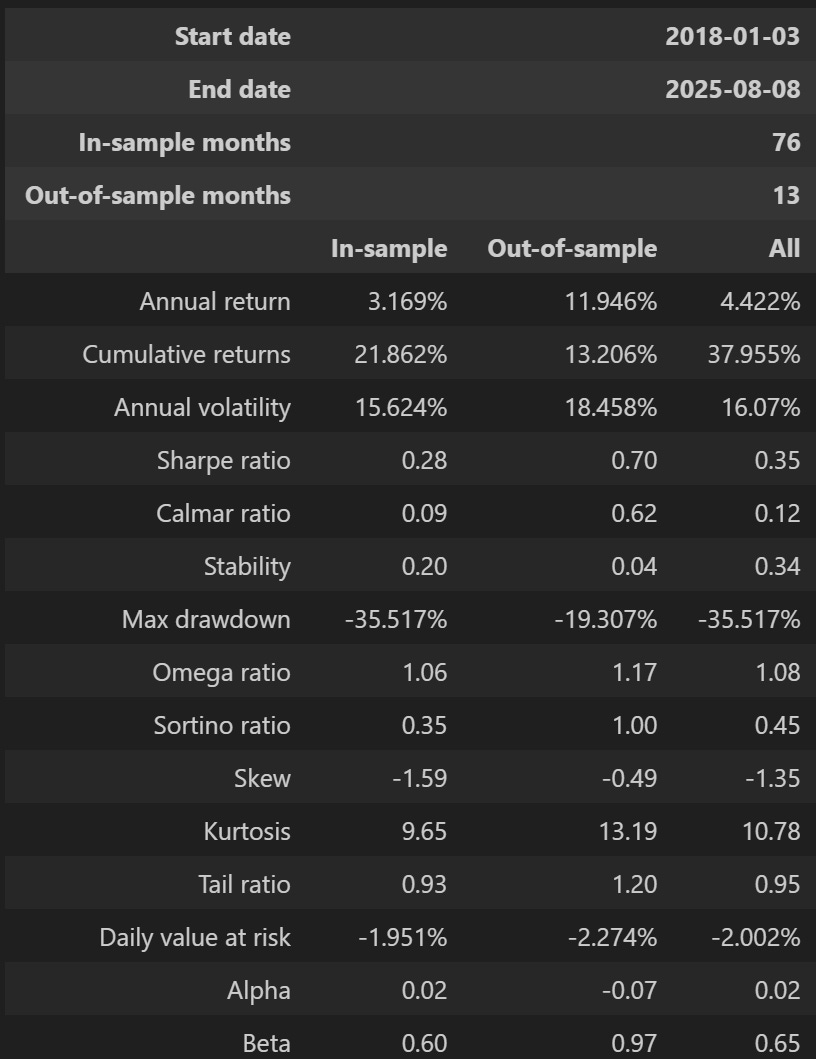
Note that the period from 2018 to 06/2024 is the training period, so those results are only for comparing the training and test sets. Still, the test set shows acceptable results, with Sharpe, Sortino and Calmar ratios of 0.70, 1.0 and 0.62 respectively. However, alpha is negative and Beta is as high as 0.97.
Plotting it for clarity:
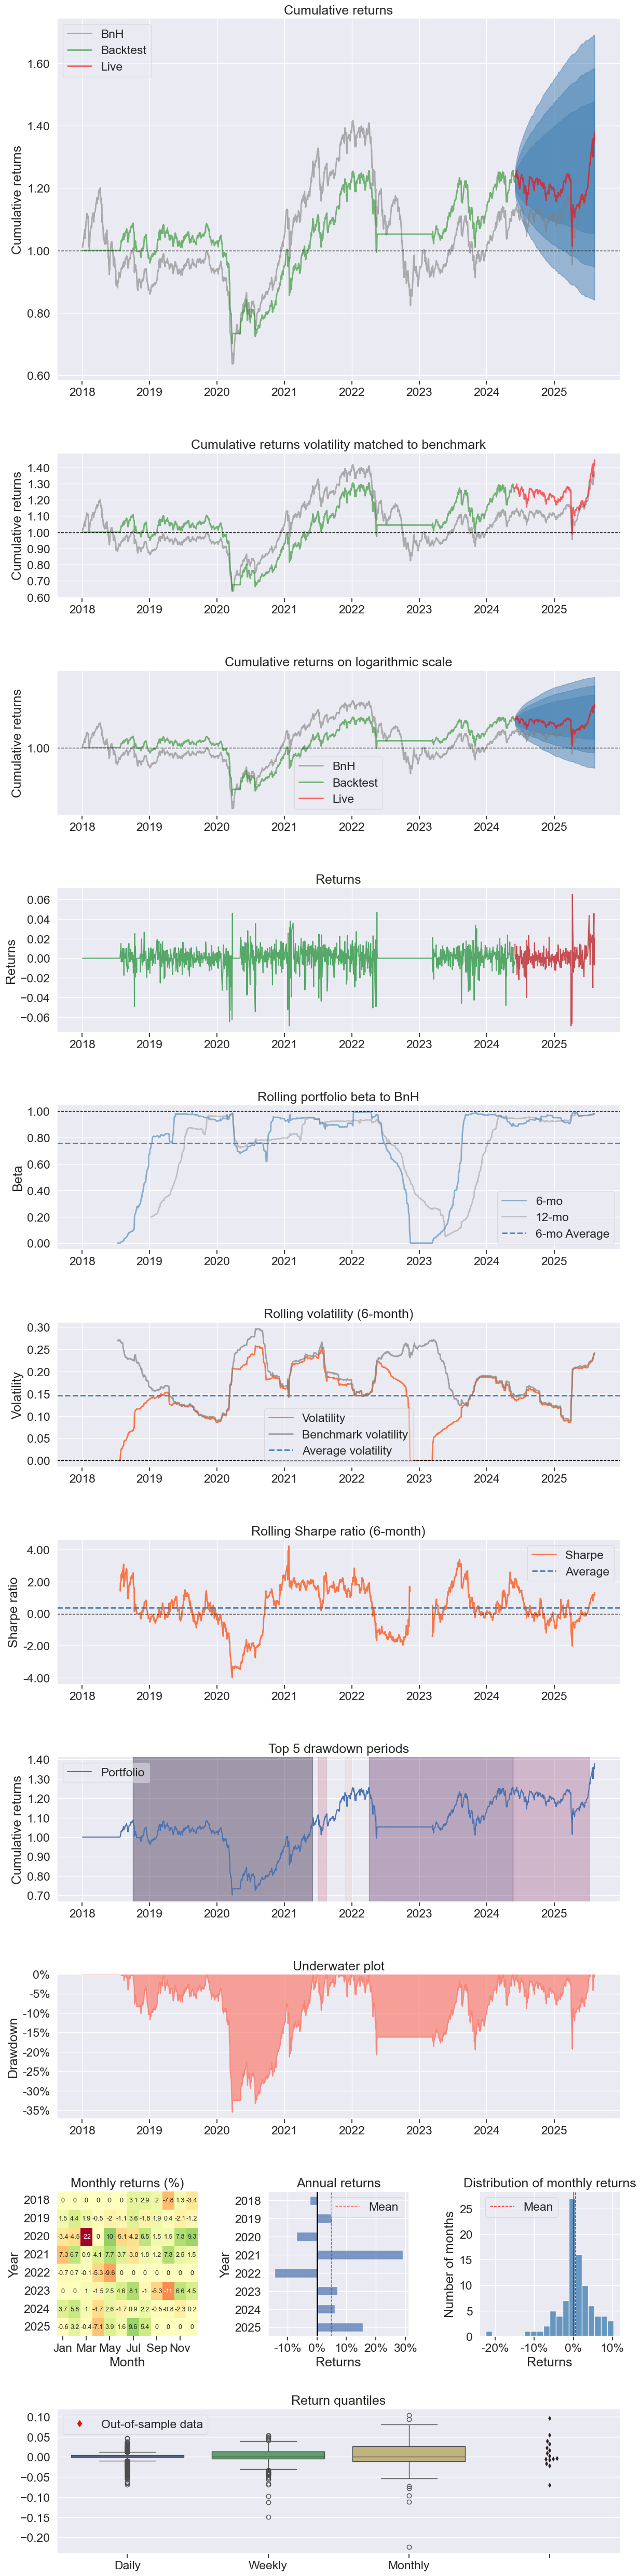
Returns in the live test from mid-2024 to 2025 are also so-so, with 6 negative months out of 18 observed. Compared with buy-and-hold (BnH) from 2024 onwards, the results are as follows:
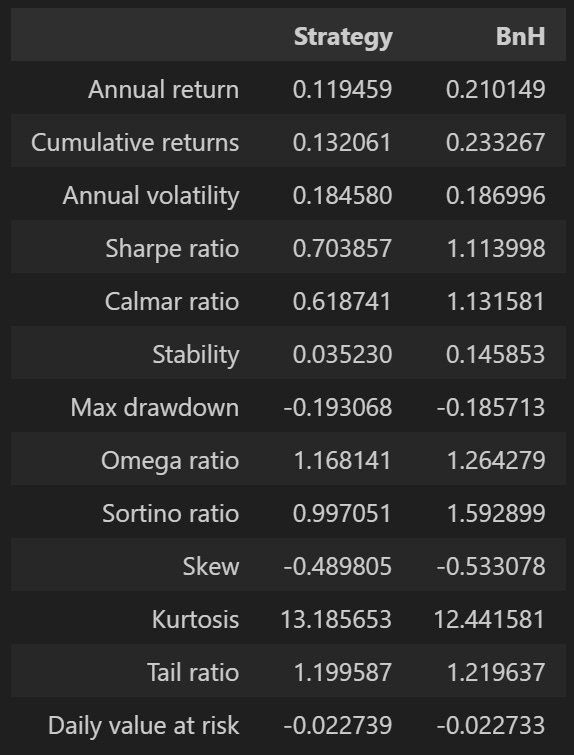
Ugh! The result could not outperform BnH from 2024 to date. Every metric is worse or roughly equal!
The rolling Sharpe is also quite erratic, at times deeply negative!
Conclusion:
-
- Despite my best efforts, the model could not outperform the benchmark!
-
- Over the same period, the eyeballing approach still seems to score better, with good alpha!
-
- Even so, I am not judging which is better, because I may not have mined the ML model correctly. Machine learning has many advantages: I can minimise observation time and replace it with statistical tests to use as many variables as possible. However, computing resources and the intuition to find models remain the key factors.
This post has become quite long! I hope it is useful, and I look forward to your feedback and discussion.
Thank you, and best regards!
Technical Analysis Course – CMT Level 1
Green Chart designed this course specifically for candidates in Vietnam who want to study and prepare for the CMT Level I exam. The programme includes 25 sessions of theory, practice questions and mock exams. Students also receive the course textbook, question bank and mock exams free of charge for their exam preparation, and can retake the course for free for life.
See more details about the course here.