
Contents of this article
The MACD is one of the most popular indicators among technical traders. It is an effective indicator for identifying the trend and price momentum. Not surprisingly, many traders design and build trading strategies around the MACD indicator.
The MACD strategy we want to introduce today combines the MACD indicator with the inside bar candlestick pattern. It takes a simple approach: use the MACD to identify the trend and the inside bar as a low-risk trading signal.
The MACD and inside bar trading rules
Buy (long) rules
- The MACD is above the zero line.
- Buy when price breaks above the high of the inside bar.
Sell (short) rules
- The MACD is below the zero line.
- Sell when price breaks below the low of the inside bar.
Let’s look at examples of both a winning and a losing trade with this strategy
A winning trade
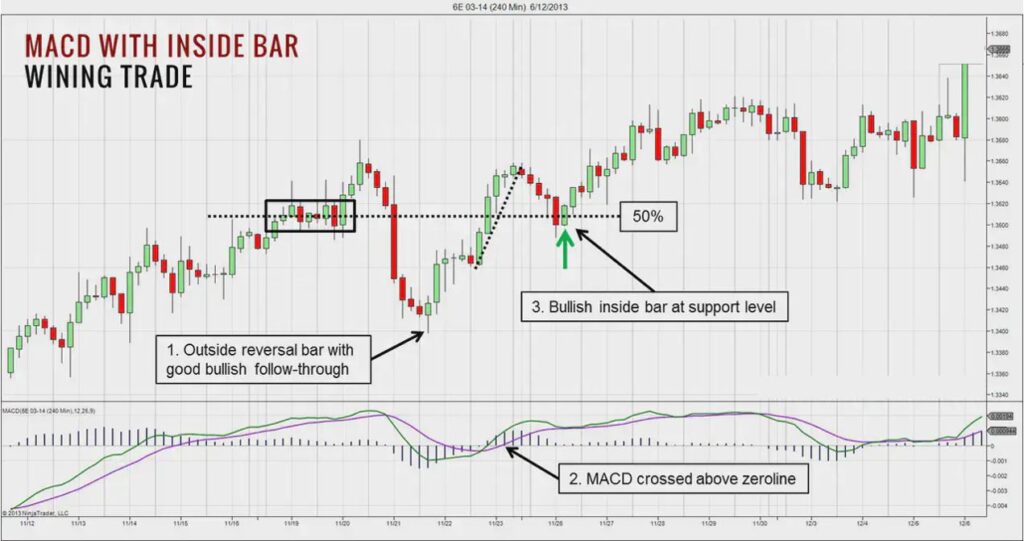
This is the 4-hour (H4) chart of the 6E futures contract. It shows a long trade with an excellent reward-to-risk ratio.
- After seven consecutive bearish candles, a bullish outside bar reversal appears, starting a strong price recovery.
- This strong rally pushes the MACD above the zero line.
- Price pulls back and stalls at support (a consolidation area at the 50% retracement of the previous advance). A bullish inside bar forms in this area, and we enter when price breaks above the inside bar’s high in the next session.
- Place the stop-loss at the lowest lower shadow of the inside bar pattern.
A losing trade
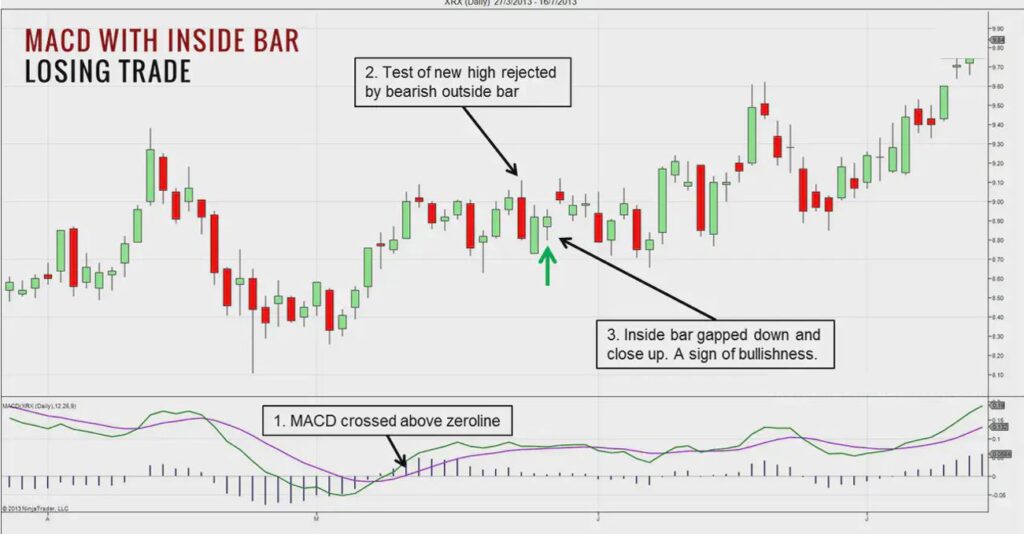
This is the daily (D1) chart of Xerox stock. It shows how ineffective this strategy is in a sideways market.
- The MACD crosses above the zero line, suggesting an uptrend.
- However, price cannot get past its previous high, as shown by a bearish outside bar. After this bearish candle, a strong bullish candle appears. These conflicting signals are likely to create uncertainty. With an unclear trend, breakouts usually fail.
- An inside bar does appear in this situation. However, in a sideways market, this inside bar trade failed just a few sessions after entry.
Happy trading !
Technical Analysis Course – CMT Level 1
Green Chart designed this course specifically for candidates in Vietnam who want to study and prepare for the CMT Level I exam. The programme includes 27 sessions of theory, practice questions and mock exams. Students also receive the course materials, question bank and mock exams free of charge, and can retake the course for free for life.
See full course details here.